
MarkStPeter
@t_MarkStPeter
What symbols does the trader recommend buying?
Purchase History
پیام های تریدر
Filter
Signal Type

MarkStPeter
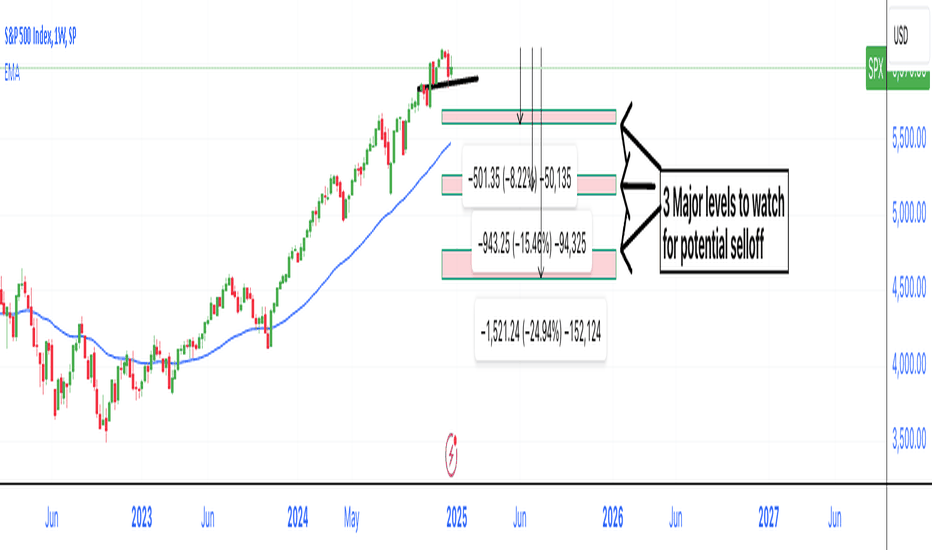
Hi Traders, SPX is showing signs of a potentially bearish formation—a head and shoulders top. Historically, this pattern has signaled increased downside risk for equity markets. As the price draws closer to the neckline, a break below could take us to the next major support level around 5,600. This will be a crucial zone to for traders and investors to monitor closely. Market conditions could sour quickly and an accelerated drop should cause traders to act cautiously over the next couple of weeks. Good luck out there. Mark

MarkStPeter
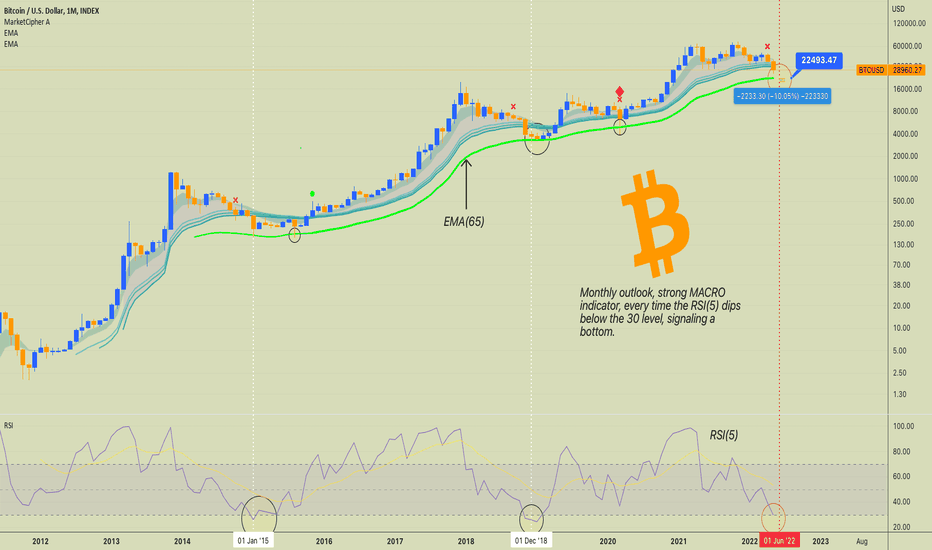
Hello Traders, Here is the monthly outlook showing the Bitcoin price action on the logarithmic scale. The bright green line is the EMA(65) and the Relative Strength Index is set to an RSI(5). What to watch? Watch for the price action to tap, hit, or cross the EMA(65), and watch for the RSI to break below the 30 level,(we are very close) With current market conditions, we are in a buy and hold. Buying extremely strong projects at extreme discounts, to hold for the long term, to capitalize on massive gains. Unless you're a savant trader. The tried and true is buying during these exact market conditions. You won't buy the exact bottom, you won't sell the exact top. But we can get damn close when using historical price points with the highest rate of return. This is one of those times. You'll never feel 100% confident in any purchase or sale bc nothing is certain. But you can increase those odds by having patience and setting buy levels. The EMA(65) is sitting around $22,262(depending on which chart you're looking at & how much history "said" chart has). So if I was a gambling man, which I am. I've pre-set my purchase order at the EMA price. As well with orders at a 10% deviation set below ($19,900+/-) and set above($24,500+/-) the EMA price point. What's interesting is that the bottom10% deviation price point at $19,900, lines up almost perfectly with the 2017 top at $19,804, which could also be a strong bottom signal, flipping what was once resistance into support. What's my mind frame during a time like this? I first got serious about crypto right after the 2017 crash started taking place, I made zero money, but I lost a whole lot, or at least it was a lot to me at that time. I originally learned of Bitcoin back in 2013 but it was just way too over my head, and I didn't give it a second thought. Then during the 2018-2020 crypto winter, I worked as much as I could selling as many homes as I could(I'm a realtor) to stack cash, and purchase as much crypto and stocks as I could. This proved to be the right approach. Then once things really started to kick off after April 2020 I took a year off from real estate, to focus solely on crypto, which again, proved to be the right approach. Now, as we sit here in my second or 3rd bear market depending on how you want to look at the May 2021 crash, I don't see any reason to deviate from the path that has proved profitable. Put the head down, work the face-off, and run with the bulls when the market says, Ser, wen moon?? Good luck!

MarkStPeter
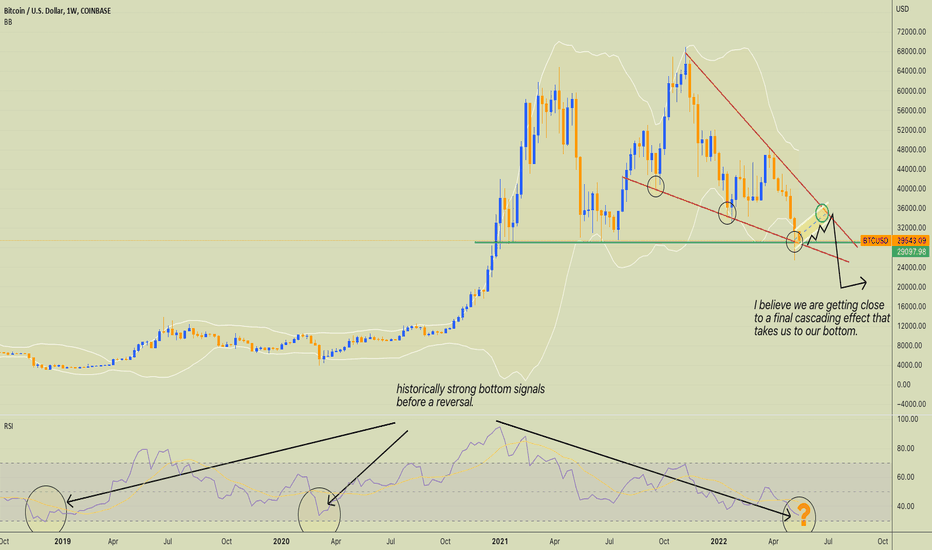
Hi Traders, Bitcoin is showing some strong signals of finally hitting a bottom. Though we still have a large possibility of another cascading/ capitulation. The weekly RSI has only hit a 30 or lower-level two times before. Once in 2015 & 2018. We couldn't ask for a better opportunity to enter the market with the reassurance of buying at a major discount. We can't read the future but rather weigh the odds of previous reaction points providing the highest rate of return. Buying the 2015 RSI level of 30 would have returned an 11k%(+/-) from trough to peak ( obviously, this is if you sold the exact top). Buying the 2018 RSI level of 30 would have returned a 2k%(+/-) Now, the question is what could we expect to see in return from buying the 2022 RSI level at 30 (if we hit the 30 level)? The stock-to-flow model is saying a price of $500k. I believe we could see a return from trough(BTC price @ $21.5k) to peak of 1500% in the next bull run, which would lead us to a price point of around $350k. All make-believe until action takes place, time will tell.

MarkStPeter
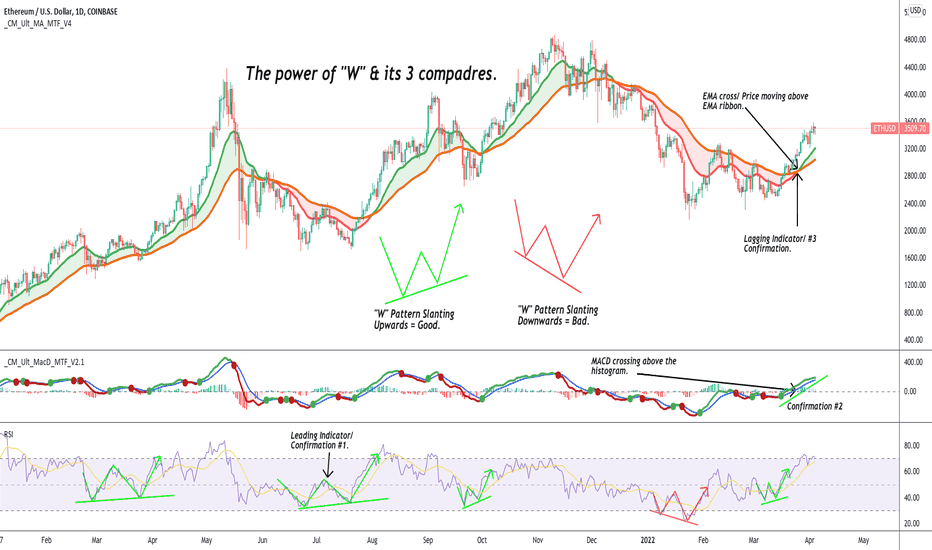
Hi Traders, If you've ever questioned your entry strategy or have entered too soon, or found yourself gun shy and entering after the party is over, then you may find this guide helpful. This isn't a over the top strategy, nor is there any special skill needed to apply it to your trading. I've found personally, that the easier and more simple it is, the better results I get long term. Over the years, I've simplified this down to three confirmations before entering a trade. Yes, you will leave money on the table by not getting in at the exact bottom, but how many times can you count on a hand that you've done that successfully? Probably not many... Of course, this is just technical analysis and it will serve you well to have a "fundamental strategy" for picking the projects you choose to enter in the first place. But after you've located the projects you want to buy, you then can use technical analysis to locate a price point to enter the market. Here are the three confirmations I live by: Confirmation #1: ("W" Pattern) - RSI/ Price action forms a clear "W" pattern. - The two bottom points slant upwards. - You could call this a double bounce/ bottom as well. Confirmation #2: (MACD) - MACD signal line crosses above the histogram. - Signal lines are converging from each other. (Moving apart/ widening) Confirmation #3: (EMA cross/ Final Confirmation) - EMA cross - Price Action crosses above the EMA lines/ ribbon Pretty simple right? Well, you would think so but then comes the mental aspect. Having the mental fortitude to always live by the rules you set for yourself is what separates the pros from the amateurs. You don't FOMO, you don't fall in FUD, and for the most part, you don't listen to others, and especially don't listen to others without doing your proper due diligence. Conducting TA is only one step in the process and in my eyes, it's the second step. You have to have a process for locating projects that are going to present the highest follow-through on the TA you chart out. Bc yes, a lot of false signals can come from set-ups you think would be a winner, to only have the set-up fail on you. This generally comes down to a weak project with weak fundamentals. Hopefully, this was understandable and simple. If you've been around trading for any amount of time, you will most likely heard of all three of these indicators. Good luck!

MarkStPeter
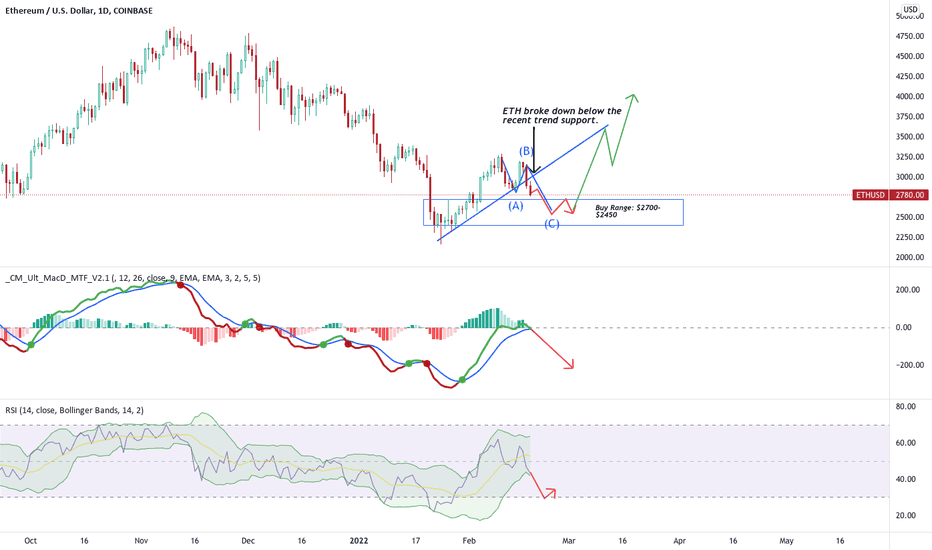
Hello Traders, Hope all have been surviving and better yet thriving in these conditions. Whether you're looking at the charts, the news, or talking to a neighbor, it's difficult nowadays to not hear some form of FUD. Politically & economically. Though, I do believe we still have a little gas in the tank, as long as the car doesn't sit idle for too long. As many of us already know we are headed for rate hikes. With the first set to happen sometime in March after the FED meeting. With most of us aware of this news and expecting it, I see this adding fuel to the risk-on asset classes. Humans love to gamble, and if they know there's one more strong hand on the table, they usually, more than not take part. Besides pure speculation and an assumptive thought, the chart is still showing us we are in a downtrend. Yes, we've seen some positive price action to the upside as of late until yesterday's dump. But we have to keep this in mind. Bull Market: Positive news: Price goes up Negative news: Price goes up Bear market: Positive news: Price goes down Negative news: Price goes down So long are the days of BTFD. And having some course of certainty that our bets will pay off. There's a lot of teasing happening in all markets right now, except for mostly Metals & oil. You think you're good, still good, still good, and BAM.. Market tanks 15%. Here's my timeline of what I believe we could see happen. Pending no further devastation with a pending war on the horizon. The last week and first few days of March will be primarily Bullish for most risk on assets. We'll call these the Tech stocks and larger crypto assets ( Tesla, Meta, ETH, BTC, SOL, FTT, ETC). As we get closer and closer to the FED meeting, we will start to see smart money exit positions, as they've taken the gamble of buying now while prices are down. Then we will see the hesitant buyers who bought green days start to sell a day after our first major red day. Then lastly it will be the complete Noobs who lose their shit with frustration and sell on the day of the fed meeting/ first rate hike. If for whatever reason this little thesis plays out and we get a week or 10 days of bullishness then I'm targeting a price of around $4400-$4800 for ETH. (DYOR/ never financial advice) Do not listen to me. Im crazy. Thanks for taking the time to read this Rant/ Forecast/ diary. Take care. Mark

MarkStPeter
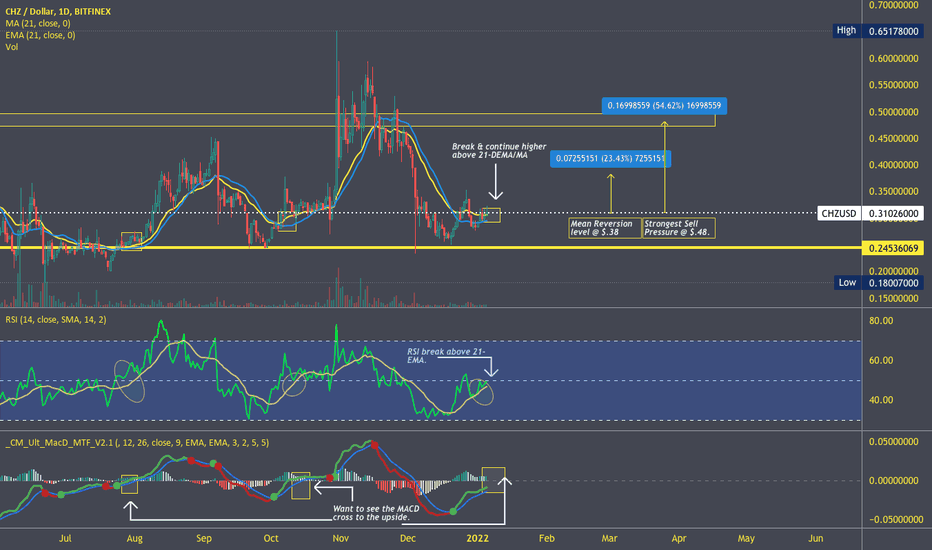
Hello Traders, Here's a chart analysis for CHZ. Besides the technicals, there are a lot of big players talking about this project and showing support. Over the course of the next year, we should start to see more adoption take place as more professional sports teams adopt the use of CHZ. Technically, there are a few levels I'm watching for taking profits, which are $.38 & $.48. We've broken above the 21-DEMA, RSI has crossed above the 21-EMA, and we got a cross on the MACD. Not Financial Advice, protect yourself with research and due diligence. Good luck!

MarkStPeter
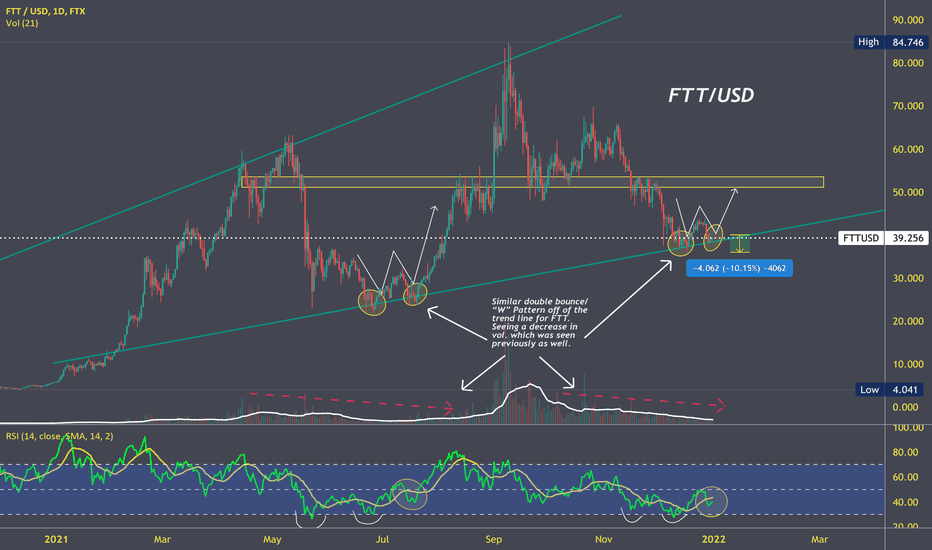
Hello Traders, FTT is setting up possibly for a move to the $51-$53 range after flashing similar signals. RSI bounce off of the 30 range, double bounce off of the trend line, and decreasing volume. Social sentiment is also positive. As well as a lot of outflow from exchanges. As we all know FTX is ran by SBF, sometimes it pays to invest in the ones running the company. (This should always be in your investment strategy). Setting a stop-loss at the $35-$34, and take profits at $49, $51, & $53. And this is not financial advice. Good luck!

MarkStPeter
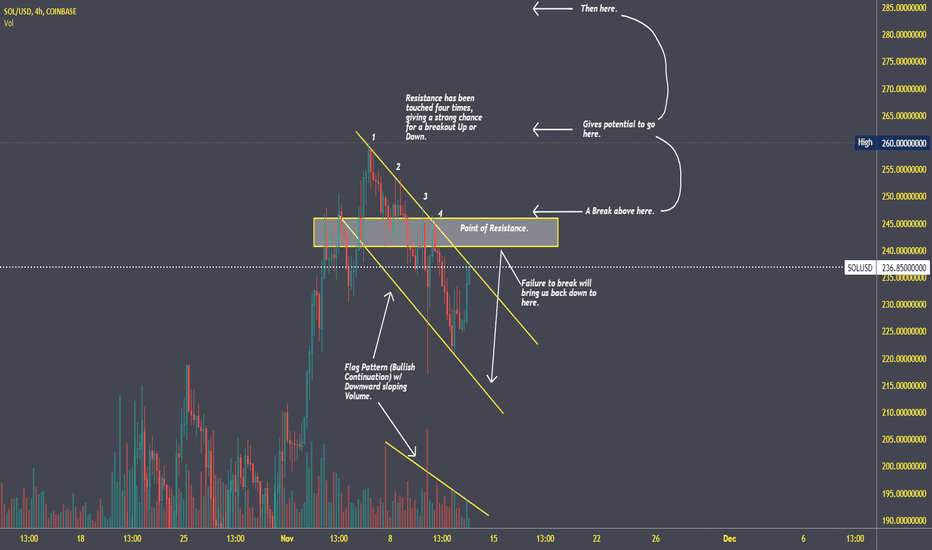
Hello Traders, Take a look at the chart. We have a potential bullish continuation pattern forming on Solana's chart. We've seen the resistance be touched four times now, which sets us up for a strong breakout, either to the downside or upside. Price action has formed a Flag pattern with downward sloping volume, confirming the pattern. There is strong resistance at the $241-244 range, upon a successful break above this resistance zone, we could look at targets of $255+-$285. Giving us a 9-20% ROI potential. Safe trader = Wait for a break above resistance. Risk trader = Taking trade now w/ tight SL. (This is a higher risk on the weekends, as they present a higher level of volatility. ) Never financial advice. Good luck!

MarkStPeter
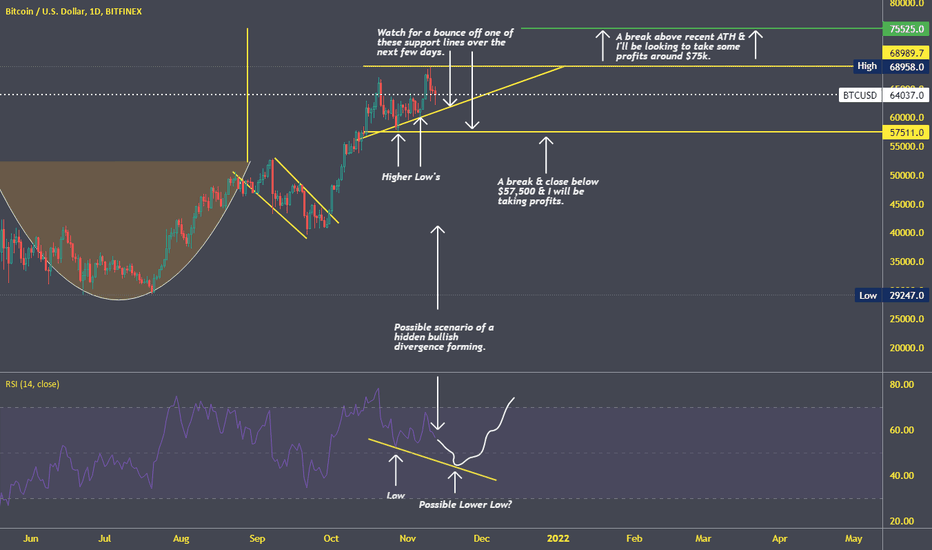
Hello Traders, Take a look at my chart and let me know what you think? What's your strategy over the next month or so? We should see some further downside potential over the next few days. A couple of support lines are showing as potential bounce ranges. I'll take profits if we break and close below the $57,500 range. And if we break above recent ATH, I'll be taking some profits around $75k. Hope you all have a great weekend. Take care.

MarkStPeter
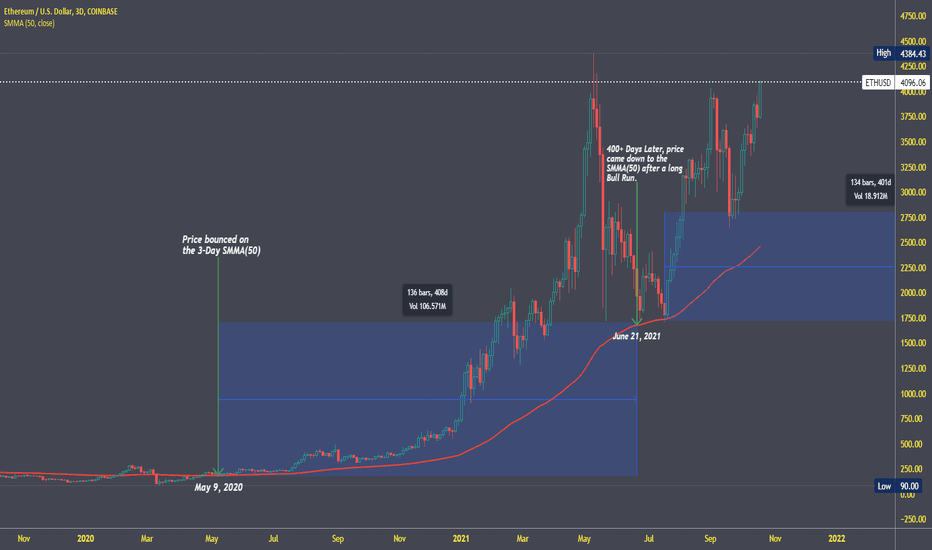
Hello Traders, I found this very interesting when looking back through ETH price action respecting the SMMA(50). We have now seen two cycles follow a pretty similar timeline, of around 400+ days of a bull run. The question is, do we follow this again, and if so, do see the price going up until August 2022? Congrats to all of you holders!
Disclaimer
Any content and materials included in Sahmeto's website and official communication channels are a compilation of personal opinions and analyses and are not binding. They do not constitute any recommendation for buying, selling, entering or exiting the stock market and cryptocurrency market. Also, all news and analyses included in the website and channels are merely republished information from official and unofficial domestic and foreign sources, and it is obvious that users of the said content are responsible for following up and ensuring the authenticity and accuracy of the materials. Therefore, while disclaiming responsibility, it is declared that the responsibility for any decision-making, action, and potential profit and loss in the capital market and cryptocurrency market lies with the trader.