
Madrid
@t_Madrid

What symbols does the trader recommend buying?
Purchase History
پیام های تریدر
Filter
Madrid
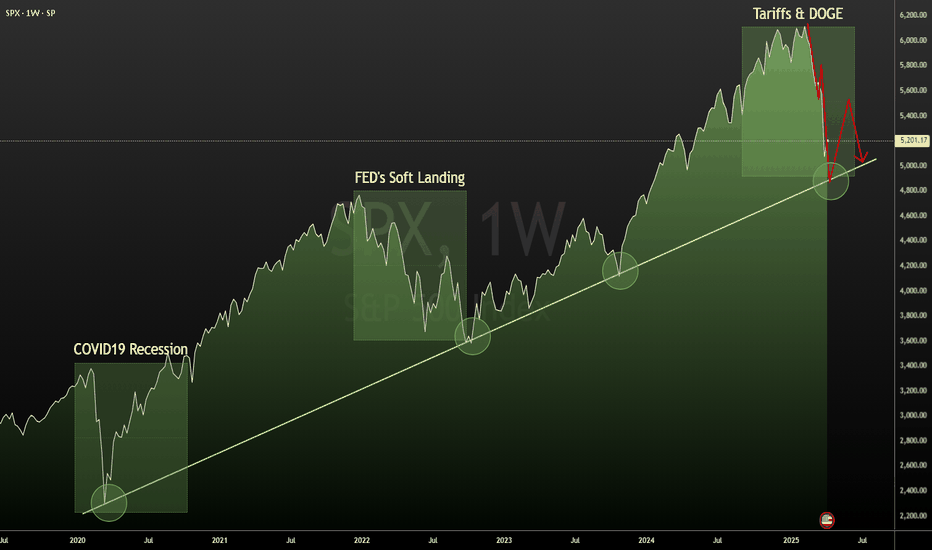
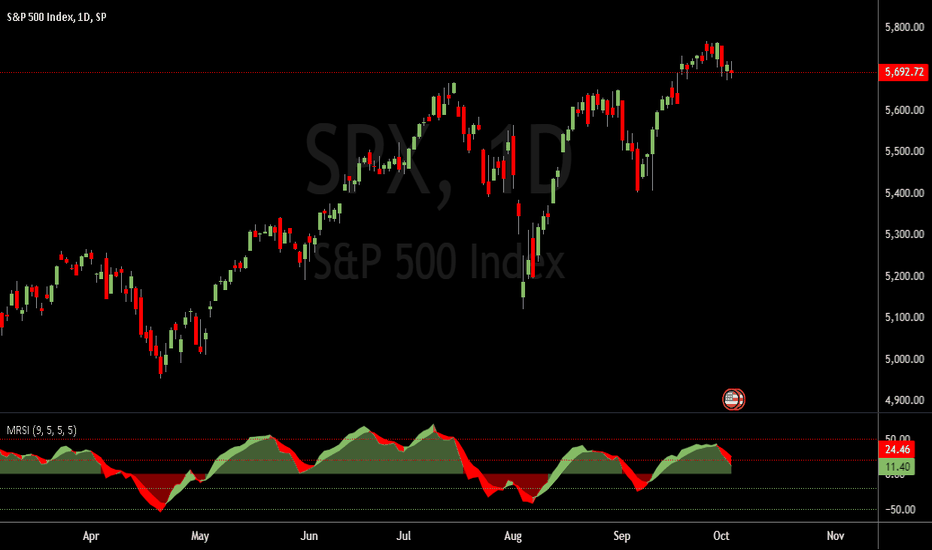
The Relief Rally is at Resistance
The SPX touched the main support line, it bounced after the "Buy the Dip" setup until it reached the S/R level at 5,600. This level is at the end of the relief rally, and we can say we're "back to normal". However, this is a critical point where this support was broken in the past and since support turns into resistance when broken, the most probably price action is a retracement back to the main support line, where depending how the market interprets the Fed Decision it may create a bounce and we can expect it to be consolidating in a trading range. The main S/R trading range becomes [5100 - 5600], and if the market gains enough momentum, it could jump to the upper trading range [5600 - 6100]. It is not likely that the Fed will lower interest rates, since the effects of Tariffs is yet to be known. Inflation has been kept in check since the "soft landing", currently at 2.40%. Lowering interest rates now without knowing the collateral damage of tariffs would be a wild bet.
Madrid
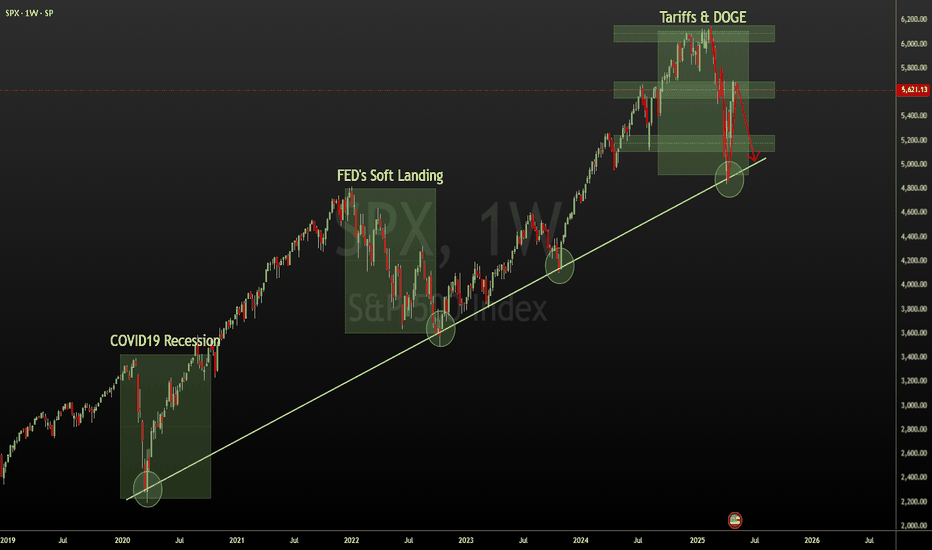
Buy Low Sell High (Buy The Fine Dip)
When the market becomes "Cheap" it's time to buy. And when the market is in decline "Sell High, Buy Low". At this time we saw a lot of Institutional activity, they were positioning at the top, when the index was struggling to make new All Time Highs, which according to the Wyckoff theory, it signals a reversal. It happened way harder than anticipated. There was a tiny Dead Cat Bounce not long ago, followed by a flush in the market. We reached the main trend line that was supported during the "COVID19 recession", the "FED's Soft Landing" and now the moment of truth, the "Tariffs & DOGE" period. If we compare the three critical moments in the market, we realize they all are the same size, 1,200 points. Let's go from there and assume the flush was the same and the support line holds. We have the ingredients for a dead cat bounce, taking the index back to 5,500, which will be another moment of truth. Will the short covering and the "buy the dip" mentality will be able to hold the levels and at least make the market pause the decline and best case scenario, consolidate? This will be answered if the index keeps above the 4,900 - 5,000-ish levels. I don't see a change in the economic policies of this administration, which makes me think a decline will happen after this Dead Cat Bounce. In which case the markets may fall back to the 3,600 levels, which will be signaled if the main support line doesn't hold, then brace for impact. The interest rates are relatively high, the inflation is ticking up and the unemployment, after the layoffs and the DOGE purge is ticking up as well. I don't see a forced slow down in the interest rates since this would take us to a scenario of high inflation and low rates, similar to what happened during the late 70's during the "Stagflation" period where after the initial high inflation peak, lowering the interest rates only exacerbated the economy. In the Weeks ahead we'll see the "Back to Normal" and the fanfares of a "quick recovery" in the markets, so I go long in the short term and wait for direction in the range.
Madrid
A Pause in the Slaughter House
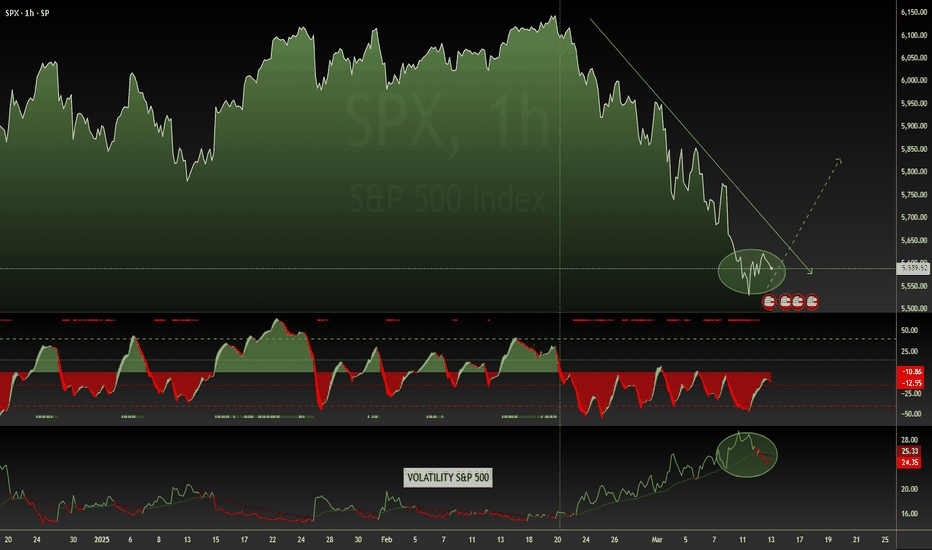
After the brutal decline we witnessed for the last few days, it looks like the SP500 has found a floor. The markets never move in a straight line. The VIX reached a level above 29, which signals high volatility and lower prices. The small pauses it took were just small bounces used by the market to keep selling. Yesterday we say a change in the trend of the VIX. In the Madrid Symbol Display indicator we see there was a meaningful change in the trend of the fear Index, It broke its trend at 27 to settle at 24. We're far from being out of the woods, specially considering that Trump is not backing off from his tariffs, and he disregarded the stock market as his performance gauge like he used to do during his first term, as well as the unemployment levels. His arguments are "it's going to cause a little disturbance", and "they're globalist companies that ripped off the US". Well those were not arguments he used during Trump v.1. Tesla plummeted, and we saw it coming when the insiders dumped stock. Elon hasn't dumped his stock, and he's the major shareholder of Tesla share, but we have seen the decline, and since this is one of the major index contributors, it has dragged down the market. We have seen declines also in crypto, chip manufacturers, etc. So it's not only Tesla, the debate of whether the boycott and/or the market environment have contributed to its decline is another story that has to be addressed separately. Bottom line, the market seems to get get ready for a "Dead Cat Bounce", and probably taking the index to the "Back to Normal" sentiment. Be aware that the momentum indicators are pointing down, and so far, this is not going to be a declared uptrend. The geopolitical environment and the tariffs are not gone, so the initial triggers are still active, and there's no reason to think this is going to change in the short term. We can say that a relief rally is in the making, and as long as the VIX is kept in check under the 24ish level we can take it as a truce to rebalance portfolios and hedge positions. SPX Target 5800.
Madrid
It doesn't look good.
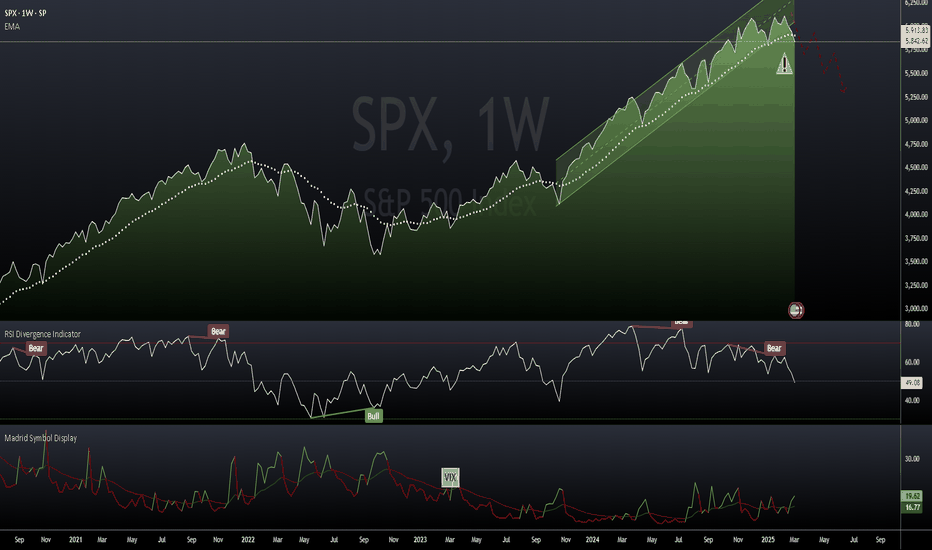
The indexes have shown a lot of wild swings recently, as the markets react to the economic policies from the federal government and the geopolitical outlook. Tariffs are a tax imposed to imported products and passed along to the end consumer, causing higher prices, so higher inflation. As the president said, it's going to cause "a little disturbance". The market is anticipating a longer pause in the reduction of interest rates, since higher inflation is not a good environment to be dovish. Higher inflation, pause on interest rates, unemployment rate at 4.0%, and yet to know how it moved in February after the layoffs, foreign countries retaliating with tariffs on products from USA, an unresolved peace agreement in Ukraine and Palestine are ingredients for a Bear Market. The RSI is already showing a bearish divergence that started in May-July last year. The RSI exited the Overbought area and it's crossing down the midline, which signals a bearish market. The SPX crossed down the 20ma in the Weekly and it made the cross of death (20 ma crossed under 50 ma) in the daily. Yesterday the index settled at 5842, under the 20 weekly ma, and it found support, so we may expect a couple of days with an uptrend rally in what is known as "Back to Normal". The VIX has been stubbornly above the 20 level. Yesterday it closed shy from this level. Unless we see a more relaxed VIX then this level signals we'll have volatility and lower lows in the weeks ahead. The market never moves in a straight line, on the way down previous resistance levels turn into support. If the divergence is confirmed by a lack of new all time highs (most likely), and if the market won't trade in the range, then brace for impact. If the economy enters into recession, which looks like it's being done on purpose, the Fed will be "forced" to reduce the interest rates. We'll see if the policies will be softened, or if the government is going in full force, and in that case, I hope it'll be a "controlled" crash landing.
Madrid
A Major Storm in the Horizon
Recently we saw new All Time Highs (ATH), the indexes have been on the rise. However there's something in the works. The so called "Fear Index" VIX has been stubbornly increasing its level and for a while it has breached the 20 level. Which is the borderline from a calmed ascending market and a correction. The level of the correction may go from just an adjustment in the trend, sending the index back to the long term moving averages, like the 50/100. This is not yet a bear market, which can't be forecasted from just the levels we have at this time. The FED was aggressive with its first interest rate cut, the market is looking forward for margin at a discount and it knows how to ask for it. We'll have to keep an eye in the Fed balance sheet, the bond yield, inflation and unemployment. The momentum divergences in the upper time frame have been increasing. Higher levels with lower momentum, this is a sign of reversal. So far it's about time for a trend correction, a bear market will be seen if the main moving averages (20, 50) in the Weekly are breached and its support turns into resistance. Good Trading Everyone !
Madrid
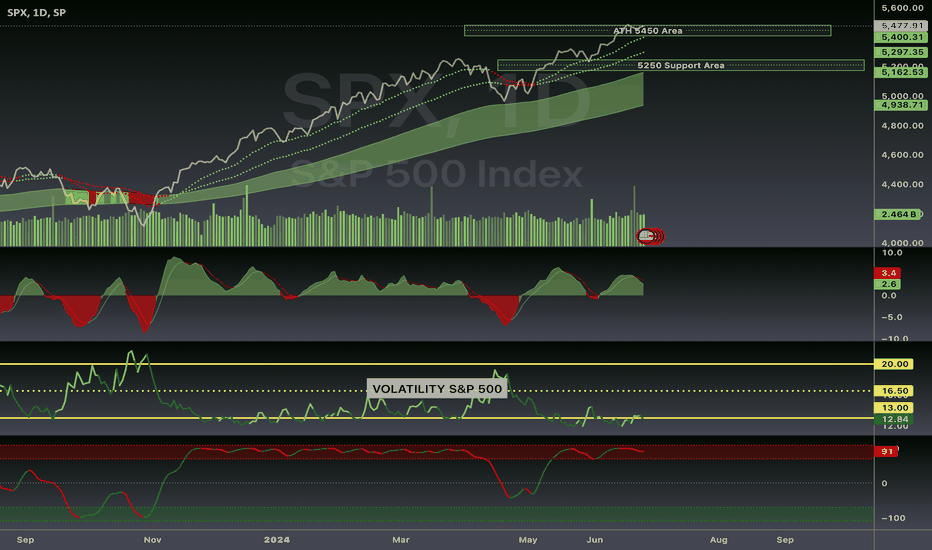
All Time Highs pierced
After the announcement of the FED to reduce interest rates, this attracted new money to the market, which made it easy to break the resistance at the All Time Highs (4670) level. What's next is the short term traders will be taking profits and the bears will be taking every dip to exit their short positions, creating pressure to the upside. My forecast is this will be battling until the price corrects and the 21MA catches up with the price level. At that point the uptrend will resume. We saw yesterday at 2:00 pm EDT that after the announcement of -0.5 in the interest rates the market skyrocketed creating a new intraday ATH, this was faded almost immediately, followed by wild swings to the upside, and downside, this conference was different from previous ones because of the battle between the high and the low of the session. Basically this was a "shaking the tree" scenario. The momentum is showing a Negative Divergence in both the Daily and Weekly timeframes (higher levels, lower momentum), this forecasts a market reversal. We'll see a continuation of the uptrend, which will trigger a frenzy buy spree, the market is going to enter in a highly greedy phase, and if you follow the market history, this is the point where the institutional market will get liquidity before the big drop. I don't forecast a strong reversal in the short term, but probably next year. The institutional market needs lower interest rates to go shopping at lower prices, that is the point where we'll see a very aggressive reversal caused by panic selling. Unemployment ticked up, Oil ticked up. This hints a market cool down. Still we're in full employment levels, nothing to worry about at this time. These are not recession levels, just slowing down, which are a good timing to start lowering interest rates. It may create a bit of inflation, but let's see how the balance of the FED interest rates equation behaves, inflation + employment + GDP. Higher index levels, lower momentum, lower inflation, employment in check, a 0.5 interest rate cut. Looks good, specially in an election year, which historically is a triggering element for volatility.
Madrid
Lower Lows / Lower Highs

Lower Lows / Lower Highs means a downtrend. I would think this was a corrective move, except that it has already violated the main 100/200 trend lines, forming what is known as the #KissOfDeath. Let's assume the best case scenario, where it finds support at 50K, it could be bouncing in the range from 50K to 60K until the market finds a catalyst. The worst case scenario would happen if the price goes to 50K, test support at that level and finds a new low, then pretty much is game over until it reaches the 40K level. I wouldn't open a long position here, I would wait until it has tested support and see if it holds. The momentum is in negative territory, basically reducing the first impact we saw recently. I would expect another leg to the downside before seeing some green in the momentum. "Trade and Trade Well."
Madrid
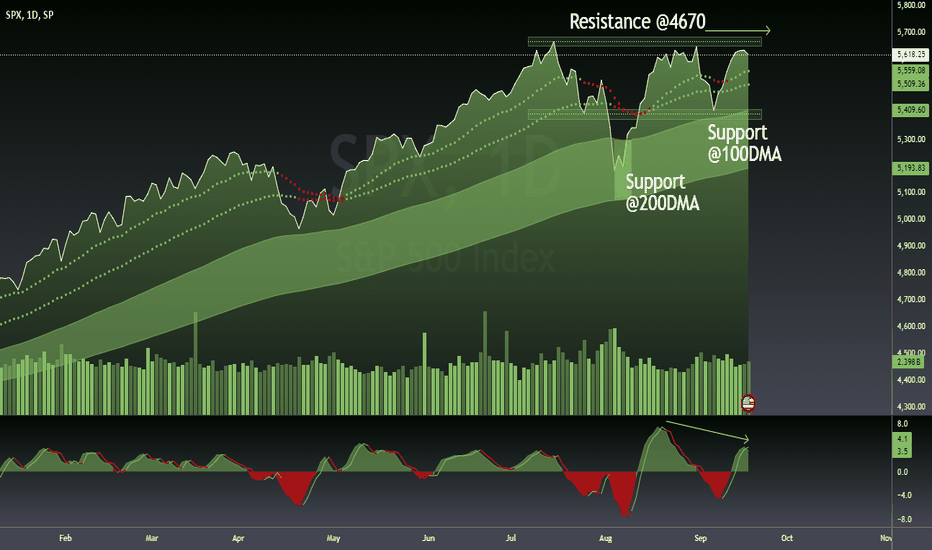
Look at the Forest, not the tree
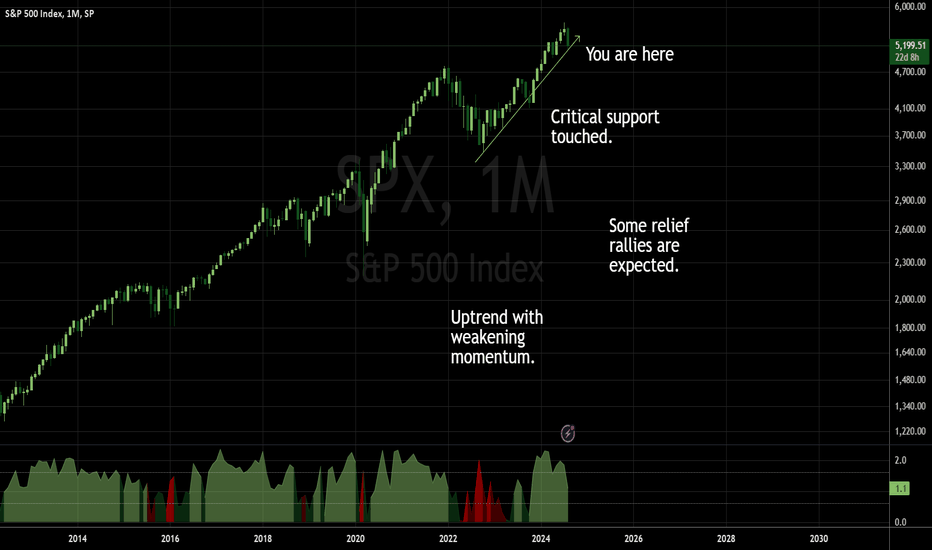
Bulls take the steps, Bears jump from the window. August has seen a very aggressive correction in the market. The question now is where are we now at. To know it, look at the forest, and don't get lost looking at a tree. The market has been in a series of Higher Highs / Higher Lows, the book definition of an Uptrend. The year 2022 witnessed a bear correction, it was closely equivalent to the one we saw at the start of the pandemic, the difference was that the Pandemic shutdown the economy and the correction was sharp and very aggressive, so the "V Shaped" recovery, after the humongous injection of capital it had (root of the inflation we witnessed afterwards). The one in 2022 was a slow motion bearish correction that touched the support trend and rebounded to keep on making All Time Highs #ATH. After the 2023 and half 2024 rally we're still on an uptrend, the main trend line is still intact, which is good news, as long as it holds a relief rally is expected. We have a weakening momentum, which means the direction of the trend is still up, but slower. Since we're at the "Higher for Longer" interest rate policy, the market will create liquidity to keep pushing higher and see if it can make another ATH, or if this will consolidate trading in the range. The markets move in tandem, and they follow the fractal principle of "the weakest moves first". Let's see which small markets move first and on which direction, this will give us a lead on where this market will be moving. I'm inclined to think about a range bound trading, until the support around 4700 is broken and it fails to go back to its previous highs. A bearish momentum and the break of the support will signal a Bearish market, until then the old saying #BTFD "Buy the Freaking Dip" applies. "The Trend is your Friend, until that nasty bend at the End."
Madrid
LL/LH. Resistance at 70K, support at 50K

Bitcoin reached its peak at 70K, and since then it broke the trend and it has been doing a series of Lower Lows / Lower Highs, the pattern is corrective rather than bearish. We still have a support at 50K, which is critical if this is meant to hold and at least trade in the range. If this support is broken, basically it's the end of the bull chapter until the next time. This chart depicts Bitcoin in the Weekly time frame, which is the big picture. The momentum has already entered a negative territory. and it is not good for the bull case. The rally we saw recently is in tandem with the rally in the SPX , a relief rally, also known as a "Dead Cat Bounce". Once this is exhausted it could resume its leg to the bear territory. I wouldn't open a bull position here, in this time frame, unless I see the support is confirmed and the momentum reverts to the bull side. The important levels to watch : 50K, 60K, 70K. Trade and Trade Well !
Madrid
Reversal Signal. Higher Highs and Lower Momentum.
It is hovering at the #ATH levels. Which is very bullish. Currently it’s entering into a negative momentum divergence, which means higher prices with lower momentum, it’s like a projectile which still goes up with a deceleration in progress. The stochastic point to Overbought levels. In a trending market it can remain in overbought and keep on going higher; however, the negative momentum is the signal that points to a possible end of this Bull leg. This is encompassed with a profit taking area and trend correction, in line with the end of the 2Q24.
Disclaimer
Any content and materials included in Sahmeto's website and official communication channels are a compilation of personal opinions and analyses and are not binding. They do not constitute any recommendation for buying, selling, entering or exiting the stock market and cryptocurrency market. Also, all news and analyses included in the website and channels are merely republished information from official and unofficial domestic and foreign sources, and it is obvious that users of the said content are responsible for following up and ensuring the authenticity and accuracy of the materials. Therefore, while disclaiming responsibility, it is declared that the responsibility for any decision-making, action, and potential profit and loss in the capital market and cryptocurrency market lies with the trader.