
Madmantrades
@t_Madmantrades

What symbols does the trader recommend buying?
Purchase History
پیام های تریدر
Filter
Madmantrades
50x leverage no brainer short trade (easy profits)
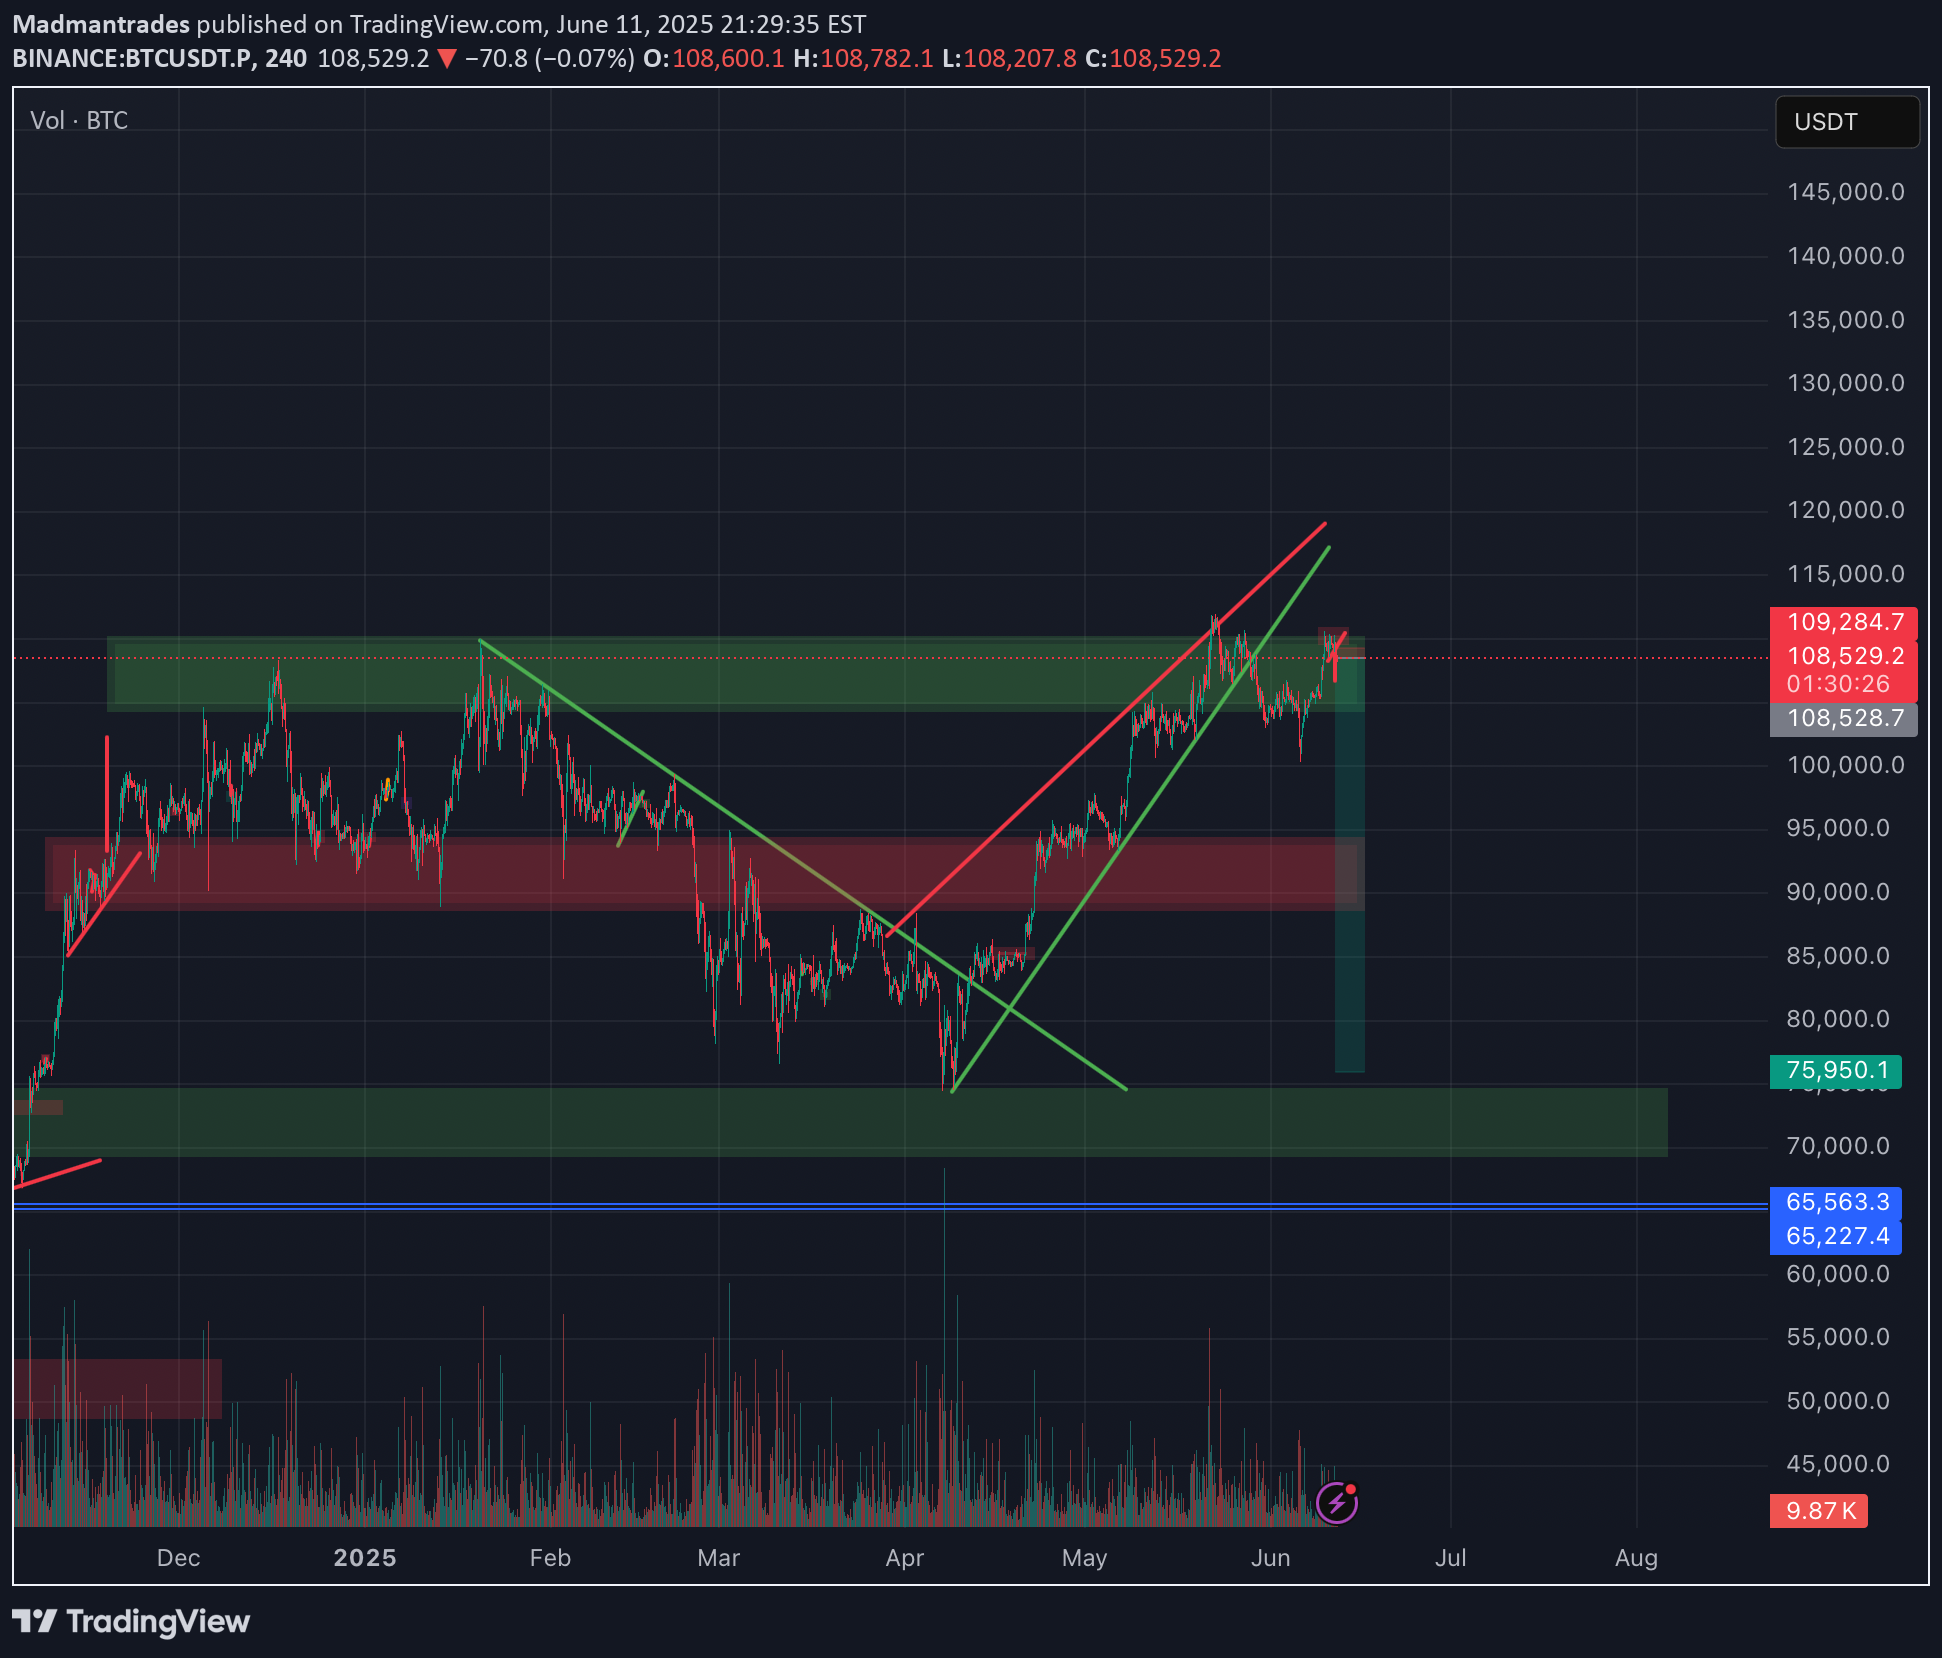
Keep in mind:With a big daily bearish engulfing candlestick we are most likely to continue the downtrend for the coming days. Looking at the RSI (daily timeframe) it is clear that we now are in a downtrend from previously being in overbought territory. We are most likely to go from overbought to oversold on the RSI and are now looking for a big downward movement! The MACD is showing weakness on the buy signal it has printed on the daily timeframe and is showing a strong sell signal on the 4 hourly timeframe. Most important information:Price action is the most important information you can get and trading on price action is what the pros do!What we can see is that the price of BTC now is inside a strong key resistance area. Combining this with the huge rising wedge we are most likely to fall back down to the 75k area. Keep in mind that we didn’t really get a good backtest of the 69k-75k support zone so we could be looking to make a good backtest of this zone before continuing the macro uptrend.I can also identify a failed bullish ascending triangle followed by a trend with lower highs. When the second lower high formed on the hourly I entered the 50x leverage trade at 108528,7 and placed the stop loss above that lower high. Keep in mind that the trend is your friend and that we most likely wont hit the SL. At least not before moving the SL into the profit zone (preferably above a lower high that will form). I have currently put my TP at 75950 (a long way down) because I want to ride this short as long as I possibly can. I also think that we are most likely to keep consolidating (until proven otherwise) between the given ranges (from 69k all the way up to 112k).What about the news?I think what president Trump does is the most important news we have to consider while trading. At the time of writing it is still unclear if the Musk VS Trump drama will continue. Bringing negativity into the market. The latest trade agreement with China was also not in favor of the United States (The relation between the two countries can strengthen but at a core financial view this ain’t good). Trump also kind of acted like a dictator in the Los Angeles event (this could bring negative energy into the markets). All in all I think that the news is a bit unstable and this strengthens the hypothesis that the price of BTC will consolidate until better times is around. Conclusion: I can always be wrong with either my complete analysis or parts of it. But I think that we at least is going to see a 1,65% move to the downside from my entry point. This move is extrapolated from the failed ascending triangle and seeing this move will give me the opportunity to make the trade risk free (I will keep you updated when this happens)!As the price drastically reversed and we didn’t see that lower high I wanted to see, I decided to take a +16,19% profit. It’s not a lot considering that I was up about 90% at max but remember that no one ever got poor by taking profits! Keep in mind that we actually hit the extrapolated price target for the failed ascending triangle and that we actually reversed at the very first support zone. I always had this scenario playing out in my mind but I didn’t think this actually would happen since it was weak support. I also thought that the downtrend would continue and also be steeper because that is what we historically has seen when BTC has gotten rejected from this macro resistance zone. A 7-12% steep downward move is the fractal that should have played out (this is why the downtrend ain’t over yet!)I am now looking forward to take another short position when I see that the price is topping out. At the time of writing I can see a potential crocodile tooth shaped bearish formation taking form. Indicating that that the price most likely will see a steep continuation of the downward trend and that the new “real” lower high has taken form. As I was writing we actually did see the 15min red candle close I wanted to see and I entered another 50x short position at 108005. I will still keep my TP way down just in case we get some crazy price movement. Considering that the volume has dropped a lot since April and is currently what I would call ridiculously low. An explosive move to either side is absolutely going to play out (my entire analysis as a whole prove that prices are most likely going to plummet). I could be wrong that this is the new “real” lower high but we have now seen the price cut into previous price action (the previous lower high) and gotten rejected. Now I need to see a break of the previous (micro trend) higher low at 107428 and I also need to see lower highs taking form. I still need to see this to confirm my hypothesis but the crocodile tooth formation does indeed indicate that this is most likely going to happen! I’m short in this bih. Let’s get this bread!
Madmantrades
What comes up must go down!

Looking at the bigger timeframes (4H) btc has been rejected on a major resistance level. This could potentially bring us back down ton the green support zone. But I am safing it and taking profits at the yellow downwardsloping line. Looking at the 15min it looks like we are making lower highs and soon to be lower lows. Looking at the 5min we get reminded of that we could still back test the resistance zone but we are currently most likely to break down since we are in a steep downtrend. Looking at the 1min timeframe I can see the higher lows at the micro trend but keep in mind that we are on the beginning of a downtrend on the bigger picture. I think the stop loss is perfectly executed above the previous lower high and I will now look forward to make the trade risk free! I think that btc easily could go down 4% based on price action.I am short @104349.6 with a 200x leverage. Let’s get this bread!Moment of truth! We still have to see the price break through those previous lows in order to see the price waterfall like I want to.We did break those lows and are now seeing the beginning stages of the waterfallI just made the trade risk free! (Moved the stop loss to the blue line)Keep in mind that we are most likely to not break the previous lower high and that we should very soon see a continuation of the downtrend.I just got stopped out making 112% profits. Now I’m looking to take another trade (probably a short position)I just went in with another short as I’m looking for the price to make another lower highMy stop loss is @103777,4$ 10 more minutes to flip that 15min candlestick red!Not gonna lie. 1 hourly candlestick is looking a bit scaryThat double rejection followed by the M-pattern will most likely make us continue the downtrend. Looks like I’m right on this trade as well :)Taking out this low will make us continue the waterfall. Stay alerted guys!We did also get a nice bodily close beneath the previous bodily low. This is making us most likely to go further down. Let’s goooo!I just turned the trade risk free! Giving me profits above 50% if I loseI’m out. Just made another 50% profits. Now looking for the next short to take!Just made another short. Looking to get sum moneeeeyLooks like I was wrong on that stop loss and just lost 40% on that trade. But no worries I am still up for the day! And it’s only the beginning of the morning here in Norway. I promise I will get in some good trades now. WATCH ME!Just went in with another short as we are looking to reverse on the micro resistance zone.I just made the trade risk free! Looking to take out those lows next. Worst case scenario is about 30% profits and best case scenario is about 728% profitsI moved the stop loss to be slightly above 100% ROI since we took out the lows and are currently continuing the downtrend.I am out of the trade with 95% profits
Madmantrades
Shorting the correction!

With the RSI being overbought on the daily and the MACD getting ready to flip bearish too, we are seeing the price of btc starting to correct. We just broke past the 95,5-96k support zone flipping it into a resistance zone. We broke through, backtested (doing it by the book!) and are now heading towards lower lows. Btc has been pumping lately but keep in mind that we never backtested the 69-74k support zone! What goes up must come down and it is now time for btc to at least make a decent correction for the Trump election rally. I think the moon boys will get rekt here. As I saw btc perfectly breaking and backtesting the 95,5-96k resistance zone I went in with a 200x short and at the time of writing I have about a 60% ROE. I will now look forward to make the trade risk free (when the time and technicals are correct).The first obstacle to overcome is the 91-93,5k support zone from the ascending triangle that previously formed. But since we never backtested the 69-74k support zone we could be looking to make a dive deep into the abyss here!We are now inside of the first obstacle! I will carefully hold my current short position while slicing through it. But we still need to make a break (and perhaps a backtest) of it before we can say for sure that we are dumping further down into the abyss.
Madmantrades
Pump it 200x

https://www.tradingview.com/x/yHqFW3vo/Btc recently had a nasty breakout from the given range. This made me think that we would drop hard and go deep into the abyss. But it turned out to be a fake out. Looking at the charts I can see that we have an ascending triangle within a bigger ascending triangle. The MACD and RSI is also looking bullish. I went in with 200x and at the time of writing. I have about 150% ROI and have made the trade risk free. Whatever the chart is doing I will at least make some money!Stop loss got hit and I made some money. I will continue using this strategy on the way up. I am trying to ride the wave!
Madmantrades
Dive deep into demand zone

I see signs that we are ready to retest the demand zone between 56600$ to 59600$. These signs include the breakout of the descending triangle and a breakout of the micro trend. We also have a huge M pattern in play even at the 4H. What I look for is to at least get a double rejection at 58244$ and is eyeballing 56,6k if we dive deeper. As I saw the bearish sentiment build up I went in with a 100x long at 60738$ and on this trade I made over 50% profit. I went in with another short at 60309$ as the bearishness was building up and we also got the creation of a bear flag. I think we are not that likely of retesting previous given resistance because of the bear flag combined with the story the candlesticks are telling. We got some big red and prominent candlesticks indicating that we might not retest support followed by a weak buying side with small candlesticks seeing new given resistance. I think we are most likely of continuing the bear trend sooner or later. I could be wrong but then I look forward to go in for another short after retesting resistance. I still think that BTC will dive into the abyss regardless.Comment: We see a rising wedge and signs of beeing inside of the resistance zone. I think we are most likely to dump!Comment: The smaller timeframes got rekt but I still believe that this is a retest of resistance. I might have been a little quick on the trigger but I feel pretty confident about this trade.Comment: Considering the ammount of bullishness I ended up with a 100x long. We still have to at least wait for the 15min close in order to tell if we are going to test resistance though.Comment: You see we have a rounding bottom combined with a break in of the micro trend channel. We might even be ready for 72k. Time will tell. I am looking forward to make this trade risk free.Comment: See the long idea for where we might be heading. We still need to break the micro trend to the upside before we can tell direction for sure.Comment: We are currently testing the support zone. I am holding my long position
Madmantrades
Back at the 100x long

Back at the 100x long It looks like btc is bouncing off key support at 56500-59500 usd. Key resistance is now at 72-74k. It has stayed in this trend from going in between these zones since late February (last 4 months). The RSI was also oversold at both 4H and daily. We are now looking for the MACD to flip bullish at higher timeframes 4H-1D (it is already bullish at 1H). When btc confirmed support (looking to at least get a bounce) and broke out of the downward sloping trend. I went in with a 100x long. The trade has been made risk free and I will move my stop loss into more profits (usually under the last bottom) as prices keep rising. Btc and the S&P500 index is also related and the S&P500 index is reversing and has some nasty gaps to fill. I predict that this index will get a correction of at least 7%. This is bullish for bitcoin! But let me tell more about the current trade. The worst possible scenario at the time of writing is that I get a 152% ROI and the best that can happen is that I make a 2000% ROI. This is a good position to be in if you ask me. I will make money regardless!Comment: Btc is currently testing the support of a small ascending triangle. This is most probable of breaking to the upside and continue the trend. I am holding my long position with calmness and ease.Comment: The ascending triangle is tested and confirmed. We are ready to reach higher on the short term!Comment: If you are wondering what we are experiencing right now. We are just testing support. The sellers are looking weak and we just got in a bullish reversing doji candle. The bulls are in control!Comment: Looks like we are going for the final test. I am not moving my stop loss.Comment: The stop loss is at the white line. About 187% ROI if that happens.Comment: Tested support once again. From a technical standpoint we also made another higher low. I moved the stop loss accordingly. We could potentially be inside this bigger ascending triangle. Keep in mind that the trendline only has two touching points, indicating that it is weak. Summed up we are still looking bullish!Comment: I am currently out of the trade with about 200% profit. Time to look for the next opportunity!
Madmantrades
A sad story for crypo is right around the corner
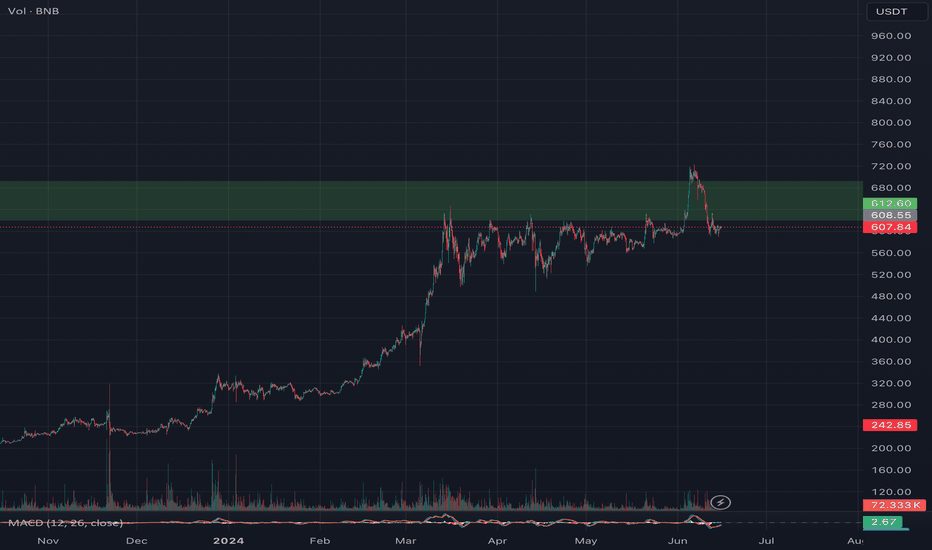
From my previous post where I started out having a bullish tunnel vision it actually ended up with me continuing to short bitcoin and make a really good ROI. Now that bitcoin has been gotten rejected from a strong resistance zone and has also created a big descending triangle I think BTC is ready to rip to the downside. It is currently backtesting the resistance zone from the descending triangle but when it is ready to continue the pattern I think we will go down fast. The next support zone will then be between roughly 57-59k USD. That would be a 10% drop and in my opinion it could be the beginning of the bear market already. According to pattern recognisation and fractals it is fully possible that we will see that 70-80-90% drop much earlier than previously thought. The RSI on weekly is extremely overbought and the MACD has also flipped bearish here. This is signs we should take to consideration when trading btc. Whatever happens with bitcoin I will try to make my own profits by shorting BNB since it both follows the same principles and it is known that most of the other coins follow the bitcoin price in some sort of way. The technicals are looking beautiful for shorting BNB as it looks right now. We are getting a rejection from a key resistance level on the weekly, the MACD has just flipped bearish and the RSI has been extremely overbought here too. I think it is very likely that we will move rapidly towards the 180-260 USD support zone. Some consolidation down at this level would also be good to look at. That is at least what happened last time we dropped down there. Whatever happens I will make sure to risk free my trades and move the stop loss downwards as the price moves down. As long as it is technically possible. I also think gold soon will lose a lot of its value but I will write that in another post. Have fun trading guys and thanks for sharing your opinions!
Madmantrades
BTC TO THE MOON OR WHAT IS GOING ON!?

Hey! Looking at bitcoins price action from march to June I think most people would predict a downtrend back to 60-61k. In my opinion we do have strong support in the 66k zone. Which we are now bouncing out of and upwards! Combined with an oversold RSI on the 4 hourly and a weak bearish Macd (that will soon flip bullish). I would assume and have already put money on a long position with entry at 67008 usd with a 100x leverage. I will make this trade risk free as soon as I can but have to wait for the right market conditions. My stop loss is currently at 66834,7 (about 100 usd to lose at the moment) and take profit is at 71747 usd (about 3000 usd in profit). On this trade I started with about 440 usdt and feel confident that I will at least make some money with my strategy. I would highly advise you to risk free the trades if you are not using this concept. Looking at the facts we did bottom out at the 66k area (support zone). You could also say that we got a double rejection here at the 4 hourly. On the smaller timeframes, let’s say 15min, we did form a smaller ascending triangle (bullish). It is also coming out from a strong support zone so these things combined could easily send us to 71-72k (these are major key levels at the macro trend). On top of that we do have a triple rejection inside the resistance of that smaller descending triangle. I would assume that I got in at the perfect time and that we are heading towards the previous tops once again in the next day or maybe two to three days. Leaving me with about a 1000% ROIComment: Here is a picture regarding how things could escalate Here is a picture of the price bouncing between tops and bottoms. Remember that trends will change sooner or later! Here is a picture of the bearish macd and the overbought RSI on 4h We also has some very revealing price action that I think everybody should (at least those who are short right now) should take into consideration. Look at the picture above ;)) Enjoy trading guys!Comment: Looks like I had been getting a bullish tunnel vision. But quickly realized it would continue down which coincides with the first plan I had. I took some profits and then tried to long without any big success. After that Inwent back to shortingComment:Comment: This might look extreme but we do have a gap at 20k on the BTC1! And according to the btc halvening chart I think we will get that 70-80-90% correction faster than any other time in the history yet. This is according to fractals and pattern recognitionComment: Whatever happens I will risk free my trade and make money anywaysComment: But if it turns out that we get a sudden drop to about 20k. Then I have turned my 100 usdt into 11000 usdt. This would be kind of cool
Madmantrades
PUMP IT!

Having a look on the daily timeframe we can see that we got a couple of small red candlesticks with long wicks. This is indicating that the trend is about to change (bullish). Remember that the bigger the timeframe you analyze the more significant it is.When looking at the 4 hourly timeframe we can see that we got a big red candlestick followed by a couple of small ones. This is indicating that the sellers are losing momentum and that the price is soon ready to rise in value.The latest 4 hourly candlestick we got is a green indesicive one. This is also a sign that the price is ready to shoot up.Another comfirmation is that we are bouncing up and away from a key support sone as of writing.Lets pump it!I am also sitting in a 10x long position looking to make about 40% profitsPrice broke the micro support and is now looking to get into the macro support and I am looking for a new entrySince the price moved under a key support zone I am now in a short position
Disclaimer
Any content and materials included in Sahmeto's website and official communication channels are a compilation of personal opinions and analyses and are not binding. They do not constitute any recommendation for buying, selling, entering or exiting the stock market and cryptocurrency market. Also, all news and analyses included in the website and channels are merely republished information from official and unofficial domestic and foreign sources, and it is obvious that users of the said content are responsible for following up and ensuring the authenticity and accuracy of the materials. Therefore, while disclaiming responsibility, it is declared that the responsibility for any decision-making, action, and potential profit and loss in the capital market and cryptocurrency market lies with the trader.