
MUNASAR5456
@t_MUNASAR5456

What symbols does the trader recommend buying?
Purchase History
پیام های تریدر
Filter
MUNASAR5456
MUNASAR5456
تحلیل بیت کوین: سطوح کلیدی و سناریوهای مهم هفته برای خریداران و فروشندگان
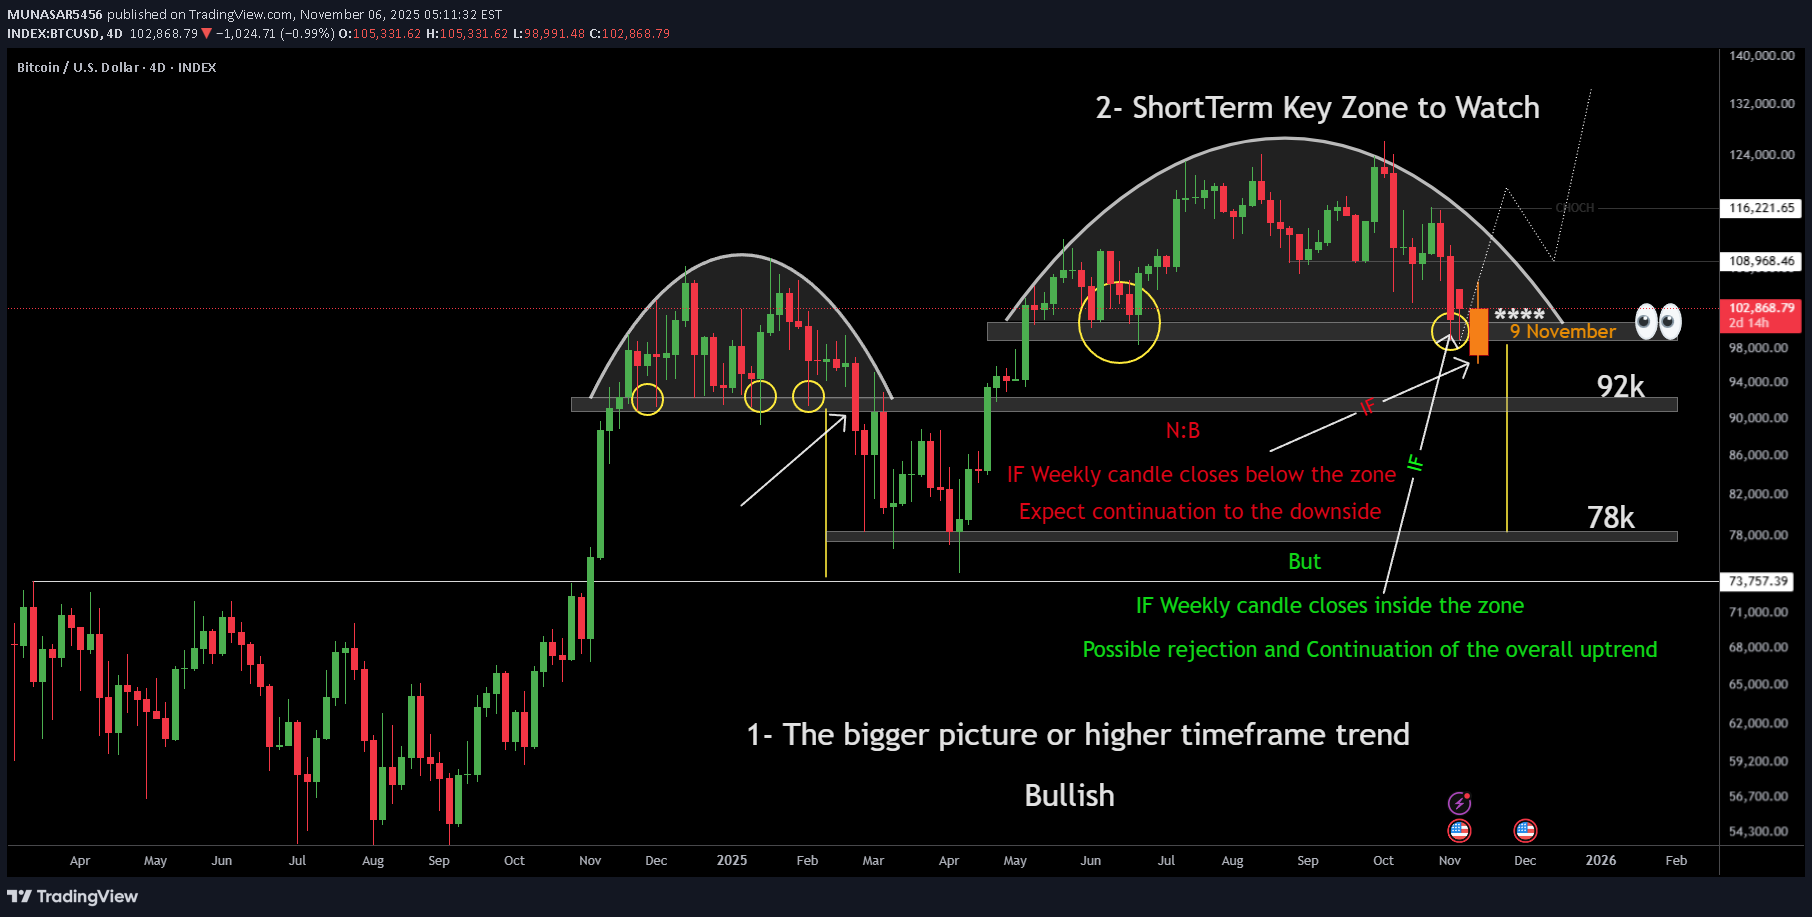
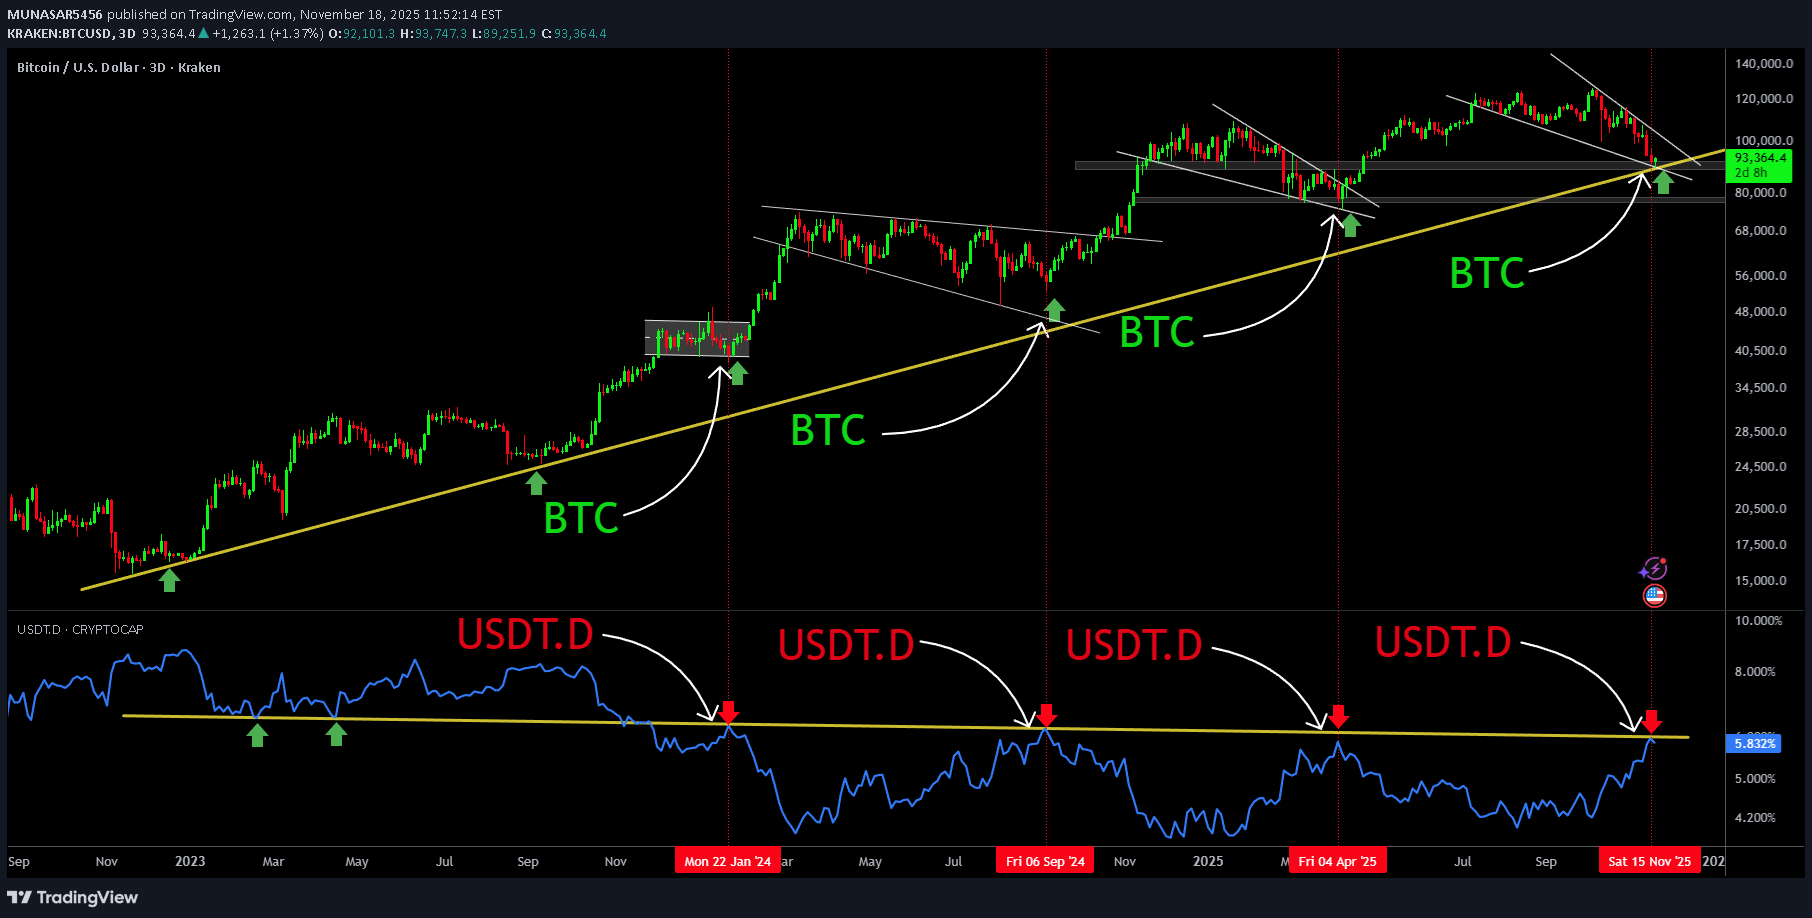
Bitcoin Analysis: - Higher Timeframe & Key Levels Overview 1. Higher Timeframe Trend (Bigger Picture) The overall macro trend remains bullish. Price has been making higher highs and higher lows on the weekly timeframe which indicates that the long-term uptrend structure is still intact. 2. Key Short-Term Decision Zone (98k-92k Area) The price has returned to a critical support/resistance flip zone around 92,000. This level has acted as support multiple times in the past and the market is now re-testing it. This is an important zone because the weekly candle close around this level will determine the next major move. 3. Key Scenarios to Watch Scenario A – Bearish Breakdown If the weekly candle closes below 98,000: This confirms a breakdown of support Selling pressure likely continues The next minor support to watch is around 92,000 Scenario A1 – Extended Bearish Continuation If the weekly candle closes below 92,000 This confirms a deeper breakdown of structure. Bearish momentum could accelerate further. The next major support zone lies around 78,000, representing a deeper correction within the larger uptrend. Scenario B – Bullish Defense If the weekly candle closes inside the zone (above 98,000): This suggests buyers are still defending the level the breakdown attempt fails, showing rejection from support the market could then continue the overall bullish trend to the upside.
MUNASAR5456
تحلیل بیت کوین: آیا سقف 98 هزار دلار شکسته میشود؟ سطوح کلیدی برای تصمیمگیری بزرگ

Bitcoin Analysis: - Higher Timeframe & Key Levels Overview 1. Higher Timeframe Trend (Bigger Picture) The overall macro trend remains bullish. Price has been making higher highs and higher lows on the weekly timeframe which indicates that the long-term uptrend structure is still intact. 2. Key Short-Term Decision Zone (98k-92k Area) The price has returned to a critical support/resistance flip zone around 92,000. This level has acted as support multiple times in the past and the market is now re-testing it. This is an important zone because the weekly candle close around this level will determine the next major move. 3. Key Scenarios to Watch Scenario A – Bearish Breakdown If the weekly candle closes below 98,000: This confirms a breakdown of support Selling pressure likely continues The next minor support to watch is around 92,000 Scenario A1 – Extended Bearish Continuation If the weekly candle closes below 92,000 This confirms a deeper breakdown of structure. Bearish momentum could accelerate further. The next major support zone lies around 78,000, representing a deeper correction within the larger uptrend. Scenario B – Bullish Defense If the weekly candle closes inside the zone (above 98,000): This suggests buyers are still defending the level the breakdown attempt fails, showing rejection from support the market could then continue the overall bullish trend to the upside.
MUNASAR5456
Bitcoin Technical Outlook
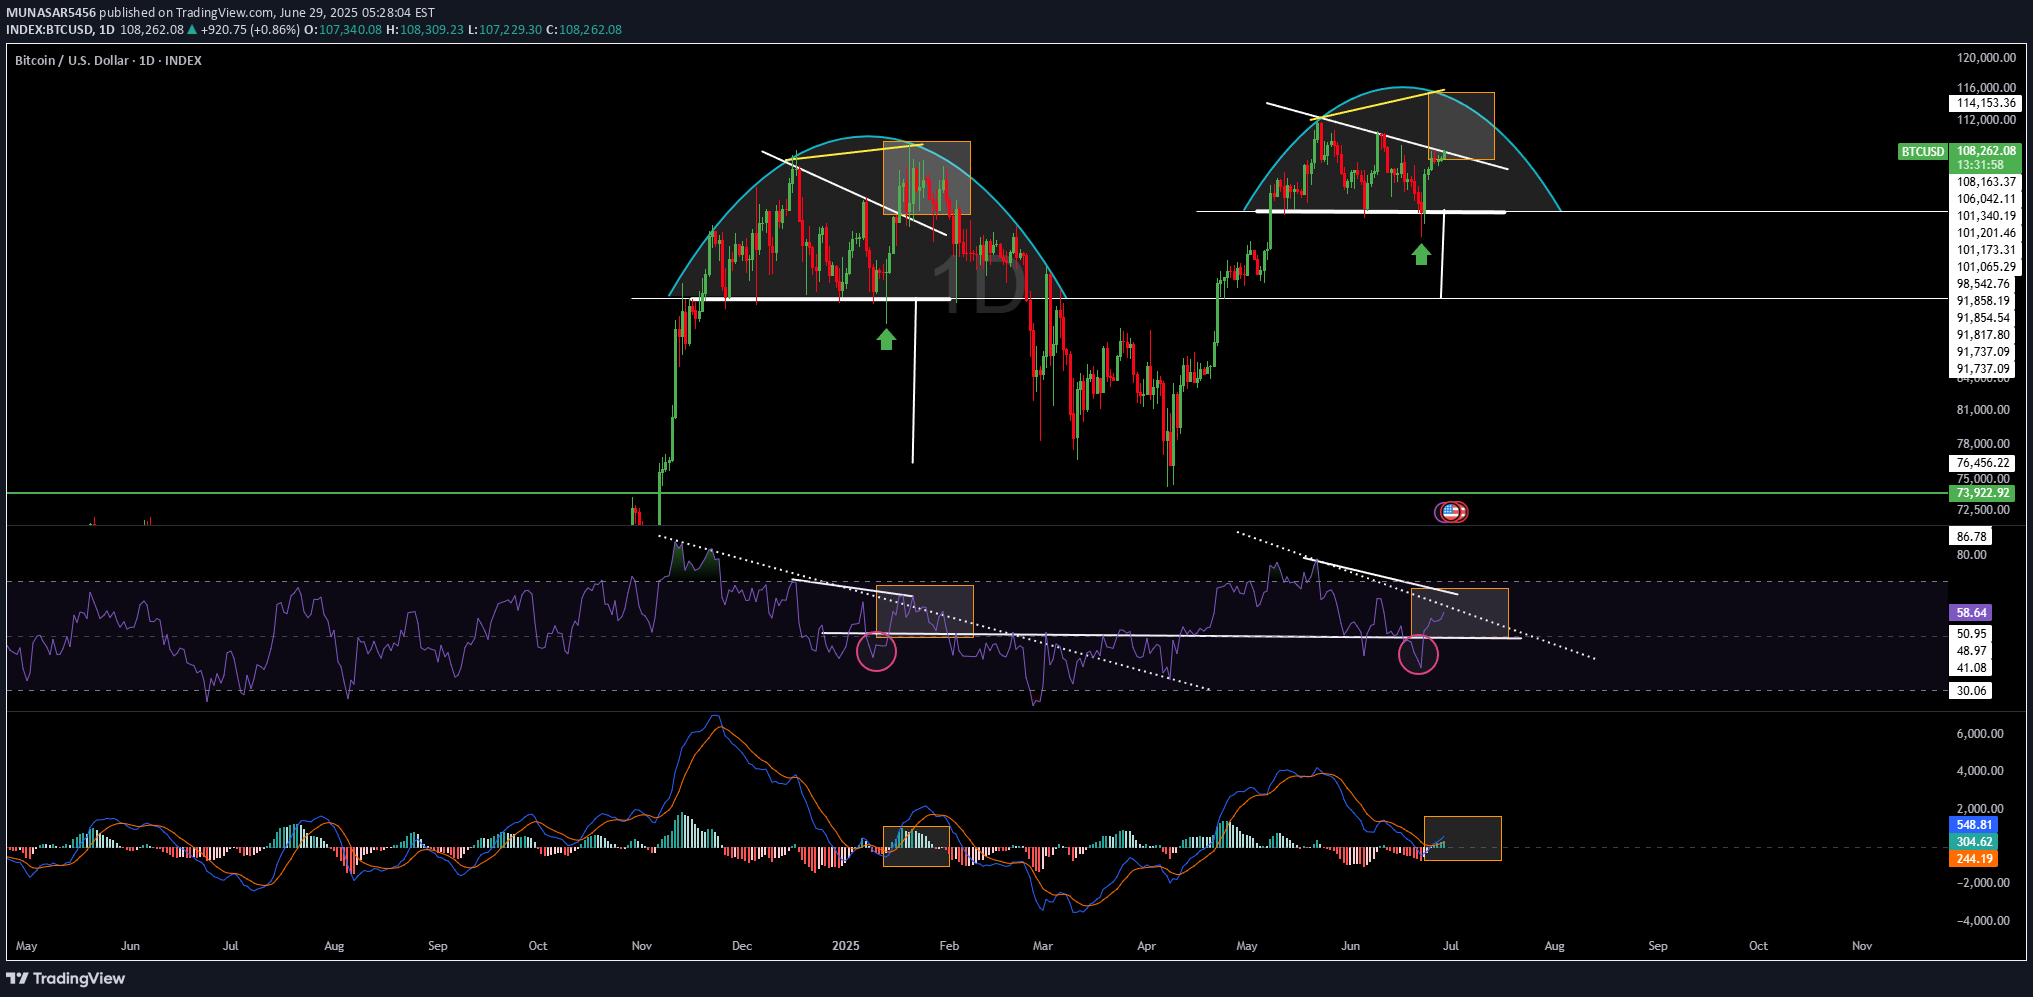
Date: June 29, 2025Timeframe: Daily (1D)🔹 Market Structure*Double Rounded Top formation visible, signaling potential exhaustion.*Clean horizontal support zones marked around $101,000 and $92,000.*Price reacting around neckline zone (~$106,000), forming potential lower high.🔹 Key LevelsResistance: $114,000 – $116,000Major Support Zone: $101,000 → $92,000🔹 Bullish ScenarioPrice holds above $106,000 neckline and reclaims trendline resistance.Clean breakout above $114,000 could resume bullish continuation to new highs.🔹 Bearish ScenarioBreakdown below $106,000 neckline could trigger momentum toward $101,000 and $92,000 zones.🔹 Bias SummaryNeutral-Bearish short-term bias.Bulls need to reclaim $114K to invalidate breakdown risk.Bears in control below neckline; watch $106K–$101K for reaction.
MUNASAR5456
BTC UPDATE

Market StructureBTC continues trading within a rising wedge pattern (white trendlines).Long-term yellow trendline acted as resistance (2018–2021), now flipped to support.Recent price action respects both the yellow and blue trendlines.Key resistance zone around $120K (red horizontal line).Mid-term projection targets upper wedge area near $180K.Bullish ScenarioContinuation of higher lows and higher highs suggests trend remains intact.Break above $121K could trigger a rally toward $150K–$180K (wedge resistance).Clean support holds above $103K and wedge lower boundary.Bearish ScenarioRejection from $121K and failure to hold blue trendline could lead to retest of $84K–$72K zone.Breakdown below $72K would invalidate the wedge and flip structure bearish.
Disclaimer
Any content and materials included in Sahmeto's website and official communication channels are a compilation of personal opinions and analyses and are not binding. They do not constitute any recommendation for buying, selling, entering or exiting the stock market and cryptocurrency market. Also, all news and analyses included in the website and channels are merely republished information from official and unofficial domestic and foreign sources, and it is obvious that users of the said content are responsible for following up and ensuring the authenticity and accuracy of the materials. Therefore, while disclaiming responsibility, it is declared that the responsibility for any decision-making, action, and potential profit and loss in the capital market and cryptocurrency market lies with the trader.