
MONEYMAXWELL
@t_MONEYMAXWELL

What symbols does the trader recommend buying?
Purchase History
پیام های تریدر
Filter
Signal Type
MONEYMAXWELL
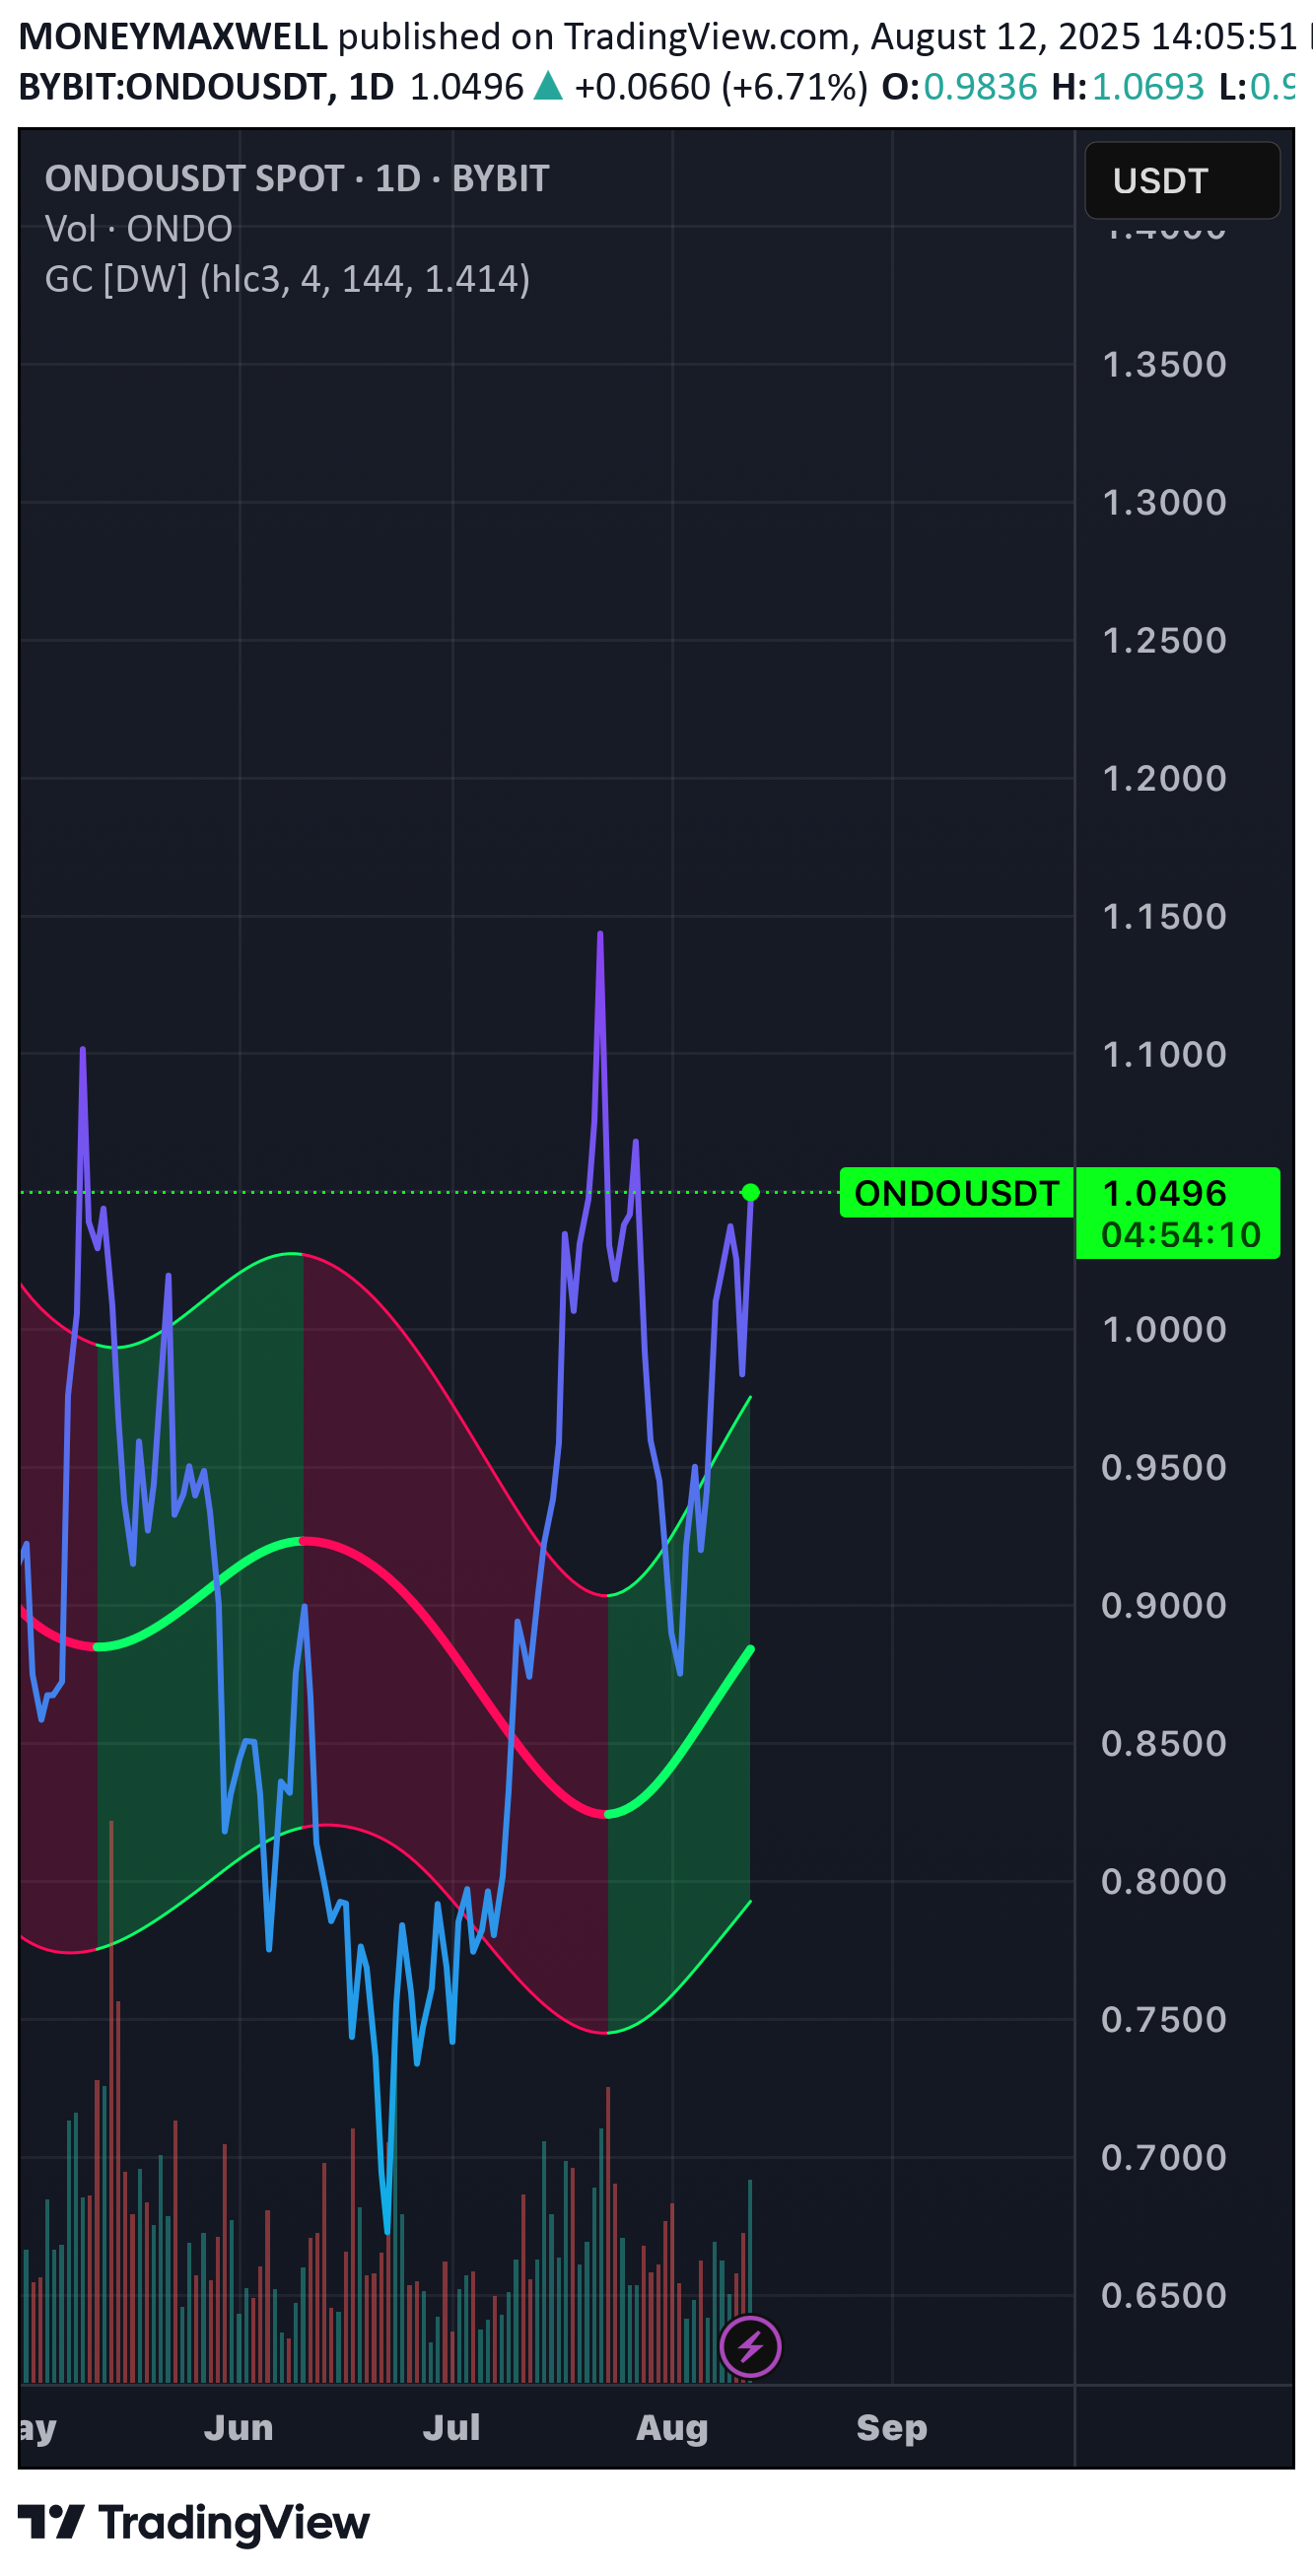
Today’s push reclaimed the recent range and is pressing into the prior supply zone just under $1.05–$1.07. •the bands (GC [DW] / Gaussian‑style channel) •Price is above the baseline and inside the green regime, which = short‑term bullish bias. •As long as candles keep closing above the midline, momentum favors upside tests. •“True” Fib map using the last impulsive leg (~$0.84 → ~$1.15) •Range = 0.31. •Key retrace supports: 38.2% = ~$1.032, 50% = ~$0.995, 61.8% = ~$0.958, 78.6% = ~$0.906. •Above $0.995 keeps price in “premium”; dips into $1.03–$1.00 are buy-the-dip territory if the uptrend holds. •Levels to watch •Immediate resistance: $1.05–$1.07 (then $1.10). •Major resistance / breakout: $1.15 (prior swing high). •Upside extensions if $1.15 breaks: 1.272 ≈ $1.234, 1.618 ≈ $1.342. •Supports: $1.03–$1.00, then $0.958, then $0.906. •Invalidation for bulls: Daily close back below $0.95 or a close back into the red channel. •Trade idea framing (not advice) •Bullish continuation: Hold above $1.03–$1.00 → retest $1.10 / $1.15; break and hold over $1.15 opens $1.23–$1.34. •Failure scenario: Lose $0.995 convincingly → likely revisit $0.958 or the channel midline.
MONEYMAXWELL

### **1. Chart Overview**- **Pair:** Bitcoin / U.S. Dollar (BTCUSD)- **Exchange:** Bitstamp- **Timeframe:** 1 Day (1D)- **Price:** Around **$91,635**- **Volume:** 2.4K- **Daily Change:** +4.72% (strong bullish move today)---### **2. Indicator: Gauss-R Ribbon**- This ribbon is a volatility-based indicator often used to detect trend changes.- **Green ribbon:** Bullish trend bias (price closing above average)- **Red ribbon:** Bearish trend bias (price closing below average)- **Your settings:** `close 49 0.55 7 21`#### Interpretation:- You can see **green zones** during major uptrends (October–December 2024).- **Red zones** appeared during the pullback from January–April 2025.- Now, BTC is **breaking out above the red ribbon**, possibly signaling a **trend reversal back to bullish**.---### **3. Price Action**- Price consolidated in a **range** for most of March–April 2025.- Now it has **broken above recent highs**, suggesting a **bullish breakout**.- If momentum holds, BTC could **retest the previous highs** around $100K.---### **4. Watchlist Notes (Right Panel)**You’re tracking macro, crypto, and volatility assets:#### **Top Movers:**- **MOVE index** (bond market volatility): +12.15% — signals bond volatility is back up.- **SUI/USD**: +11.6% — strong altcoin rally.- **ETH/USD**: +7.77% — Ethereum joining BTC in breakout mode.- **VIX**: -9.26% — equity volatility collapsing, risk-on mood.- **DXY (Dollar Index)**: +0.80% — slightly stronger USD, but not stopping BTC here.#### **Gold (GC1!)**: Down ~1% Suggests capital may be rotating from gold into crypto or risk assets today.---### **5. Macro Interpretation**This chart hints that:- BTC may be entering a **new swing leg higher** after a corrective phase.- **Risk-on sentiment is returning** (VIX and MOVE down, equities up, ETH/BTC up).- BTC is leading as **money rotates into crypto** despite a slightly stronger dollar.---### **6. Key Levels to Watch**- **Support:** ~87K (prior consolidation)- **Resistance:** ~$100K+ (local highs)- **Breakout confirmation:** Hold above $91.5K for 2–3 daily closes with volume.
Disclaimer
Any content and materials included in Sahmeto's website and official communication channels are a compilation of personal opinions and analyses and are not binding. They do not constitute any recommendation for buying, selling, entering or exiting the stock market and cryptocurrency market. Also, all news and analyses included in the website and channels are merely republished information from official and unofficial domestic and foreign sources, and it is obvious that users of the said content are responsible for following up and ensuring the authenticity and accuracy of the materials. Therefore, while disclaiming responsibility, it is declared that the responsibility for any decision-making, action, and potential profit and loss in the capital market and cryptocurrency market lies with the trader.