
MCOGlobal
@t_MCOGlobal

What symbols does the trader recommend buying?
Purchase History
پیام های تریدر
Filter
MCOGlobal
AAPL (Apple): Has a Large Correction Begun? More Downside Ahead?
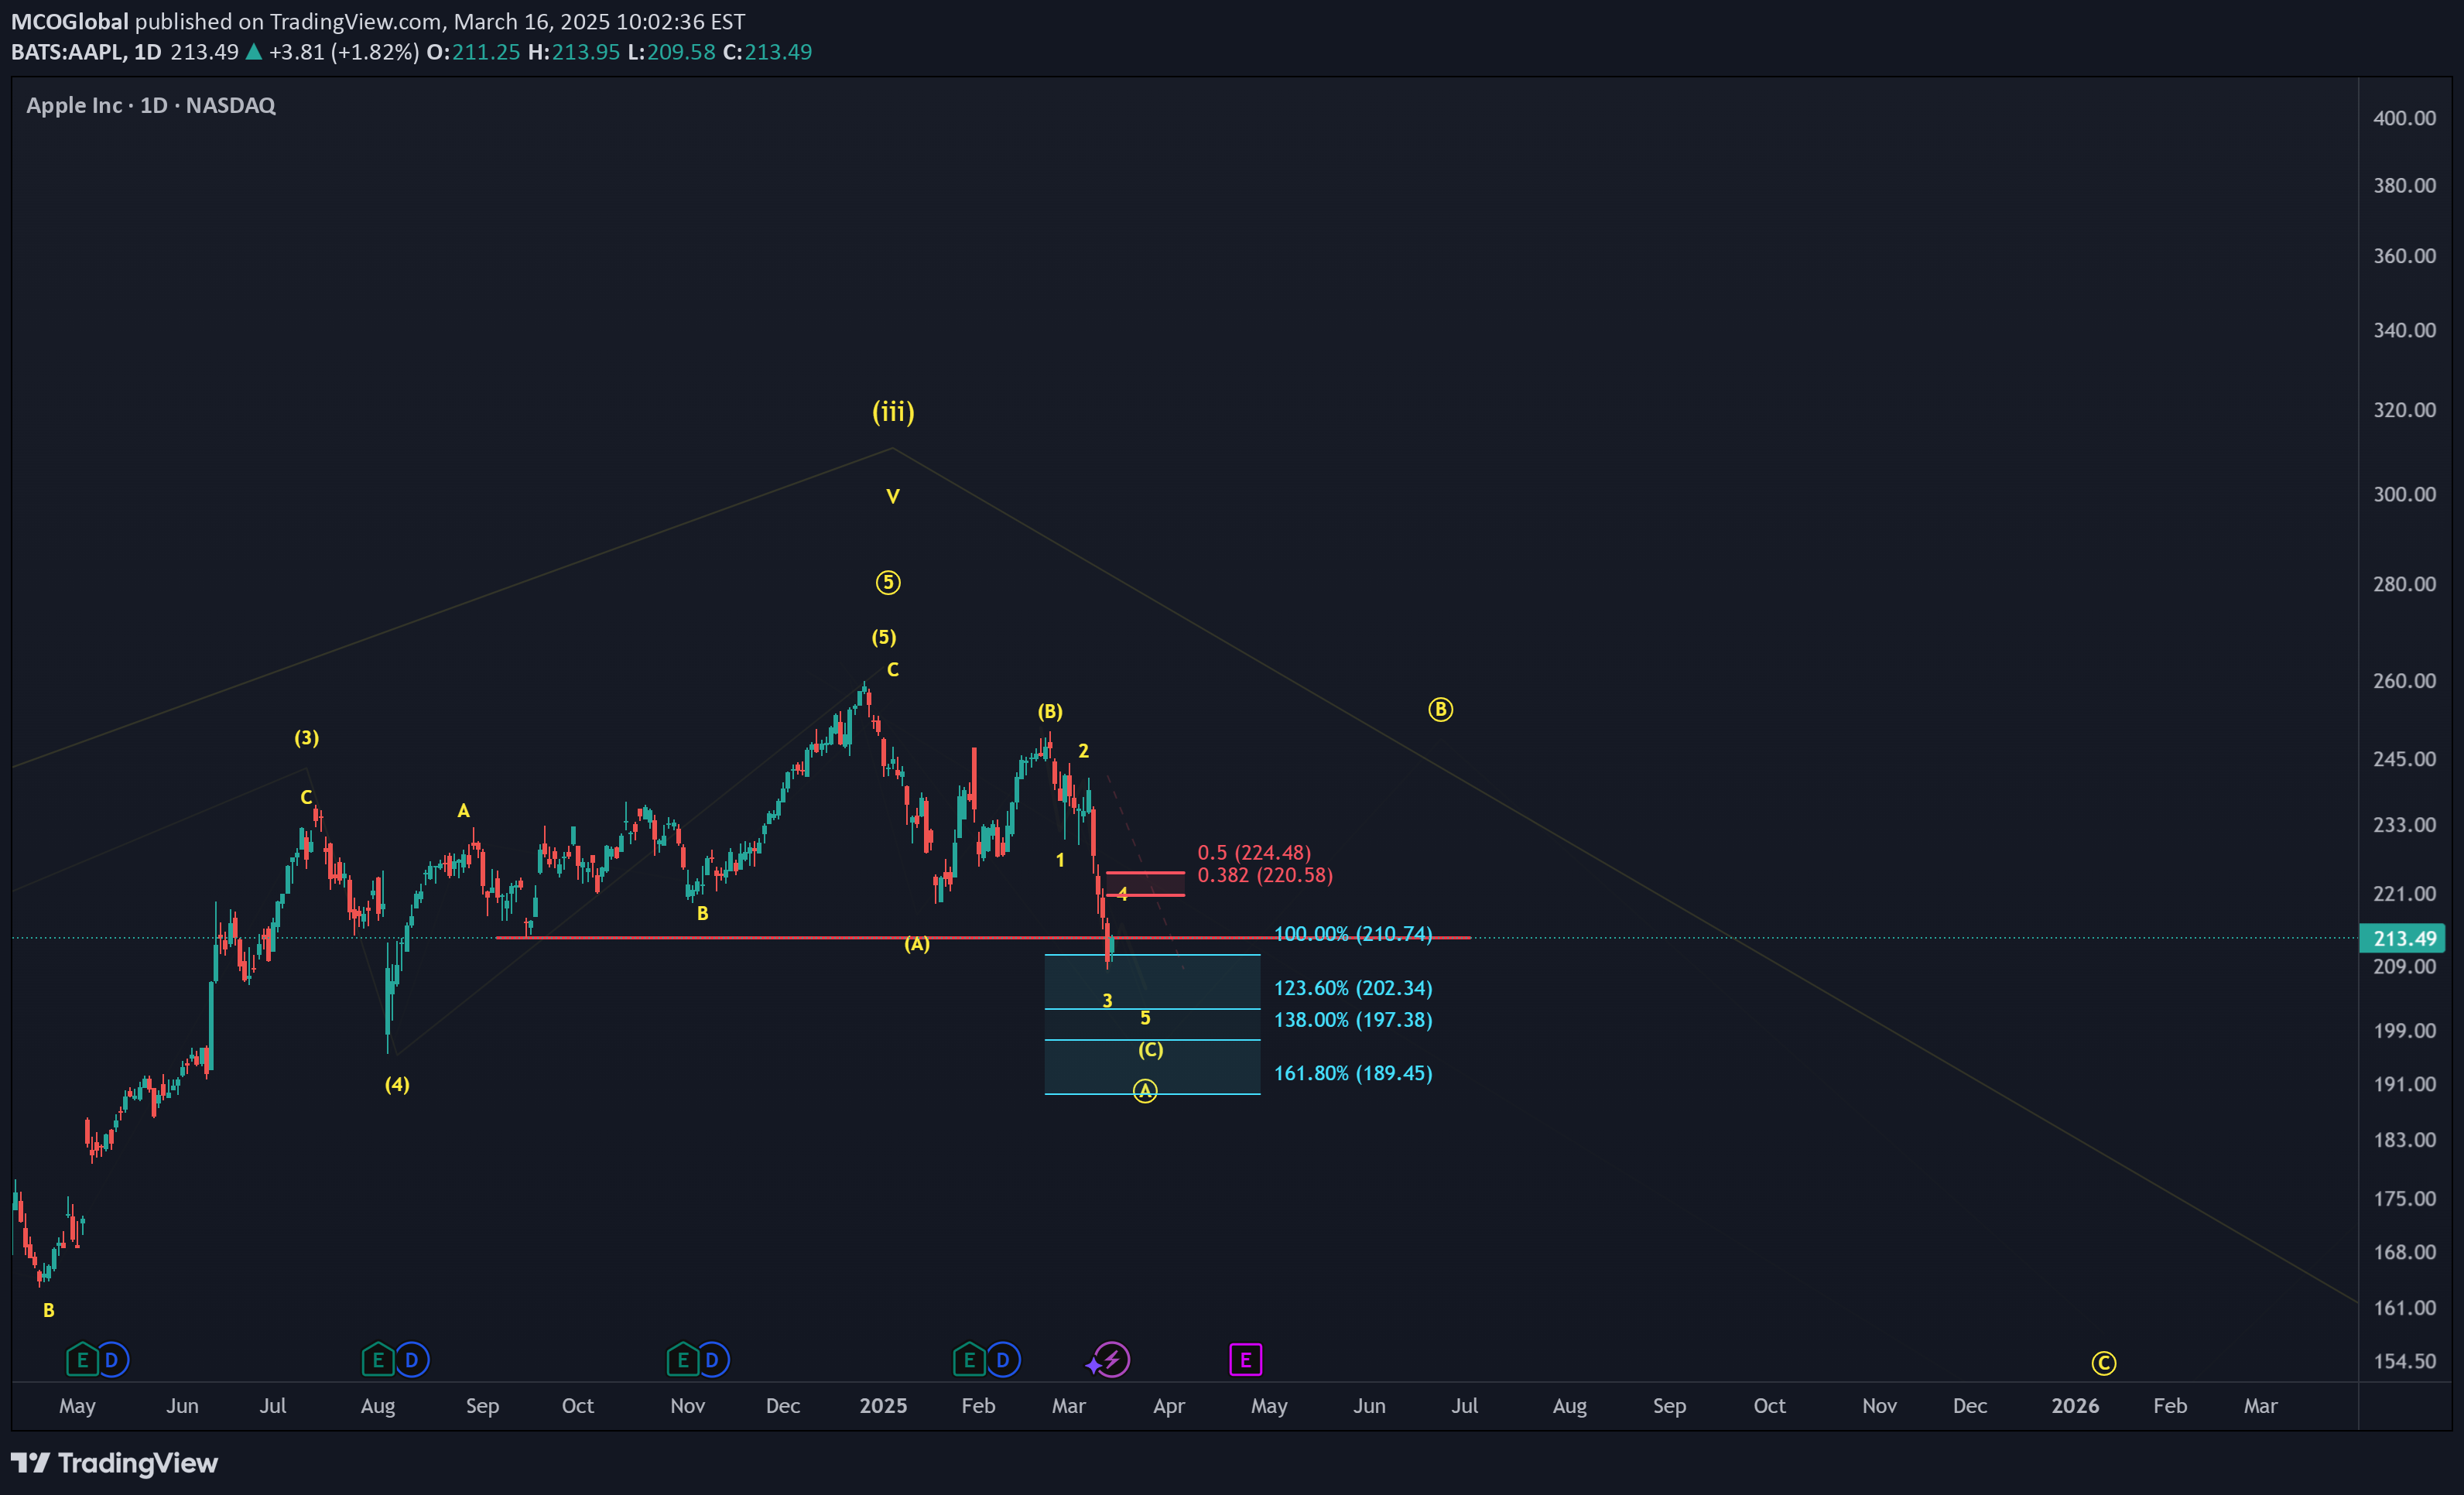
On this chart, we are currently tracking the potential beginning of a larger downtrend, which could be a larger-degree Wave 4 correction. It is possible that a larger-degree third wave topped in December 2024 at $260, and for now, I am assuming this is the case. While further confirmation is needed, the price has already broken below our first signal line, which supports the idea that a larger decline has begun—unless the next rally develops into a clear impulse structure. At the moment, the price appears to be in the late stages of Wave C of Circle Wave A to the downside. Immediate resistance sits between $220 and $224, and only a break above $224 would indicate that Circle Wave B to the upside may have already started. One important note: Circle Wave B could technically overshoot to the upside, meaning that if Circle Wave A completed as a three-wave pullback, we could even see a new high in the next bounce before the larger downtrend continues. This is something to keep an open mind about, as it is still early to confirm a substantial top on the long-term chart. For now, as long as resistance at $224 holds, the assumption remains that Circle Wave A needs one more low before a stronger bounce occurs.
MCOGlobal
Alphabet Stock (GOOGL): Bounce Incoming?
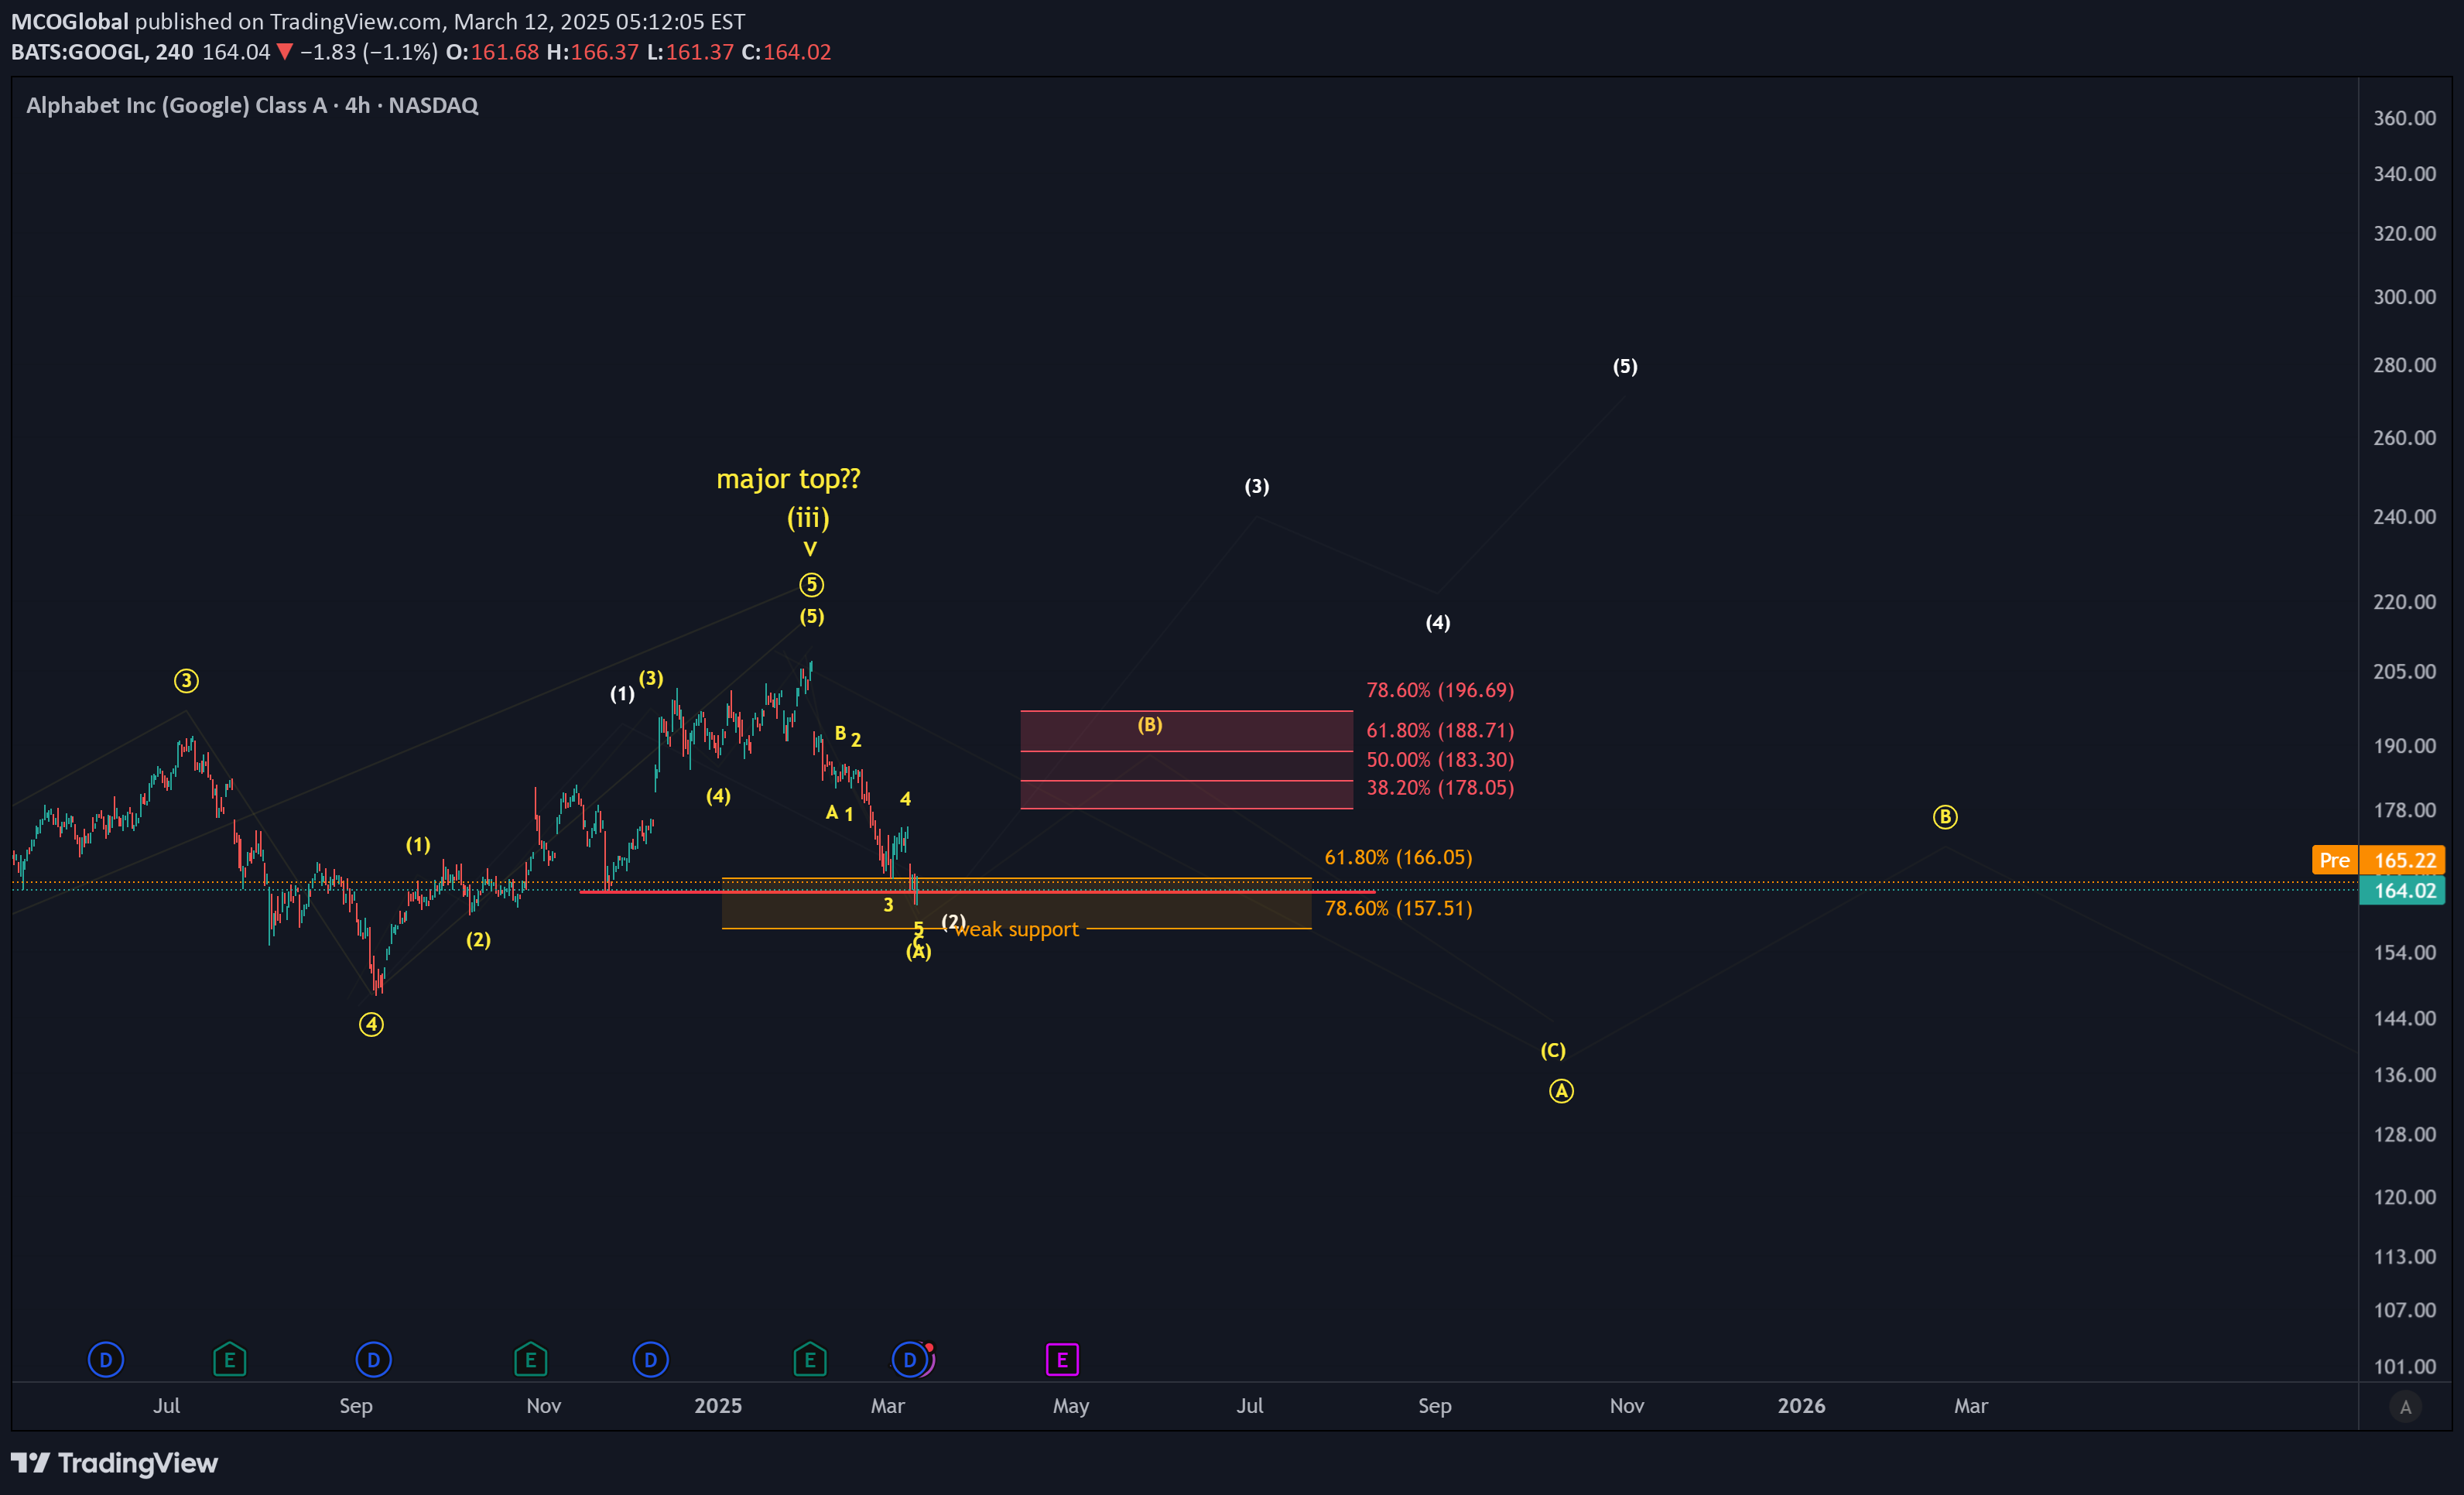
There is growing potential that a major price top has formed, particularly after the break below the November low, which has increased the probability of this scenario. The move down from the February high appears to be a three-wave structure, and I am watching for a bounce from the current region. However, this could simply be a B-wave in the yellow scenario, setting up for much lower prices. At this stage, it's too early to confirm a major top with certainty. The structure of the next rally will provide crucial insights. The current downward move is not yet a clear five-wave decline, leaving the door open for higher prices in the white scenario. However, even that becomes increasingly unlikely with a break below $157.50. For now, the working thesis is that a major top has formed, but confirmation of new highs would only come with a break above $196.69. In the short term, the price should ideally react to the current region, but we need to see a break above $173 (closing the last gap) to indicate a local low is in place. If that happens, we could be in a B-wave, which would likely target the $183 to $196 zone before the next major decision point.
MCOGlobal
SOL: Is the Bull Market Over? Solana Elliott Wave Analysis

SOL: The price is deep in the blue standard fibonacci extension support zone, which is located between $132.13 and $102.97. This zone is calculated based on the length of yellow wave A, and it provides standard support levels to watch for yellow wave C. Can I promise that it will hold? No, but if f this is indeed a C-wave to the downside then the bulls should show up in this region. From here I am watching two possible pathways: the yellow scenario allows for one more high with a target of around $360 to complete a larger 5-wave pattern, which started in 2022. However, in the white scenario, a 5-wave move to the upside can already be considered complete. We will therefore have to pay close attention to the structure of the next move to the upside and how the price reacts to the $181 - $263 fibonacci zone. This will help us distinguish between the two scenarios. However, even in case the white scenario plays out, a B-wave should take the price to the resistance zone. That being said, no local low is confirmed yet.
MCOGlobal
ETH: Can Ethereum Rally Once More in this Cycle?

ETH: The white scenario still permits a move to all-time highs, but a drop below $1,790 would make another all-time high in this cycle less likely, as the pullback would be too deep for wave (4). In that case, I will monitor the lower support region between $1,436 and $1,254 for a potential reaction, should the yellow scenario materialize. However, this remains a low-probability outcome, and I would expect the blue scenario to unfold if the price decisively breaks below $1,790.For now, the local trend remains to the downside, and we need to see a clear reaction at support before considering the start of the next upward move. We remain vigilant for any signs of a shift in momentum that could indicate the beginning of a reversal.
MCOGlobal
EGLD: Is There a Chance for Another Rally? Elliott Wave Analysis

EGLD / MultiversX: We saw a five-wave decline into the support area back in September 2023. Since then, the price has struggled to rally impulsively and has largely failed to participate in the broader bullish market. While it's still holding long-term support at $13.35, which is a positive sign, the short-term structure doesn't provide much confidence for an imminent upside reversal.A recovery bounce is due, but for any meaningful rally to take shape, we need to see a break above $25.55. That would be the first indication that a low might be in. However, from there, we’d have to analyze the structure closely to determine whether it aligns with the yellow scenario or the more bearish orange scenario.At this stage, there are no clear patterns suggesting a move to all-time highs. The white scenario remains speculative and is not the preferred view, though it's still valid, which is why it remains on the chart. Between yellow and orange, I remain neutral for now. The short-term trend is still down, and until $25.55 is broken, there's no confirmation of a low being in place.
MCOGlobal
BTC at a Critical Crossroad: One More High to $130K?

BTC: The price remains in a larger correction that began in December. While I still view one more high in this cycle as ideal—potentially targeting $130,000—the minimum requirements for completing a larger 5-wave pattern from the November 2022 lows have already been met. Any additional high would be more of a bonus than a necessity.A break below $69,140 would provide further confirmation that a substantial top has formed, aligning with the red scenario. For now, $69,140 serves as the key bull/bear pivot, helping us distinguish between the possibility of one more high and the onset of a larger correction or even a potential bear market.Regardless, I am closely monitoring the current price region for signs of an upside reversal. Even if this only results in red wave B, it could still push the price into the $92,000–$104,100 range.
Disclaimer
Any content and materials included in Sahmeto's website and official communication channels are a compilation of personal opinions and analyses and are not binding. They do not constitute any recommendation for buying, selling, entering or exiting the stock market and cryptocurrency market. Also, all news and analyses included in the website and channels are merely republished information from official and unofficial domestic and foreign sources, and it is obvious that users of the said content are responsible for following up and ensuring the authenticity and accuracy of the materials. Therefore, while disclaiming responsibility, it is declared that the responsibility for any decision-making, action, and potential profit and loss in the capital market and cryptocurrency market lies with the trader.