
MB2020MB2020
@t_MB2020MB2020

What symbols does the trader recommend buying?
Purchase History
پیام های تریدر
Filter
MB2020MB2020
شکست خط روند نئو (NEO): آیا وقت ورود به معامله لانگ است؟
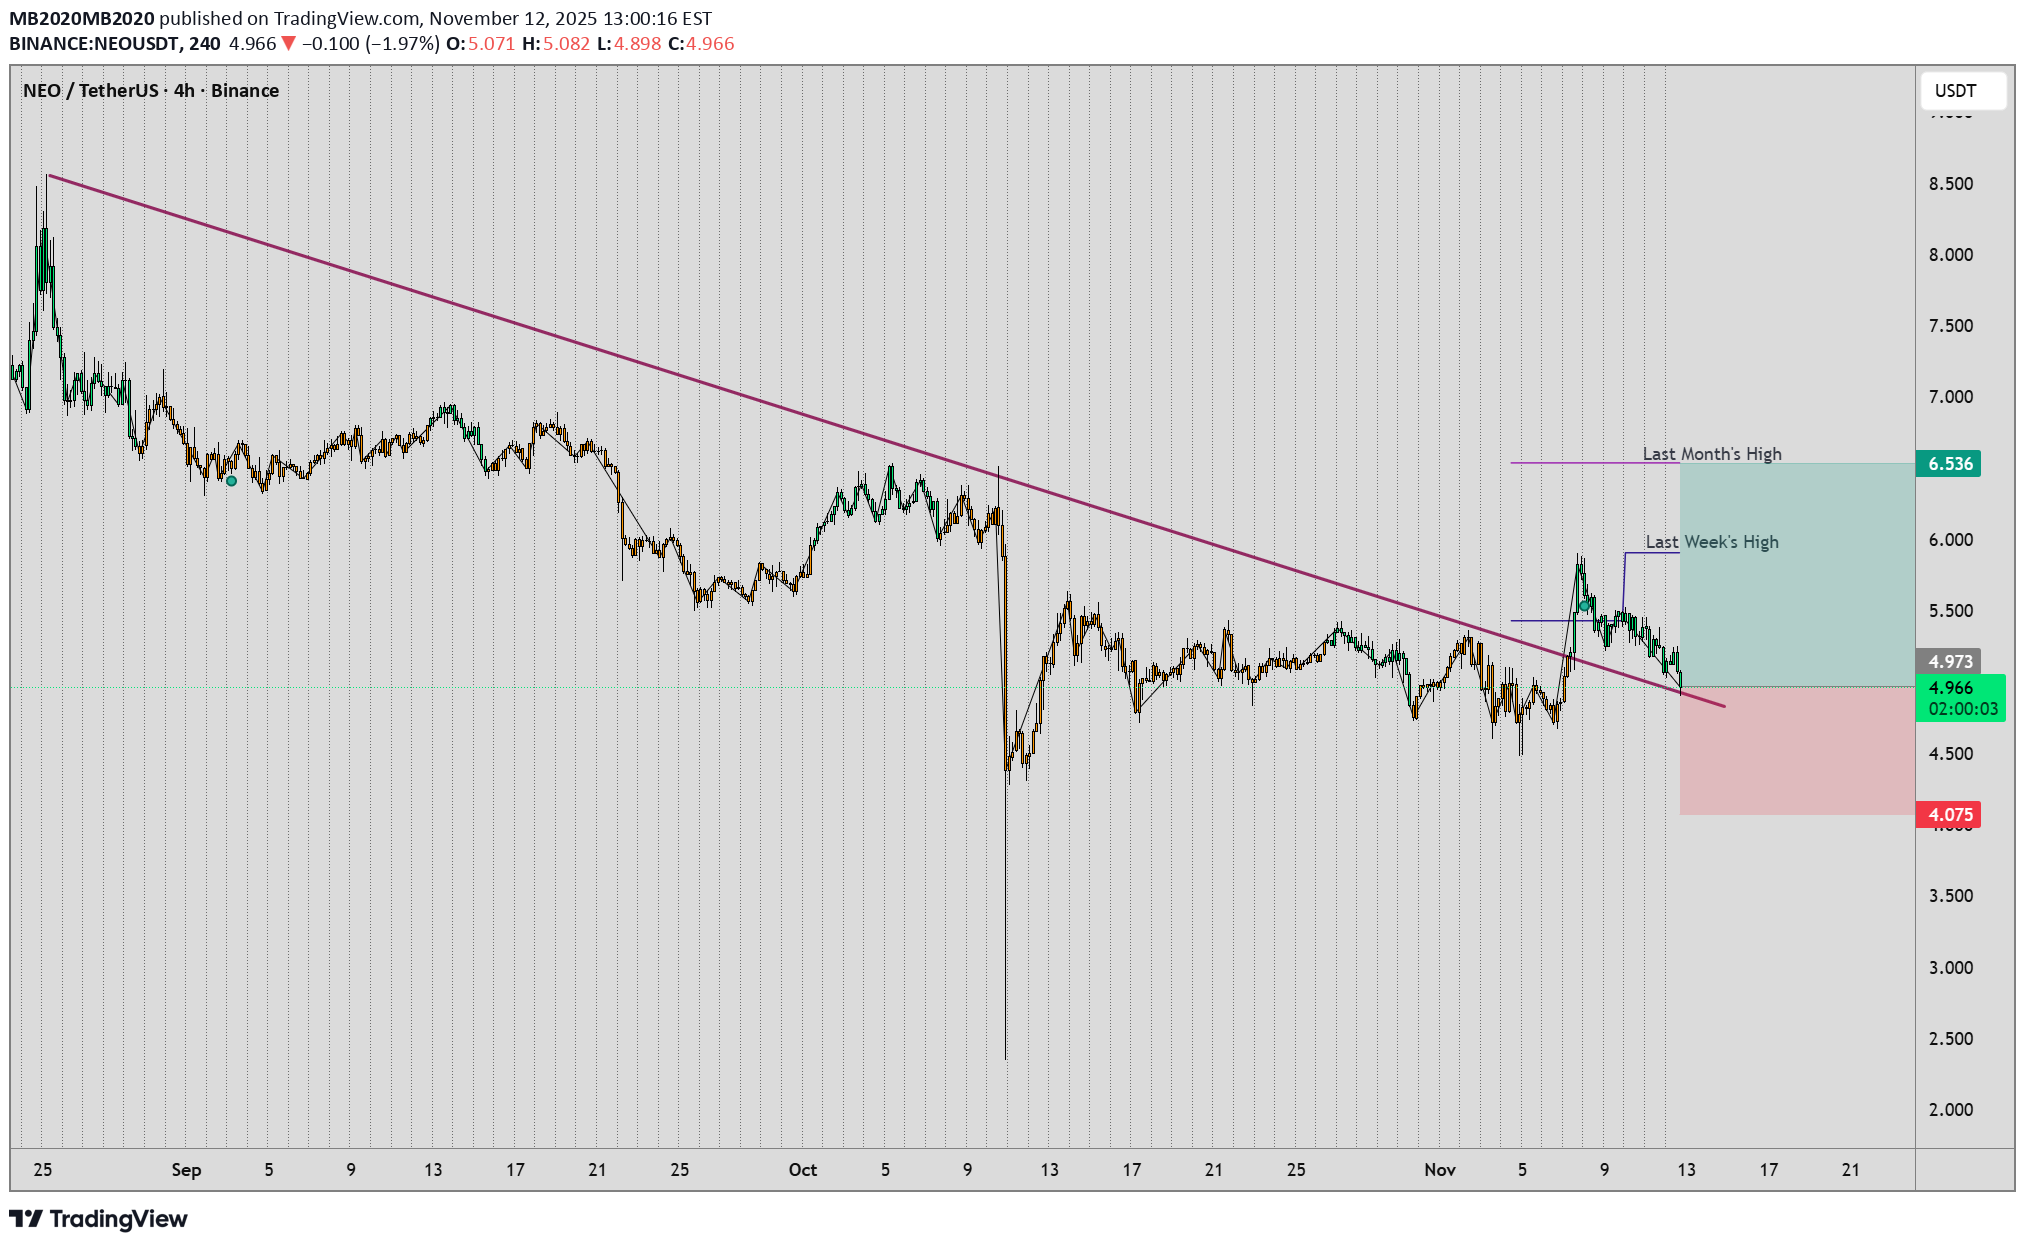
A trendline got broken, and the price has pulled back to it—keep an eye on it for a possible move up . Dear friends, I warmly invite you to like this post, leave a comment with your thoughts, and share it with your friends. Your support truly means the world to me! Your likes, comments, and shares are incredibly inspiring and encourage me to create and share more analysis with you all. Thank you so much for your kindness and encouragement! Warm regards, Max
MB2020MB2020
سقوط بیت کوین تا ۱۱۷ هزار دلار: آیا این سطح نجاتبخش است؟

The price has formed an "S" pattern and has once again declined to around $117,000. Therefore, the horizontal support level of $117,000, which the price has touched multiple times, is considered a significant level. The overall trend appears to be upward, with the price respecting an ascending channel (diagonal lines). The recent drop from the peak suggests a potential correction or profit-taking, with the price currently testing the support level. This indicates a volatile period that may lead to consolidation or a further decline if the support breaks, or a recovery if it holds.
MB2020MB2020
QTUM/USDT - H1- LONG
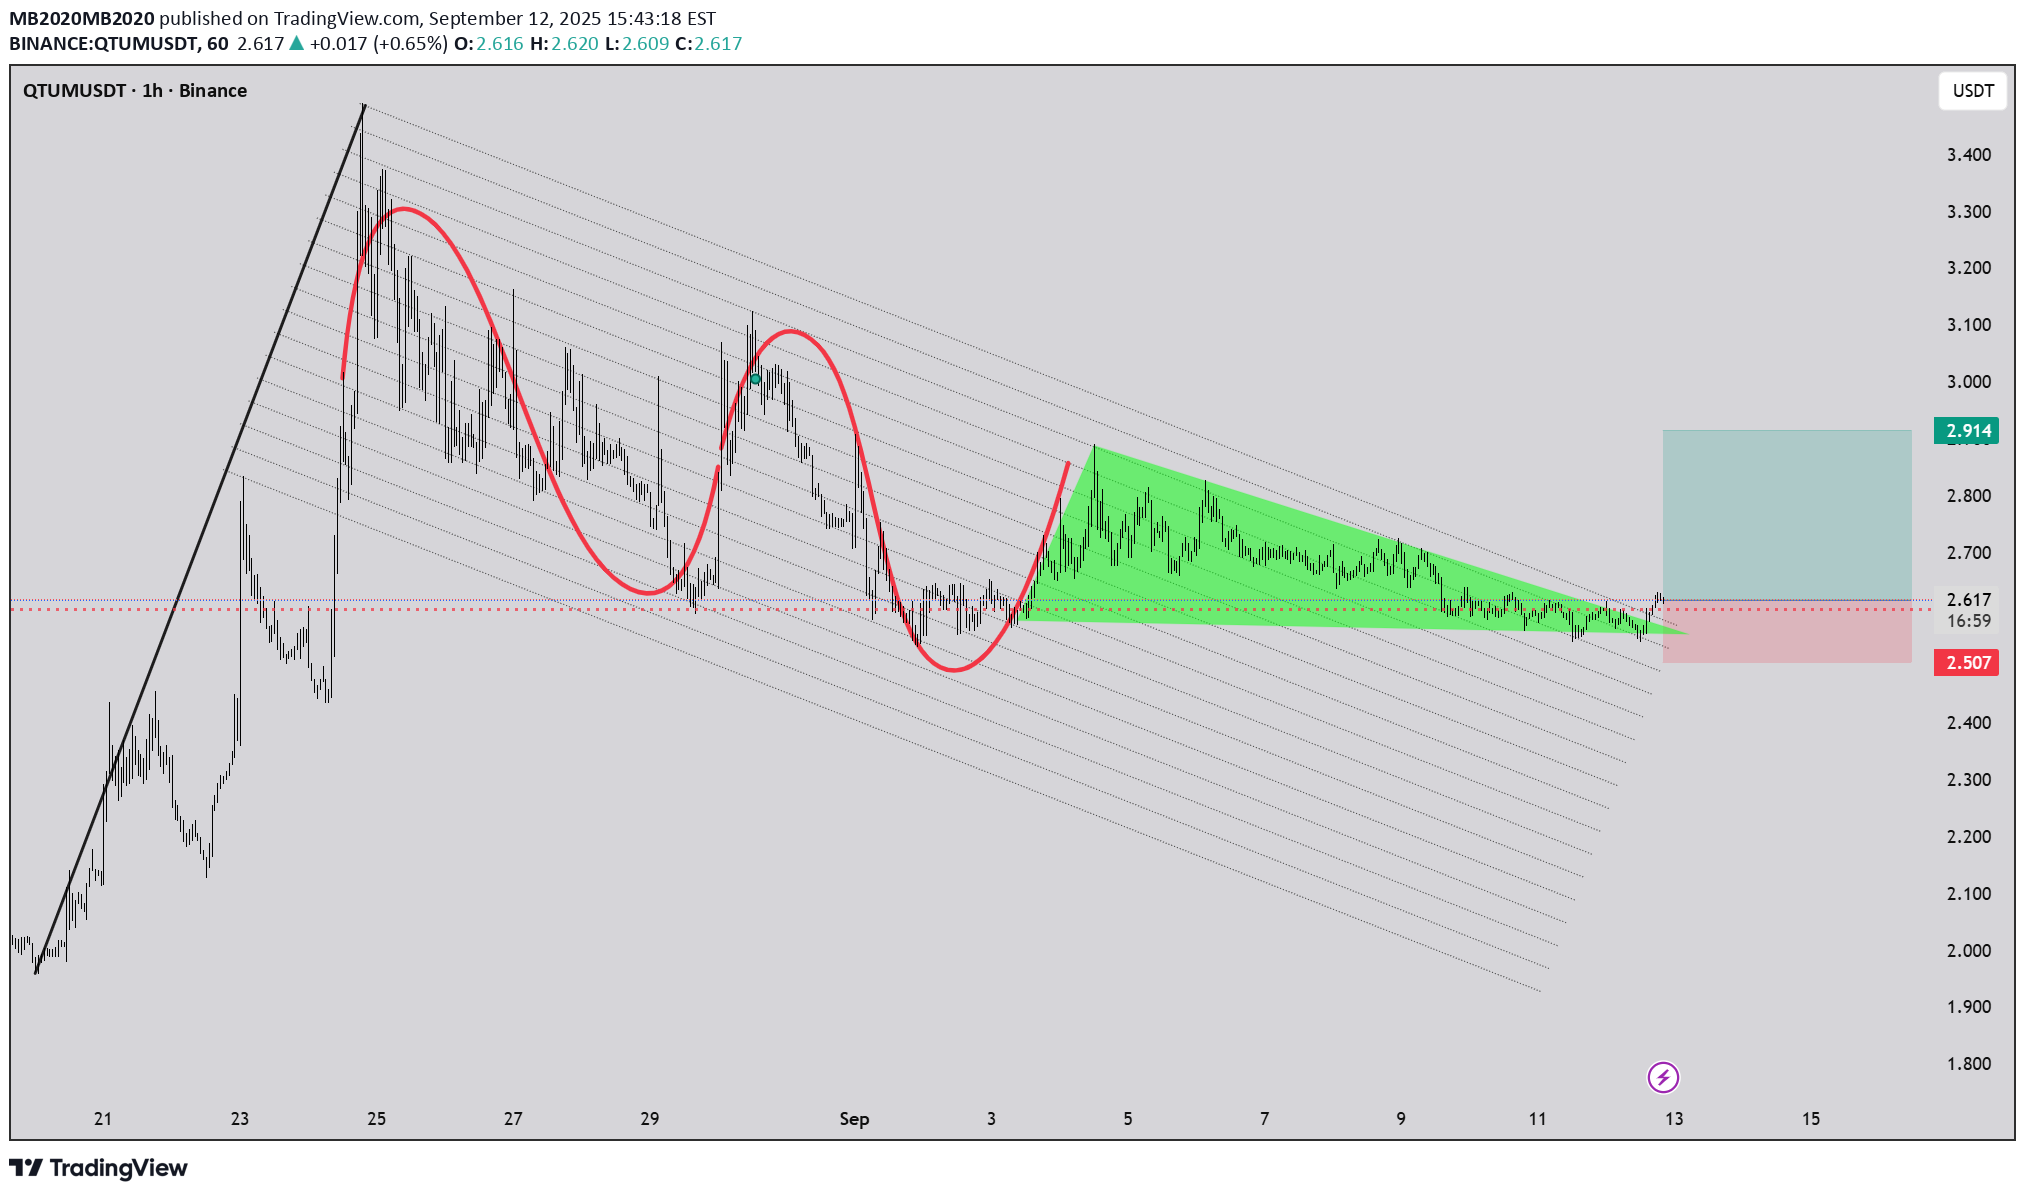
Dear friends, I warmly invite you to like this post, leave a comment with your thoughts, and share it with your friends. Your support truly means the world to me! Your likes, comments, and shares are incredibly inspiring and encourage me to create and share more analysis with you all. Thank you so much for your kindness and encouragement! Warm regards, Max
MB2020MB2020
TRXUSDT-4h-LONG
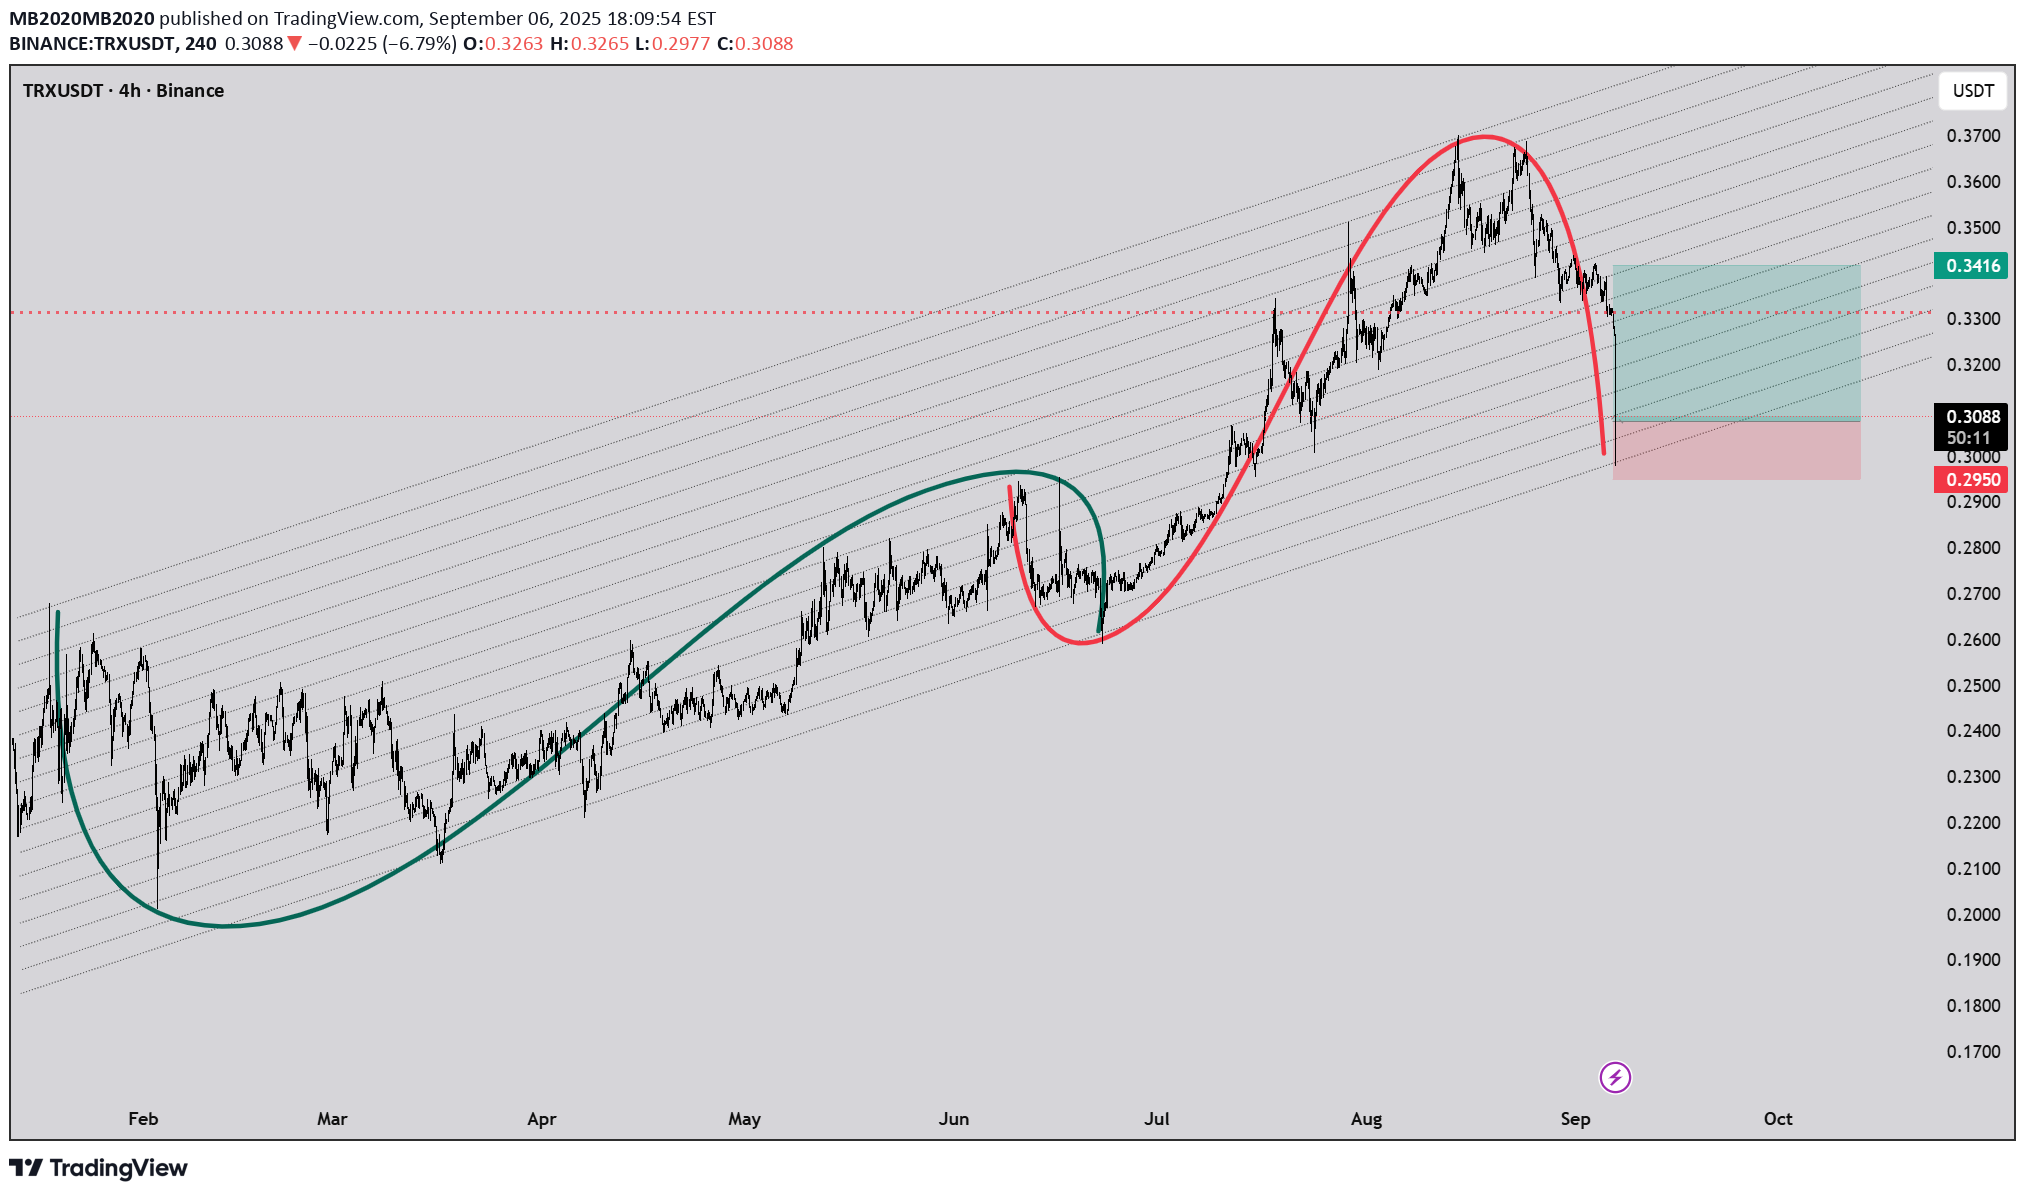
The red cycle appears to have completed around the recent peak in July-August, indicating a potential reversal point. The price has approached the lower boundary of the ascending Fibonacci channel, which coincides with the completion of the red cycle. The interaction at this support could lead to a bounce if buying pressure increases, or a breakdown if selling continues, depending on subsequent candlestick patterns and volume. This confluence marks a critical area to watch for confirmation of the next trend direction.TARGET REACHED Dear friends, I warmly invite you to like this post, leave a comment with your thoughts, and share it with your friends. Your support truly means the world to me! Your likes, comments, and shares are incredibly inspiring and encourage me to create and share more analysis with you all. Thank you so much for your kindness and encouragement! Warm regards, Max
MB2020MB2020
bitcoin -1h-long
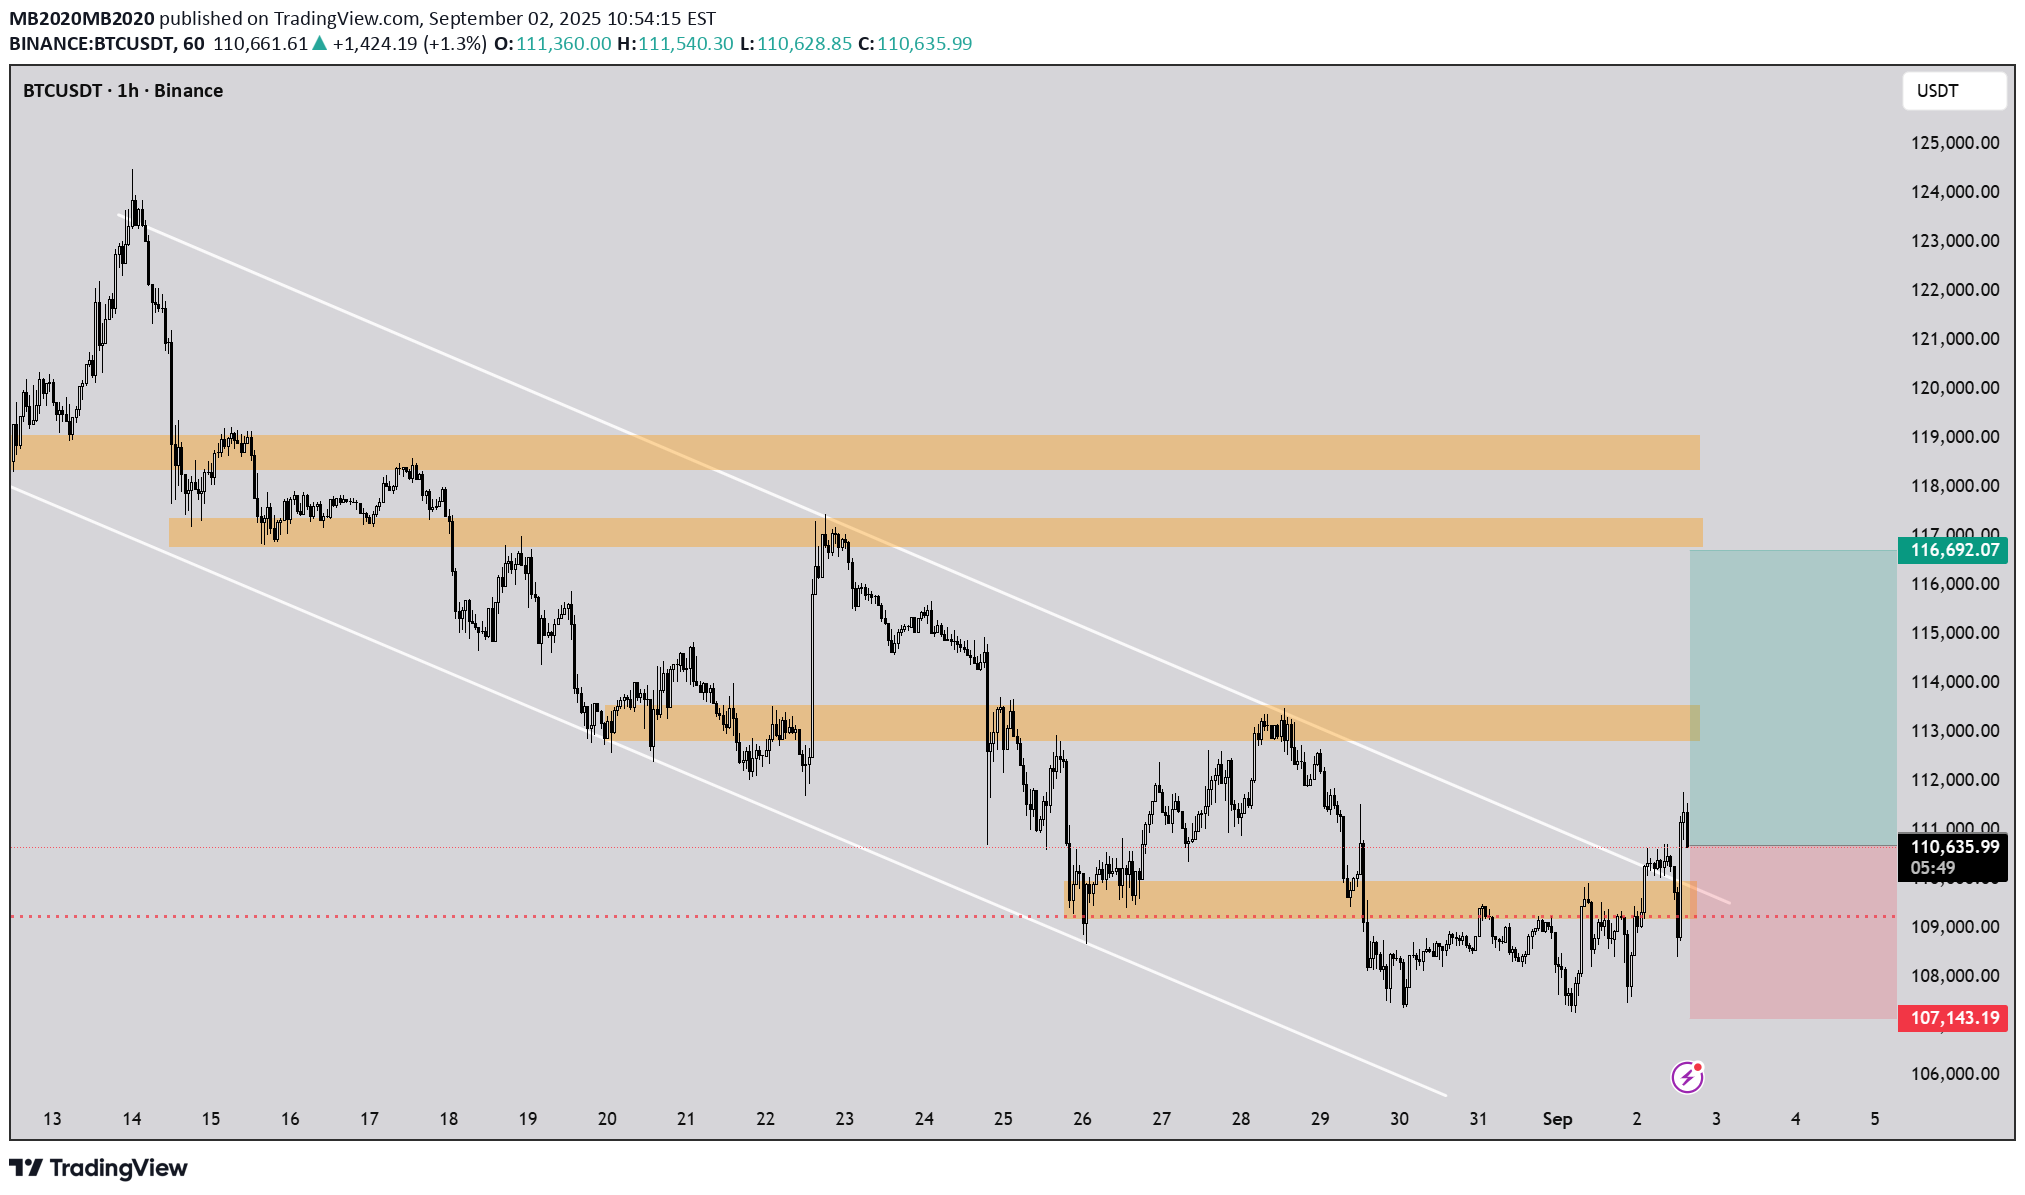
This chart showcases a significant price movement on a 1-hour timeframe. The price has recently broken out of a well-defined descending channel, indicating a potential shift in momentum. The breakout is accompanied by a decisive break below the trendline, which had previously acted as dynamic support. This move suggests a bearish continuation, with the price testing lower levels. Traders should watch for confirmation through increased volume and potential retests of the broken trendline for support turned resistance. The chart also highlights key horizontal levels that may serve as future support or resistance zones.TP1 done!!!! If you like, please hint.TP1 done If you like, please hint.TARGET REACHED Dear friends, I warmly invite you to like this post, leave a comment with your thoughts, and share it with your friends. Your support truly means the world to me! Your likes, comments, and shares are incredibly inspiring and encourage me to create and share more analysis with you all. Thank you so much for your kindness and encouragement! Warm regards, Max
MB2020MB2020
XMRUSD( Monero ) - H1- LONG
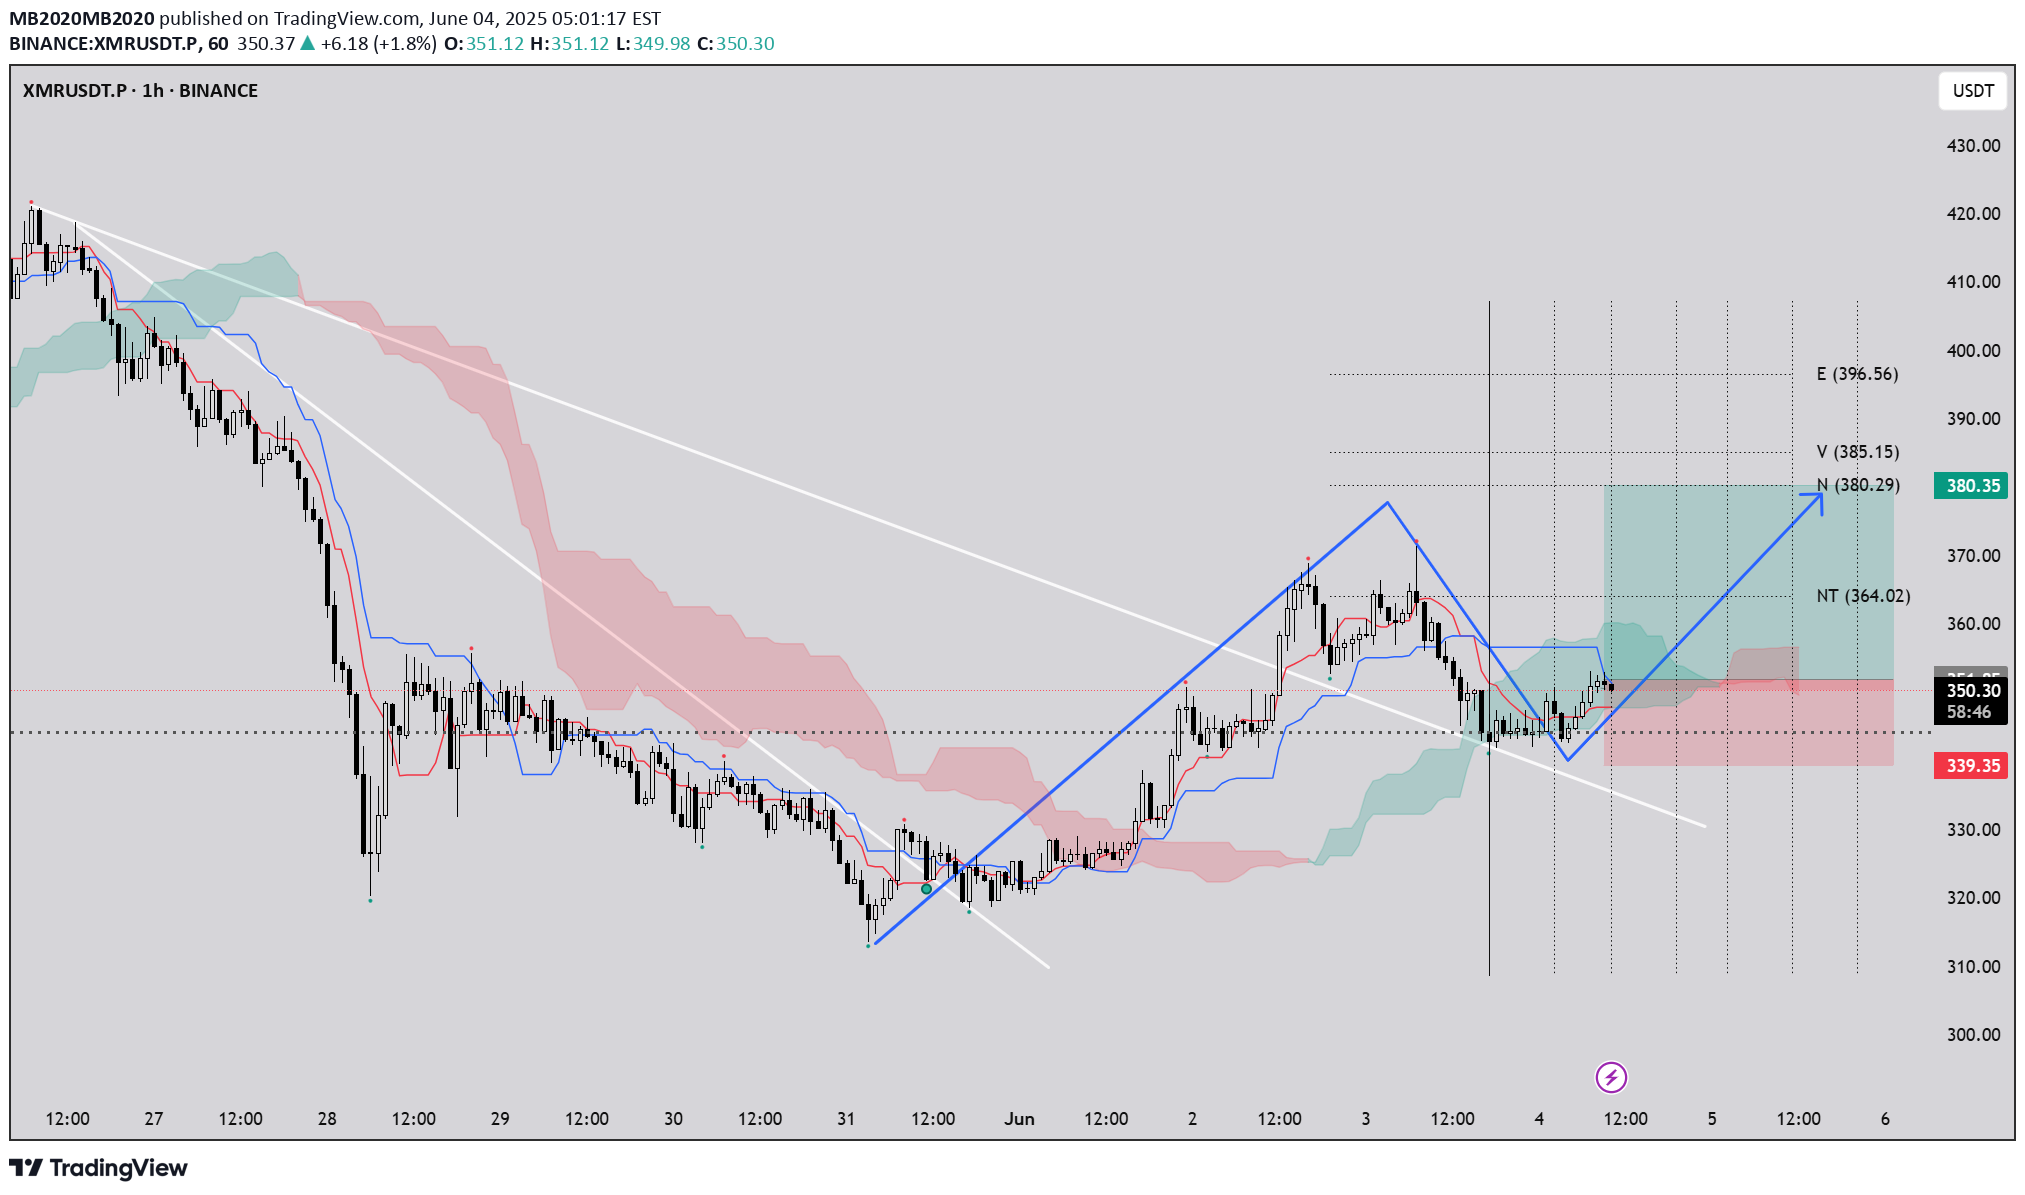
The XMRUSDT 1-hour chart on TradingView shows a promising setup for a buy position. A clear trendline break and retest pattern is visible, with the price breaking above a descending trendline and retesting it as support before moving higher. Additionally, the wave structure supports the bullish outlook, forming an N-wave pattern—a key formation in Ichimoku wave theory—suggesting a strong upward impulse. The combination of the trendline break, retest, Ichimoku cloud confirmation, and N-wave formation makes this a solid setup for a buy position.If you like the analysis, don't forget to like, share, and comment, and I'm looking forward to your constructive feedback!
MB2020MB2020
BTCUSDT 45-minute LONG
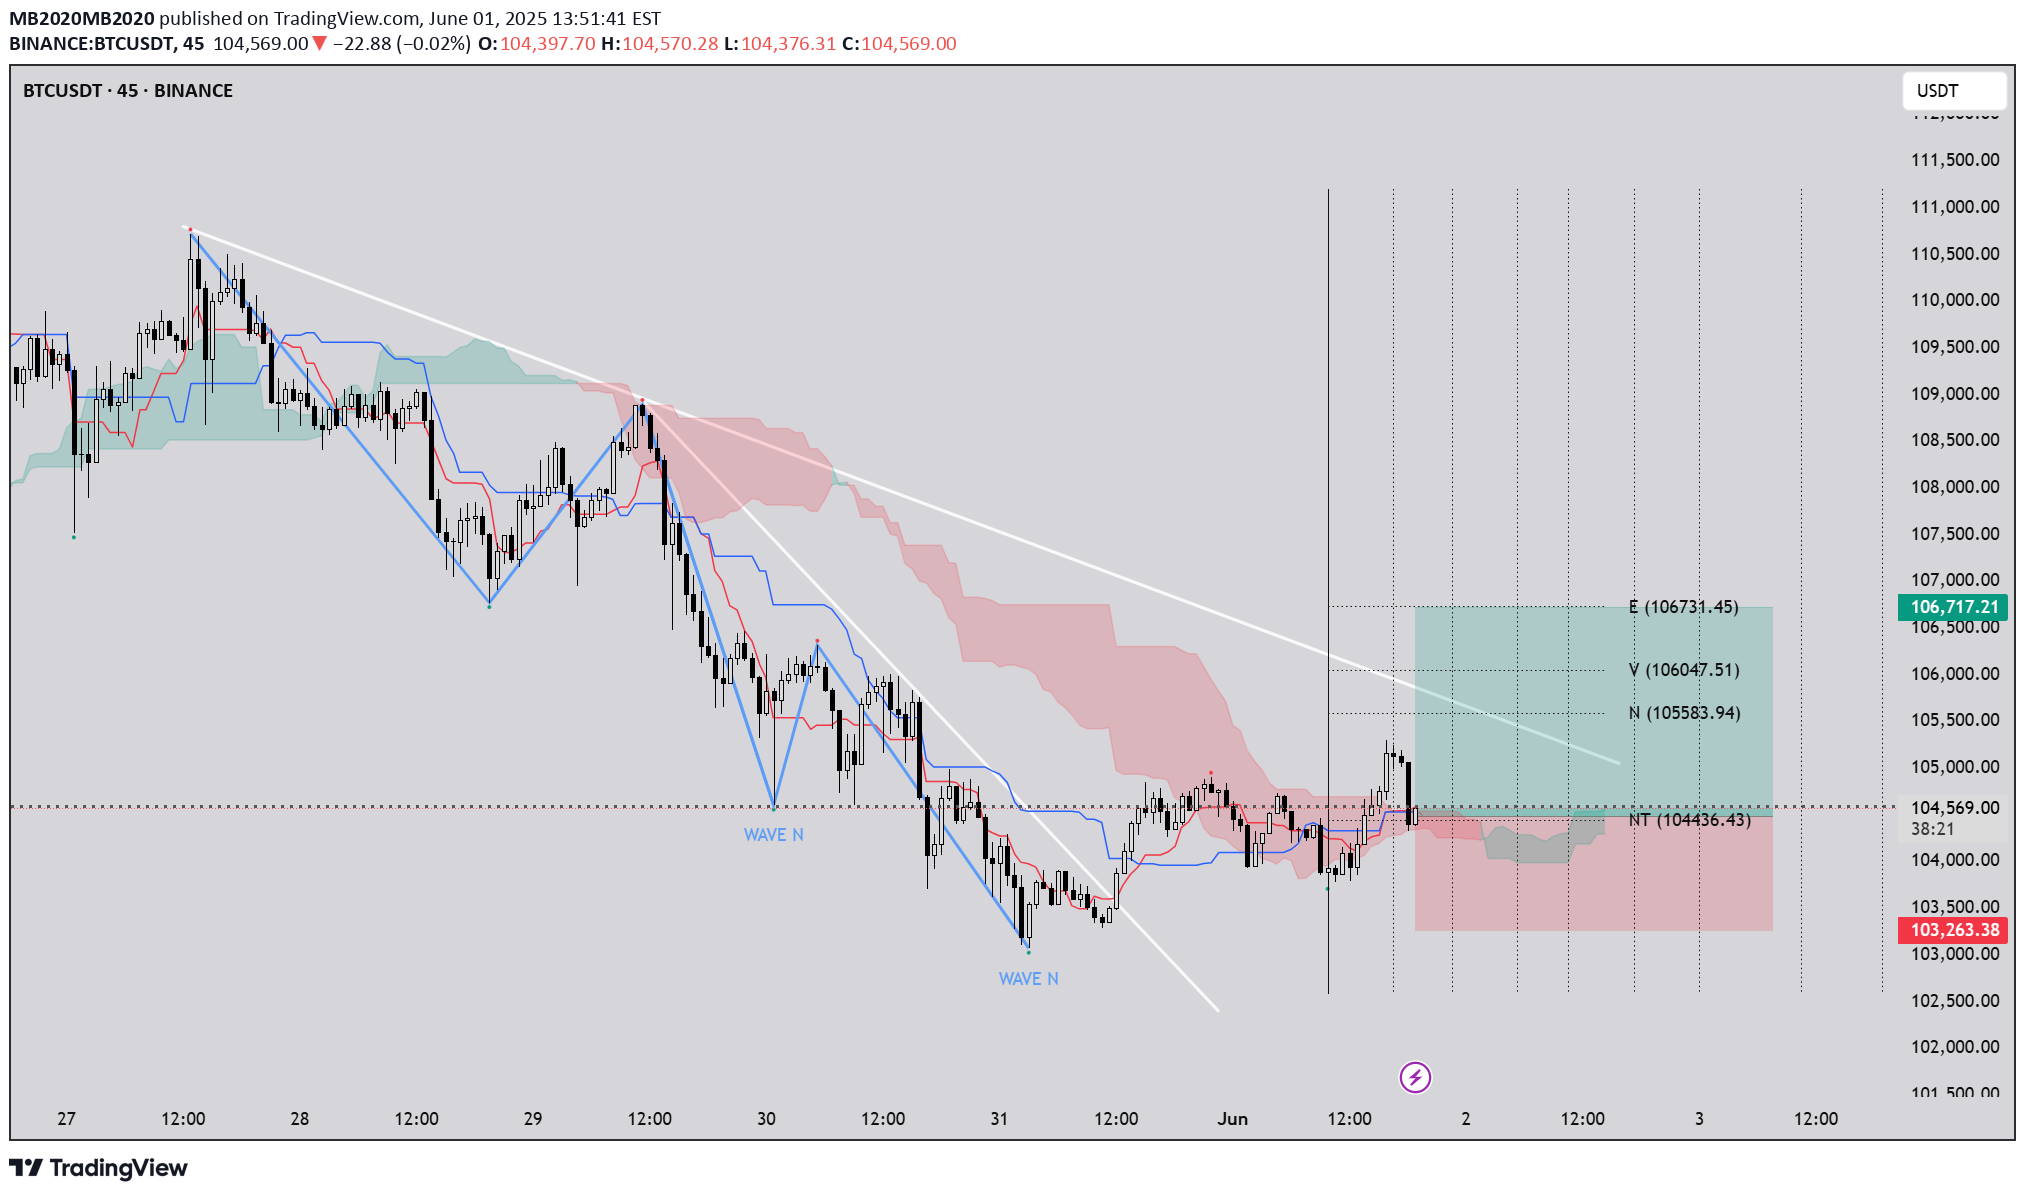
The BTCUSDT 45-minute chart presents a promising setup for a buy position. A significant downtrend line has been broken, followed by a successful retest, suggesting a potential trend reversal. The Ichimoku Cloud reinforces this bullish outlook, with the price breaking above the cloud, indicating strengthening momentum. Additionally, the chart features a clear Wave N formation, a key pattern in wave theory, which further supports the bullish bias. This combination of a trendline break with retest, Ichimoku confirmation, and Wave N structure provides a solid foundation for considering a buy position.If you liked this analysis, hit the BOOST !N and V waves were formed and their respective targets were touched. You can continue to wait for target E to be touched or close your trades manually.If you liked this analysis, hit the BOOST !Target E was touched and the price can continue to move towards the next targets. But we exit the trade at this point and close our positionIf you liked this analysis, hit the BOOST !
MB2020MB2020
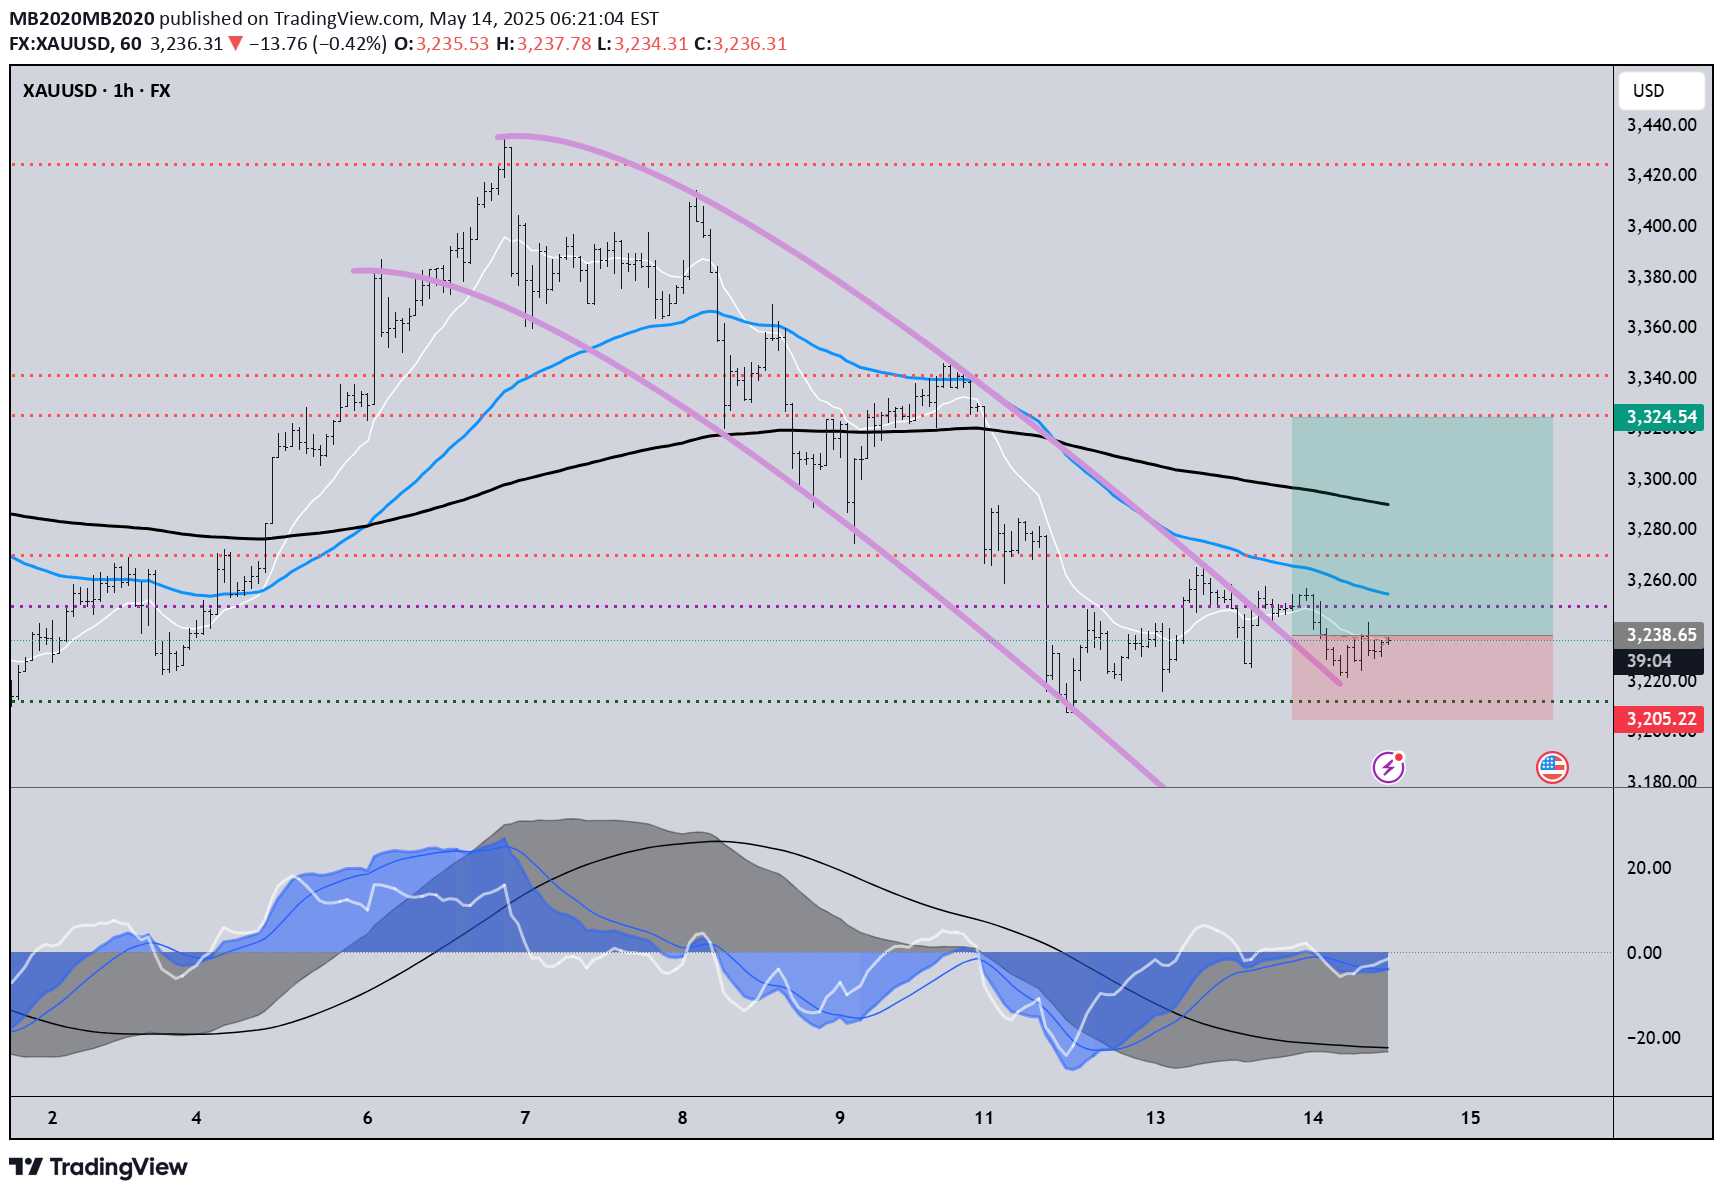
GOLD-H1-LONG
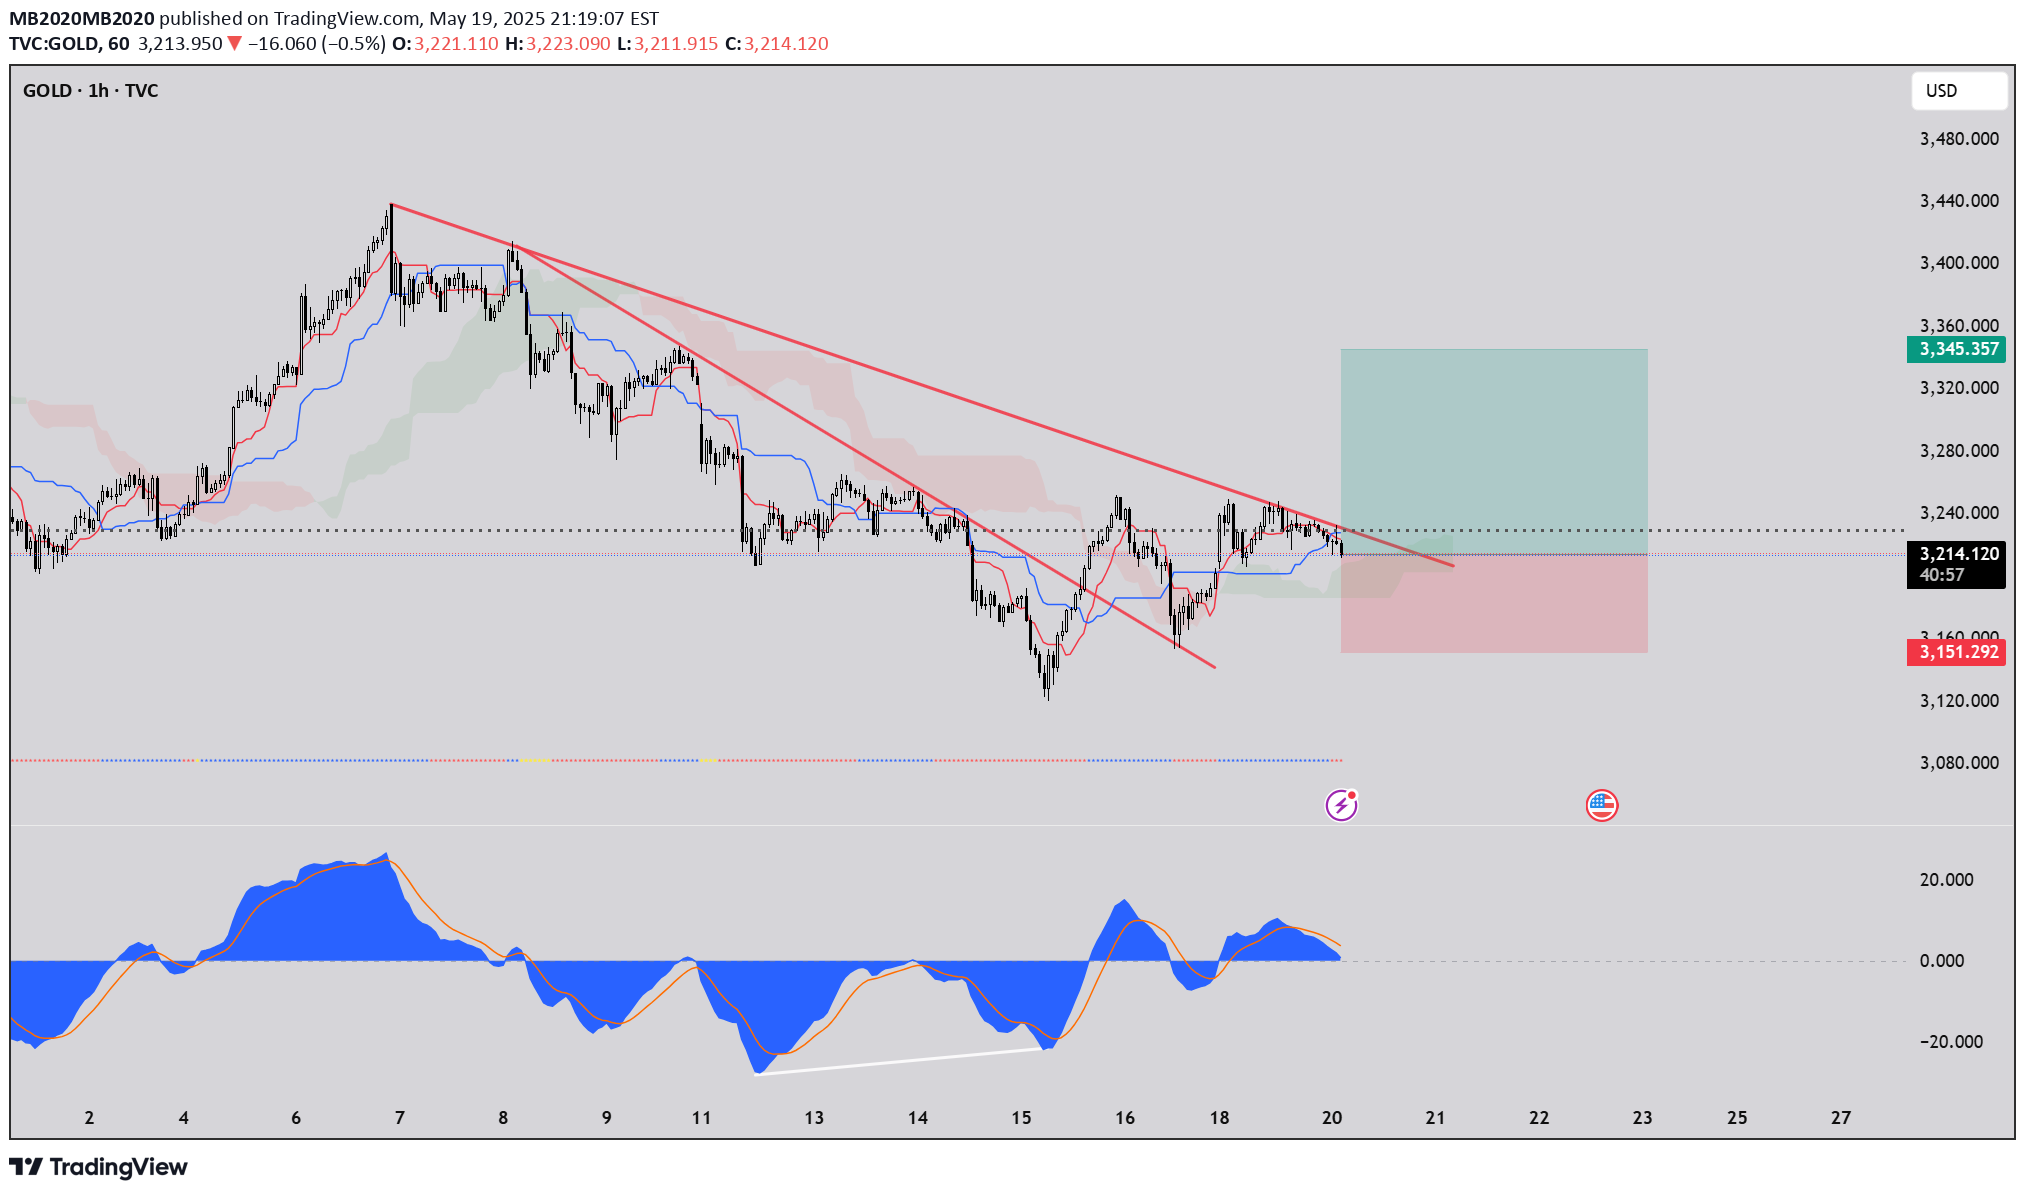
If the price breaks above the trendline and consolidates above it, it could signal a potential buying opportunity. The consolidation above the trendline would indicate that the bearish momentum has weakened, and a bullish trend might be starting. Additionally, watch for the price to move back into the green Ichimoku Cloud to confirm the buy signal. Always consider other factors like volume and market conditions before entering a trade.the price breaks above the trendline
MB2020MB2020
BTCUSDT-H1-SHORT
BTC is approaching a strong resistance zone at $106,000 after a recent uptrend. The price is near the upper boundary of the green zone ($102,000–$106,000), suggesting overbought conditions.Bearish signals: declining volume, overbought zone, and resistance at $106,000. Watch for a rejection at this level for confirmation.
MB2020MB2020
GOLD-H1
The price is nearing a key support area around 3,200–, which could act as a bounce point for a buy.Risk: The trend is currently bearish, so a buy here is counter-trend. If support fails, the price could drop to 3,180 . Wait for confirmation of a reversal before entering.
Disclaimer
Any content and materials included in Sahmeto's website and official communication channels are a compilation of personal opinions and analyses and are not binding. They do not constitute any recommendation for buying, selling, entering or exiting the stock market and cryptocurrency market. Also, all news and analyses included in the website and channels are merely republished information from official and unofficial domestic and foreign sources, and it is obvious that users of the said content are responsible for following up and ensuring the authenticity and accuracy of the materials. Therefore, while disclaiming responsibility, it is declared that the responsibility for any decision-making, action, and potential profit and loss in the capital market and cryptocurrency market lies with the trader.