
LygridTrading
@t_LygridTrading

What symbols does the trader recommend buying?
Purchase History
پیام های تریدر
Filter
LygridTrading
BTCUSDT – Bearish signs emerge below resistance
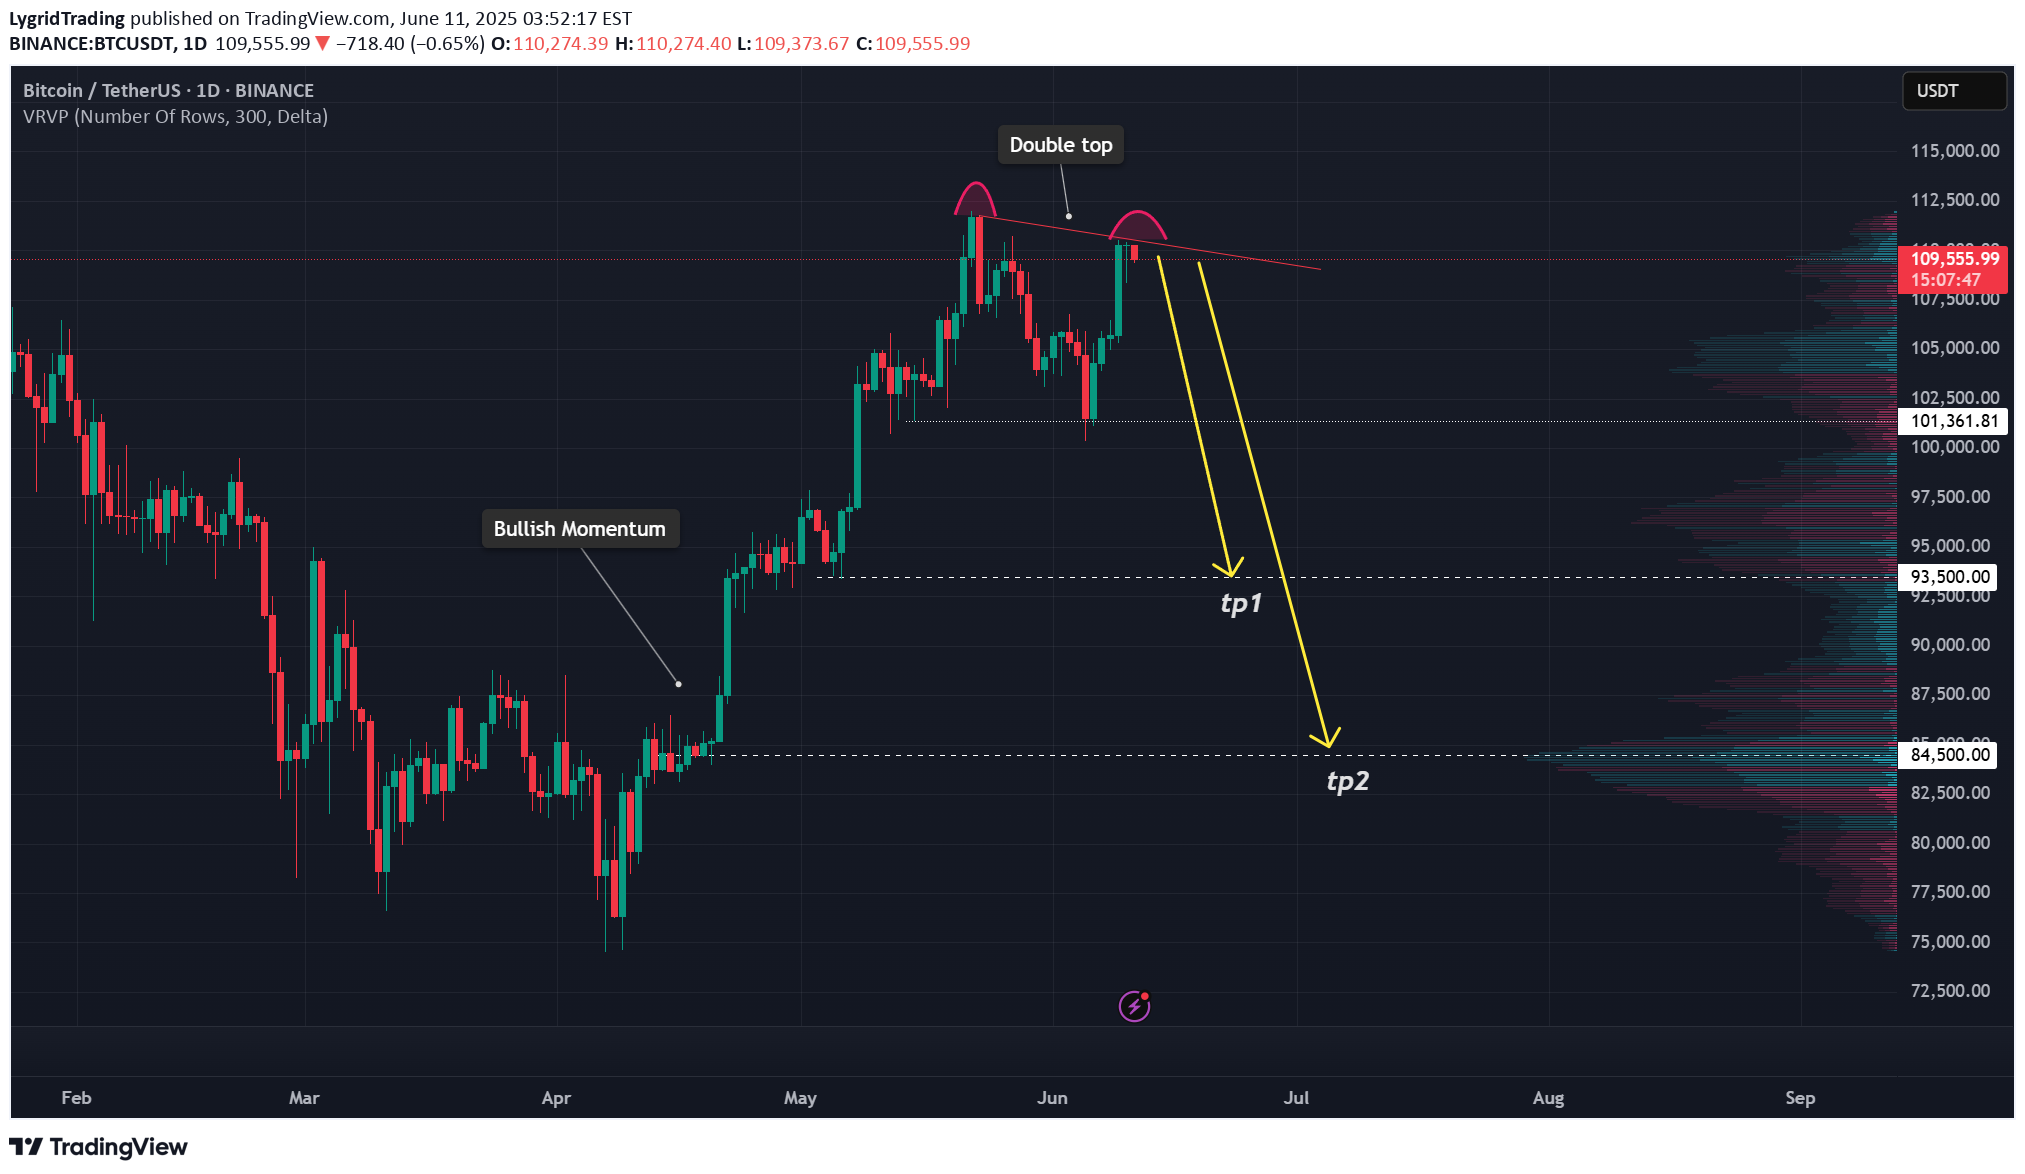
After a strong bullish run, BTCUSDT is now showing clear signs of weakness near the resistance zone around 109,600–112,000. Price action has formed a cluster of rejection candles at the top, failing to break above this key level – signaling that selling pressure is gaining control.The current structure suggests a potential trend reversal, especially as the latest bearish candle came with rising volume, confirming selling interest from the supply zone. If the price breaks below the 101,500 support, BTC may continue dropping toward the 93,500–84,500 range – a high-liquidity area on the volume profile.The previous bullish momentum appears to have lost strength, and this pullback may be confirming a shift after reaching its upper limit. As long as BTC remains below the 112,000 resistance, the bearish bias remains dominant.
LygridTrading
XAUUSD analysis - potential for pullback and continuation
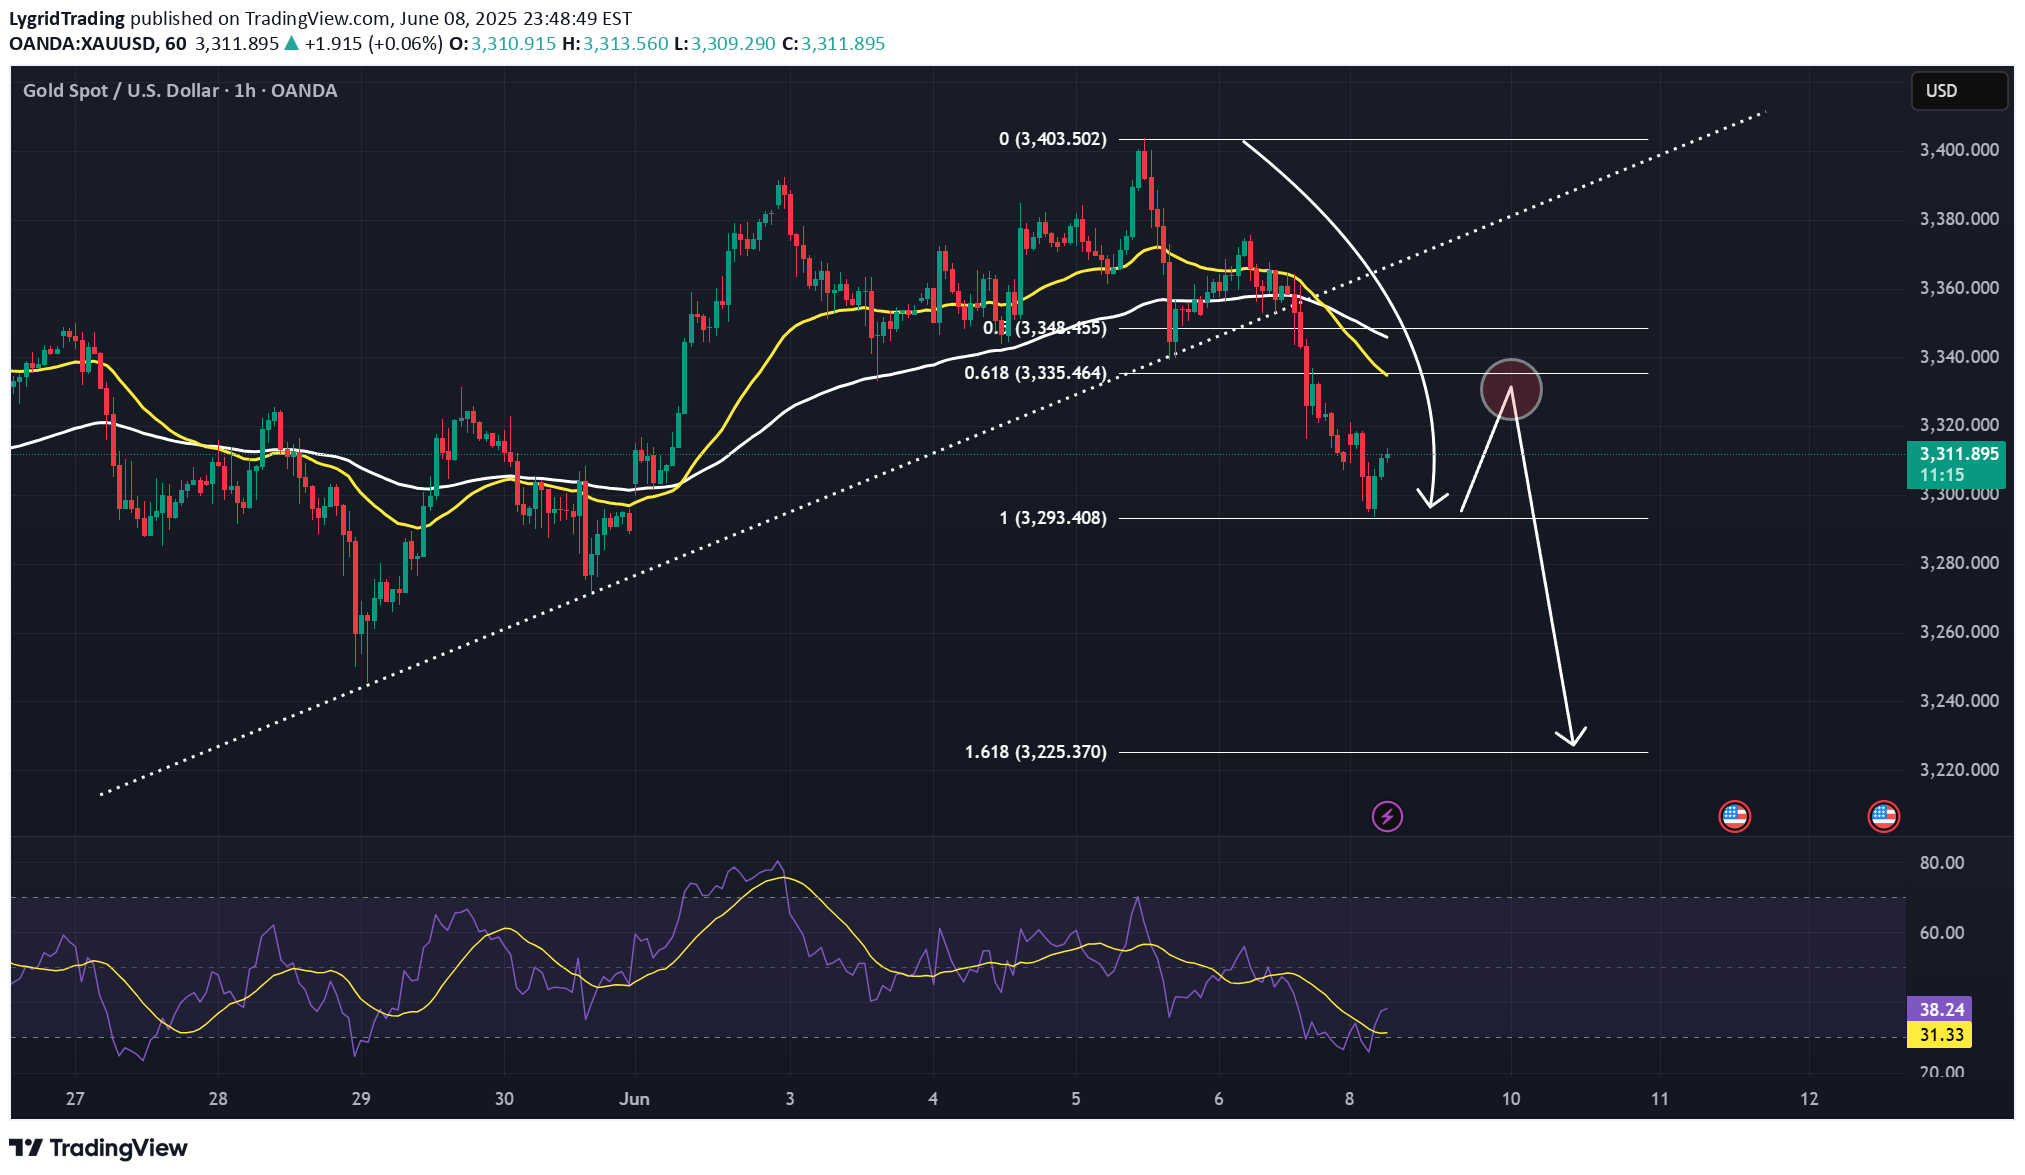
XAUUSD is currently consolidating near $3,310 after a decisive breakdown below the ascending trendline, signaling a shift in the short-term structure from bullish to bearish. This breakdown was accompanied by strong bearish momentum, indicating that buyers have temporarily lost control of the market.After the initial drop, the price is now attempting to retrace toward the 0.5–0.618 Fibonacci zone, with the 0.618 level located around $3,335. This zone also coincides with dynamic resistance from short-term moving averages (EMA cluster), making it an important confluence area. A rejection from this level would confirm a bearish retest, supporting the idea of a continuation toward the 1.618 Fibonacci extension near the $3,225 level.However, if the price breaks and holds above $3,348, the bearish scenario will be invalidated, potentially signaling that buyers are regaining strength and may aim to reclaim higher resistance levels.Traders are advised to wait for confirmation, such as a bearish engulfing candle, rejection wicks, or a surge in volume, before entering short positions. As always, this is a personal viewpoint, not financial advice. Trade with appropriate risk management.
LygridTrading
Will gold continue its uptrend from the 3,300 USD level?

Hello dear traders!Gold prices continued to decline against the US Dollar (USD) on Friday, falling below the previous psychological support level, which is now resistance, at 3,350 USD. The main reason was that the US Dollar gained some positive momentum as the market leaned toward the Fed maintaining its current policy in July following the May report, causing XAUUSD to move lower into the weekend.From a technical perspective, as previously analyzed, gold broke below the psychological support level of 3,350 USD on Friday, with prices approaching the 3,300 USD support level at the time of writing. However, the RSI has dropped to the 30 level, indicating that selling pressure may be losing momentum, and global economic stress could potentially limit further losses.
LygridTrading
Gold Sells Off Continuously - Will $3,300 Limit Losses? (Read)

Hello dear traders!Gold prices continued to decline against the US Dollar (USD) on Friday, falling below the previous psychological support, which is now a resistance level, at 3,350 USD. The main reason is that the US Dollar gained some positive momentum as the market leaned toward the Fed keeping its policy unchanged in July after the May report, causing XAU/USD to drop lower by the weekend.From a technical perspective, as analyzed, Gold broke below the psychological support of 3,350 USD on Friday, with prices approaching the 3,300 USD support level at the time of writing. With the RSI falling to the 30 level, it suggests that the sellers may be losing momentum and global economic stress might limit losses.Regarding the upcoming outlook for XAUUSD: As long as the price holds above the 3,300 USD support level, I maintain a bias toward the buying side. However, if the price clearly breaks below this zone, the bullish outlook may be invalidated, and the short-term trend could shift to neutral or bearish. This is a sensitive area where upcoming price action will provide clearer signals about the market’s next direction.This is just my view on support and resistance zones, not financial advice. Always confirm your setups and trade with proper risk management.
LygridTrading
Gold Update – Will Buyers Drive It to 3,485 USD?
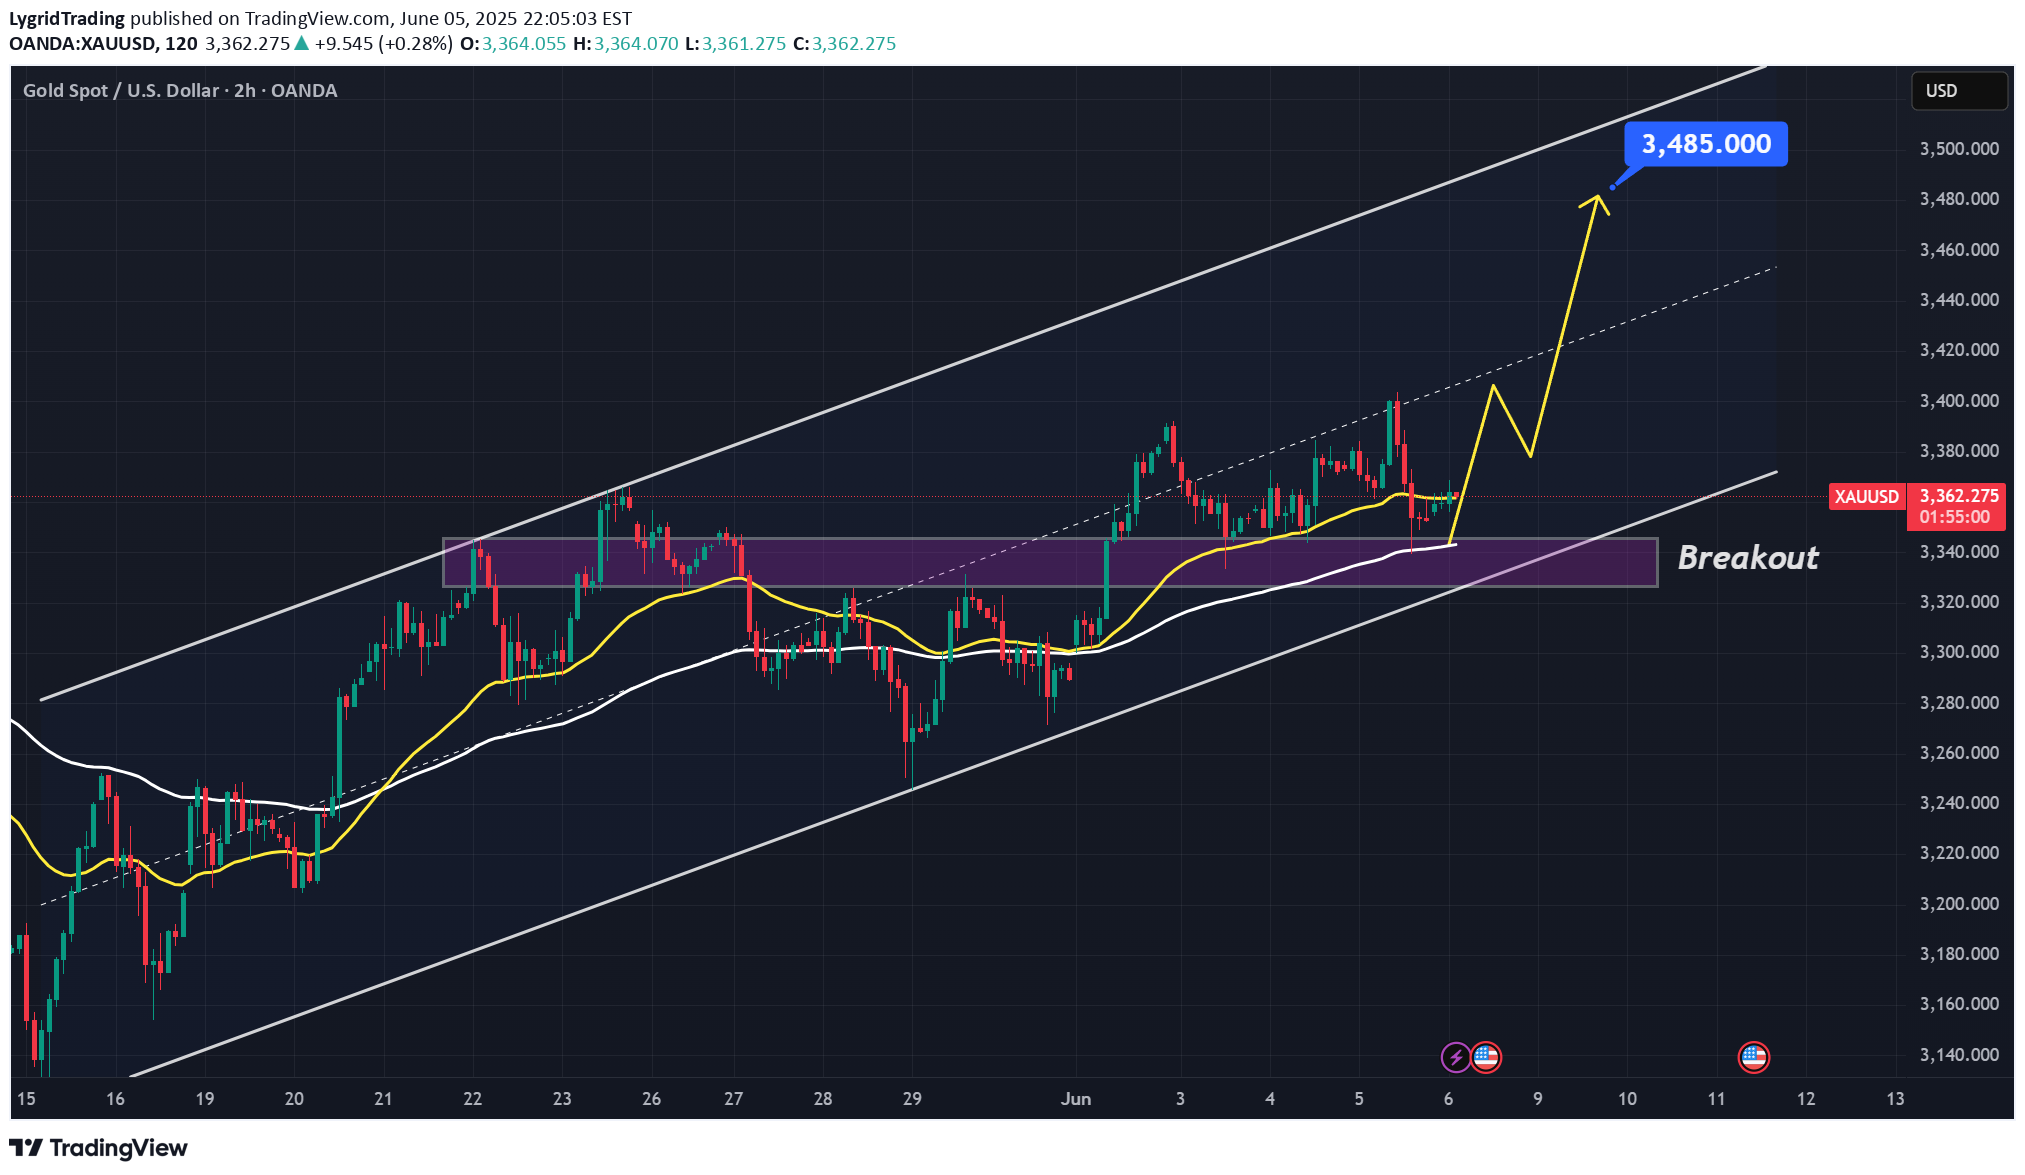
Great to see all traders again in today’s gold price discussion at the end of the trading session. LyngridTrading here!Yesterday, gold dropped sharply, with the metal falling by 600 pips during the US session. However, by this morning, it quickly regained its upward momentum, supported by buying pressure around the 3,340 USD support zone.Specifically, gold regained its momentum after the latest data on the US labor market was just released, showing that the number of initial state unemployment claims rose to 247,000 (seasonally adjusted) by the end of May 2025, according to the announcement from the U.S. Department of Labor. This figure is higher than expected, reflecting a weakening US labor market, which has increased expectations that the Fed will soon cut interest rates to support the economy.From a technical perspective, as previously analyzed, gold holds a strong short-term technical advantage from the support zone around 3,340 USD. If buying pressure continues, there will be nothing stopping it from rising to 3,485 USD, in line with the idea scheduled at the same time yesterday.Gold is showing signs of rising again. So, I will enter the position now.
LygridTrading
XAUUSD: Bullish Structure Still Intact?

Dear friends,To begin this post, I want you to understand why I want to connect with the global TradingView community. Simply put, I want to share the value I have and listen to more perspectives from all of you. This helps build a stronger, more united community. And what about you. What do you think of XAUUSD hovering around 3,370 USD?Let’s explore it together! XAUUSD is moving within a very clear ascending channel, with price action consistently respecting both the upper and lower boundaries. This indicates that the bullish structure is still being maintained and the buyers remain in control. The recent upward momentum further reinforces the belief that this trend could continue.The price is currently approaching a key support zone, marked by the lower boundary of the channel and a previous demand area. If this zone holds, it could offer a strong re-entry opportunity for buyers. The projected bullish target is 3,485 USD, which aligns with the upper boundary of the channel and represents a reasonable upside objective. This is the area I will closely monitor to find a trend-following buy entry, as long as bullish momentum remains intact.Of course, I do not dismiss the opposite scenario. Failure to hold this dynamic support may suggest that bullish momentum is weakening and could shift the short-term trend to neutral or bearish.Let me know your thoughts or if you see it differently!Good luck everyone
Disclaimer
Any content and materials included in Sahmeto's website and official communication channels are a compilation of personal opinions and analyses and are not binding. They do not constitute any recommendation for buying, selling, entering or exiting the stock market and cryptocurrency market. Also, all news and analyses included in the website and channels are merely republished information from official and unofficial domestic and foreign sources, and it is obvious that users of the said content are responsible for following up and ensuring the authenticity and accuracy of the materials. Therefore, while disclaiming responsibility, it is declared that the responsibility for any decision-making, action, and potential profit and loss in the capital market and cryptocurrency market lies with the trader.