
LtCmdrData
@t_LtCmdrData

What symbols does the trader recommend buying?
Purchase History
پیام های تریدر
Filter
Bitcoin's Final Cycle?

This began as a look at the downwards channel's BTC has been in. The red channel will be "broken" soon.. What I seem to have noticed is, the breakouts in these down channels are "Breakout's in Name Only," What I mean by that is: All BTC is doing is breaking out of nasty downwards trends that all have BTC going to zero if it doesn't (break out). So, the fact of me saying BTC is going to break out of one of these channels is rather insignificant/ obvious.. After the red channel, there is the white channel, and then the blue channel. All must be broke out of before any new "cycle," Main point is: After each of these channels get voided, there will be a selloff. The red channel will get voided in a matter of weeks/1month and then I'd expect a sell off shortly there after. The worst may be the white channel in terms of drops after it gets nulled. You can see there, the drop could get as low as 10,000. (10-12 seems reasonable). --- All this post is for is to (a) Test my foresight (wink) and (b) encourage readers to be careful. ----- Nothing I write or post here is meant to be financial advice for the readers. I am not responsible for your decisions. That said, it is likely there will be one more Bitcoin cycle (100-120k as the cycle high). I have a host of reasons that lead me to think it may very well be its last .TLDR: Bitcoin's likely reversal region may still be > 10 months out. Bitcoin will defend the 10,000-12,000 USD region to begin the new cycle which would likely yield a 1000% return. a mass exit initiated by whales may follow... Would it spell the End? LMK.Hi all- When I posted this in September of 2023, the idea that BTC would have a good (5+%) month ahead-2 months was a rare take. As we can all see now, BTC jumped even higher than I expected. This changes everything about this idea. I will look at BTC again, so wait until that analysis. However, the first rule of thumb is same pattern but potentially higher lows. ============== Basically, without looking at it via my modeling, my best guess is -- we are near the mid term TOP. I do not think this is the run to ATH's. Runs to ATH's are usually rapid (much more than BTC grew these past 12 months) and typically begin immediately after the "worst its been," ******For example, Bitcoin traded below 5k less than a year before it hit 60k. *******
It will be over soon
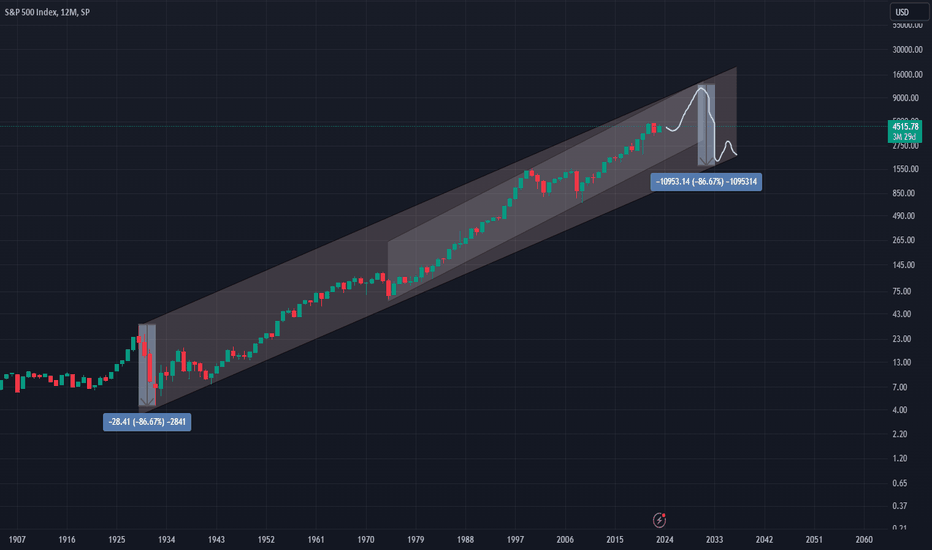
- 100 years after the Spanish flu there was Covid-19. - 100 years after the Great Depression is the Great Reset. Coincidence, maybe. ----------- But, coincidence does not change the fact that 1929 was not a one-off event. Humans are brilliant but lack a collective memory stemming back more than a generation. The gap may widen with further generations. Ie, we have less collective memory of 1929 than we do of Black Monday in 1987. The market will likely triple from now to the highs of 2030, and then the floor will fall out. Be careful, cherish your freedoms today, and see to it that we maintain our freedom beyond this incoming event.
33-36k This Summer

Hi All, BTC is on a downwards trend with the dotted lines giving some idea of where it may bounce. Regardless, and based on history, it seems a third rise in this run (which began Jan 2023) will end in or around the 33,000 USD to 36,000 USD range this summer. All else is speculation, so that is the reason why I am brief. The speculation is: Drop to white lines, bounce around and above and hit the said target sometime this summer before decreasing its price to some as yet unknown levels. ---- Pros: If you want to buy BTC and don't have the capital to do so right now, I believe you will have a better opportunity to buy later this summer or early this Fall. Cons: None! Cheers.My previous (just for fun) idea which was short term unlike the current one above:Bitcoin just obliterated the large line. Seems to be preferring the bottom of the channel. Next couple days will be very interesting. Remember to never use ideas posted on my profile as any type of financial advice. I am even more adamant about this with cryptocurrency ideas.
Next 7 days of Bitcoin

Next 7 days of BitcoinIt appears in the next 24 hours BTC could go as high as 30,000 but getting rejected shortly thereafter. It is expected that it will plummet to at least 28,400 with anything as low as 26,500 in play. This may be late Sunday or early Monday. Rebound will occur throughout the week with channel being broken sometime later next week. ------ This might be all wrong. A guess and check it is really. Do not use it to make trading decisions.
SPX Spring 2023 Outlook (Weekly)
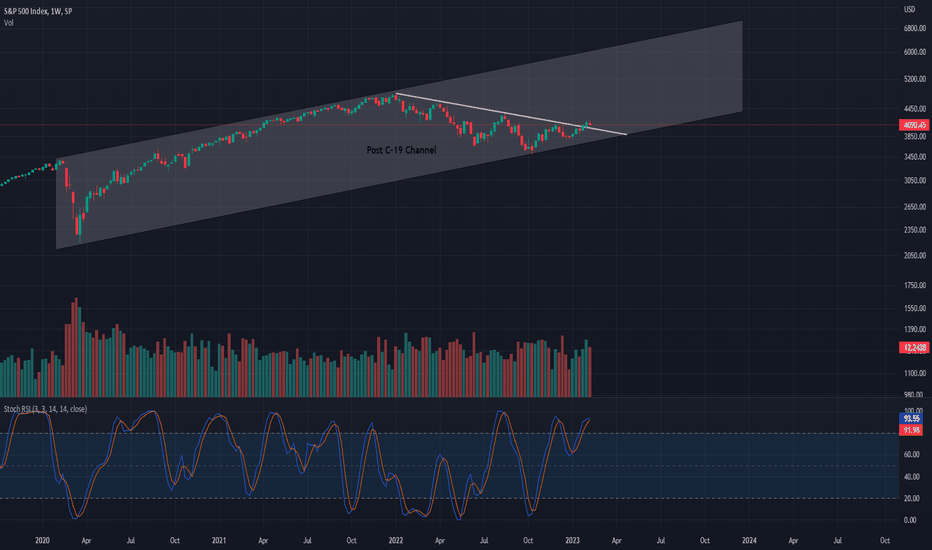
After managing to break the white line, the great line so many talked about as resistance or bull market (if broken), SPX looks to use it as support for the remainder of Spring. There is no indication that this breakout is strong & thus it seems likely that the bottom of the channel will be revisited before better times- look to April or May of this year for any reversal. ------------- This is not financial advice. ------------- The channel being traded in is solid. Only major, and by that I mean major, news could impact (break) this channel, to the downside. The world hopes for better times and thus hopes this won't happen. How the market didn't enter a deep recession during Covid is beyond my knowledge. ----------- I conclude that sideways movement is the most likely scenario for the next few months. Some sectors may have a good spring, others may not. The average will be sideways and rather boring. Perhaps we "ride" the white line down to the channel bottom. Cheers,All is going as projected yet I must mention the obvious- if the line is broken the bottom of the channel is likely.Broke the line, we will see bottom of channel today or next week. Rebound expected, but sellers win against "the line.""How the market didn't enter a deep recession during Covid is beyond my knowledge" was satire btw.This is all going as prescribed. LCDShare your thoughts with me! Many have been talking the last several days about the 4200 level of the S&P. It's likely no coincidence that level is crucial on this chart too... Note: This is a log chart for starts, so if you make a similar trend on not the log chart, it will look different. But either way, do you think this is the end of *this* particular trend??
Disclaimer
Any content and materials included in Sahmeto's website and official communication channels are a compilation of personal opinions and analyses and are not binding. They do not constitute any recommendation for buying, selling, entering or exiting the stock market and cryptocurrency market. Also, all news and analyses included in the website and channels are merely republished information from official and unofficial domestic and foreign sources, and it is obvious that users of the said content are responsible for following up and ensuring the authenticity and accuracy of the materials. Therefore, while disclaiming responsibility, it is declared that the responsibility for any decision-making, action, and potential profit and loss in the capital market and cryptocurrency market lies with the trader.