
LordDobesDaTAGod
@t_LordDobesDaTAGod

What symbols does the trader recommend buying?
Purchase History
پیام های تریدر
Filter
LordDobesDaTAGod
هشدار کد قرمز بیت کوین: آماده سقوط به ۶۰ هزار دلار باشید!
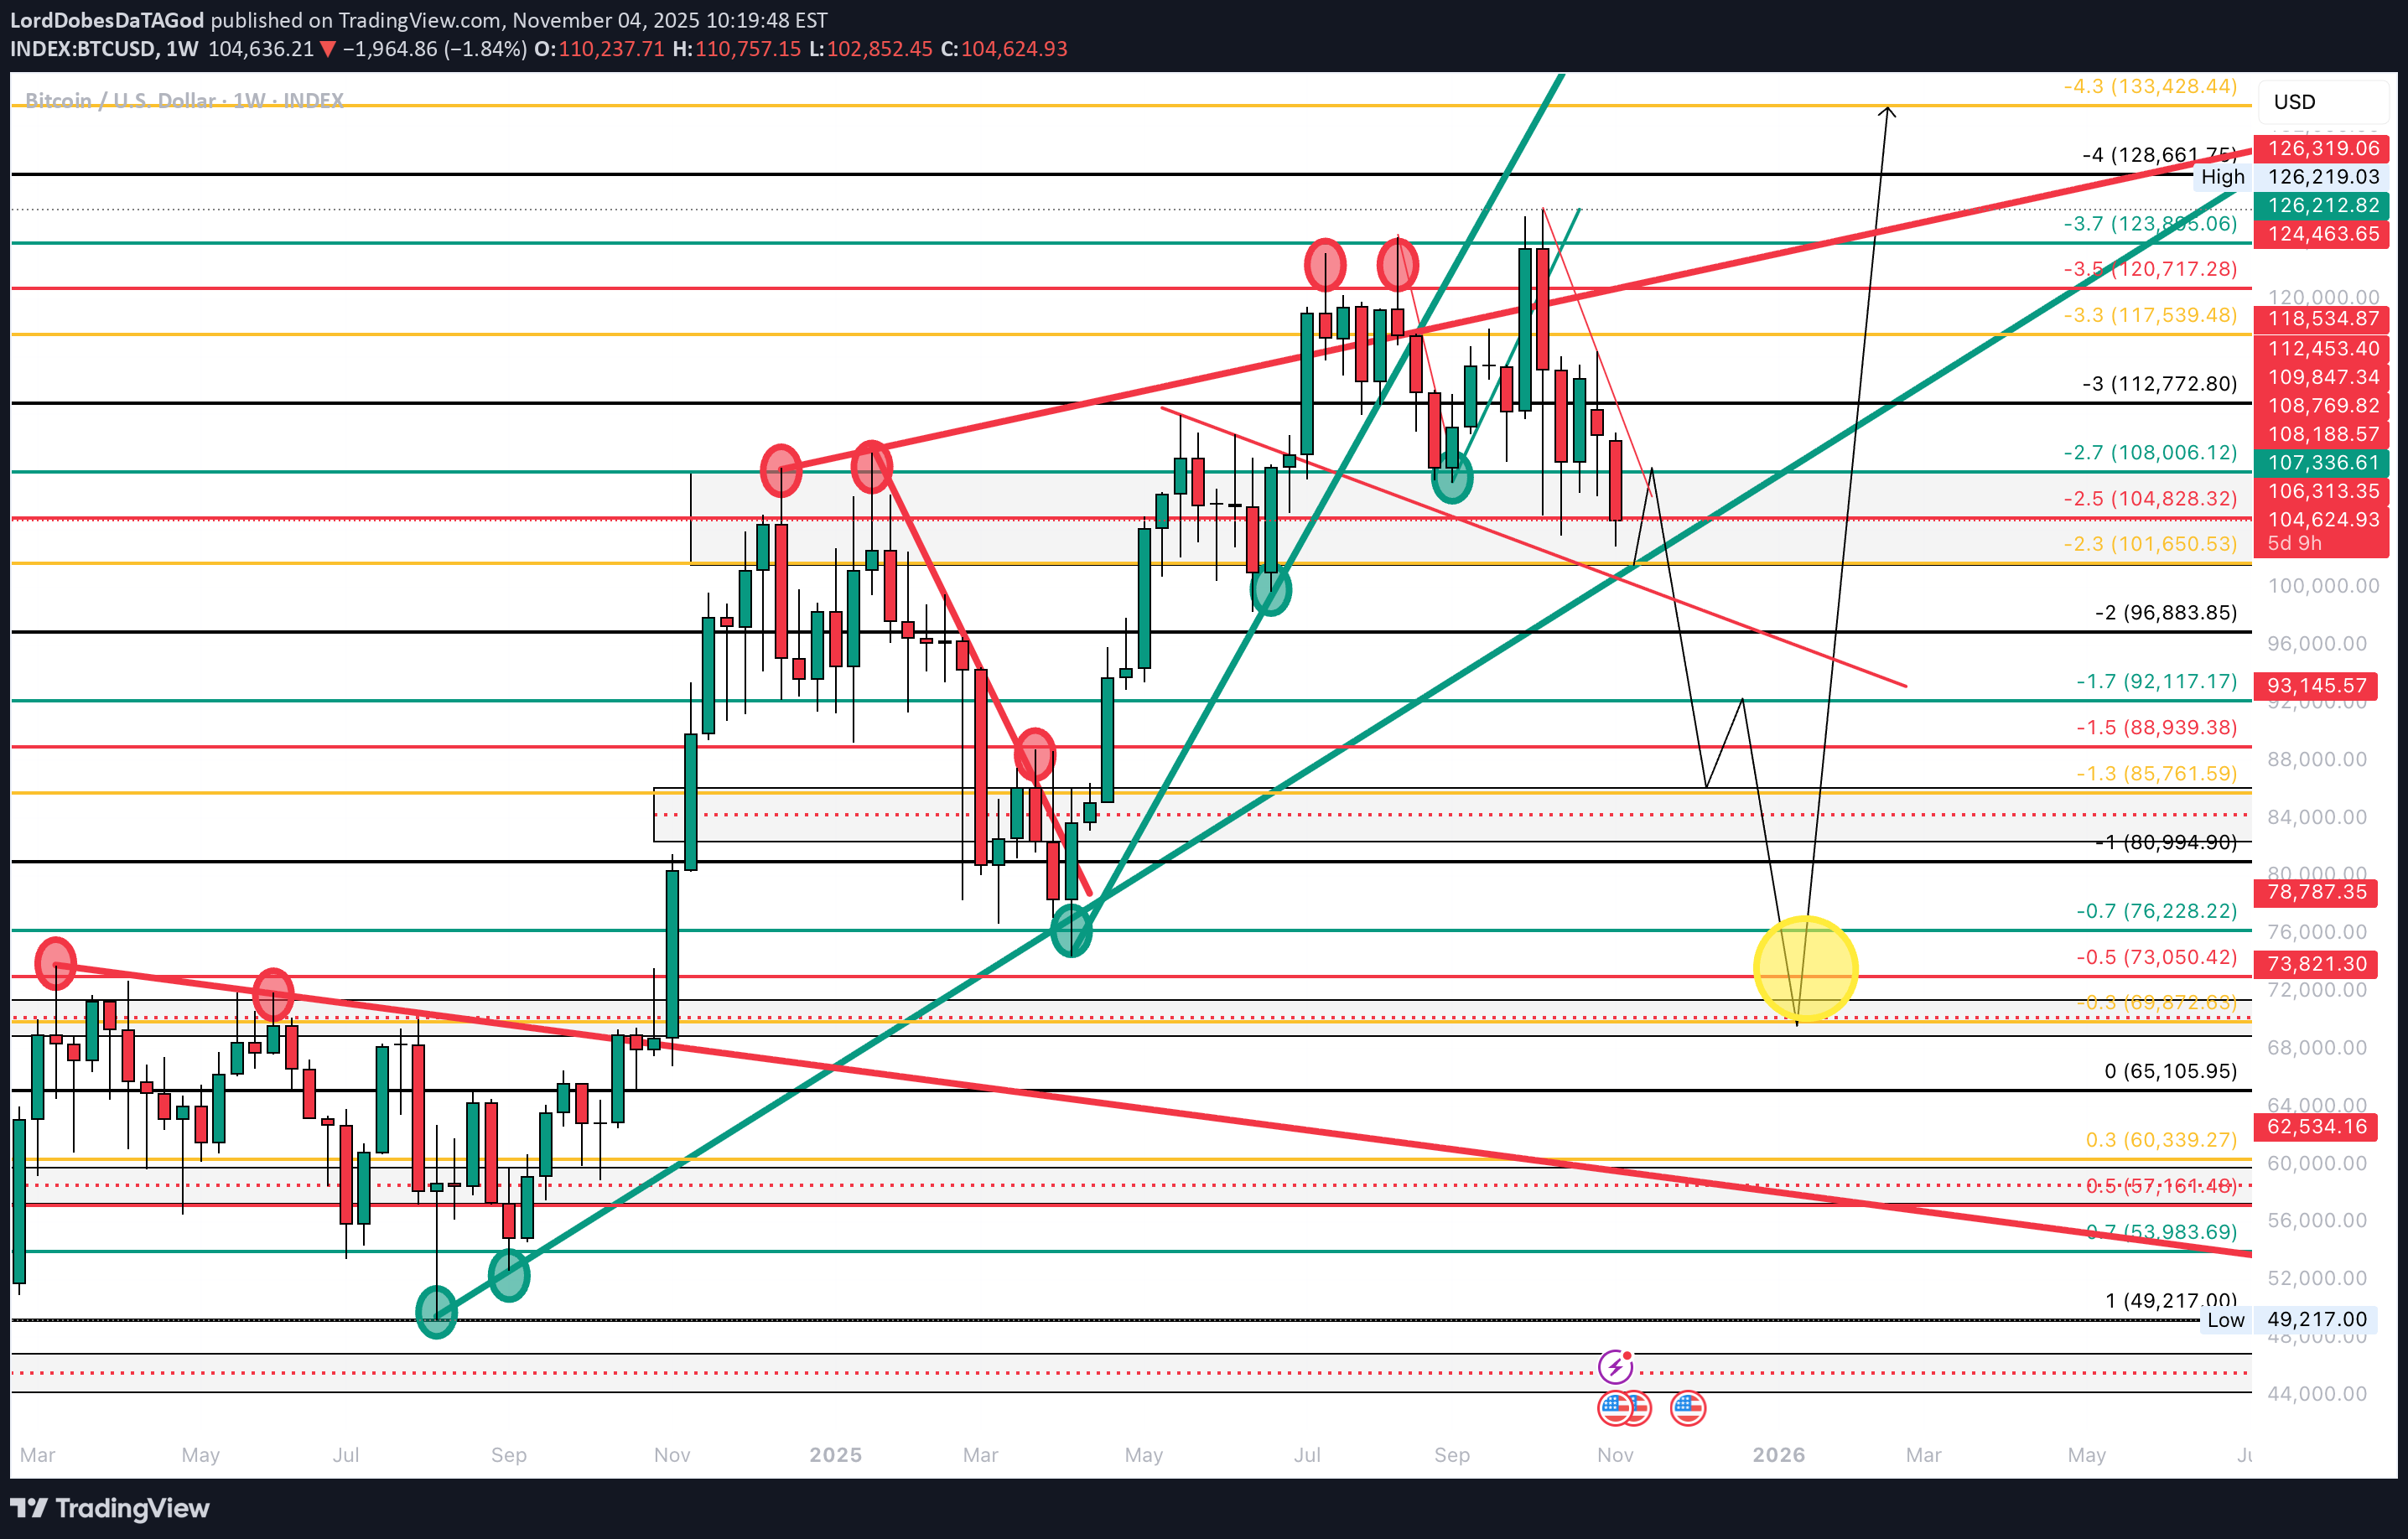
I see BTC bouncing from 101K to 108K zone then breaking the trend line and heading down to $60K zone area. It could go down further. If the price fails to hold above the red line or the green trend line, then the real bloodbath begins. Life changing money if you enter the short after the final bounce. Confluence: 1. The yellow line is weak support/resistance. 2. The price likes to break the trend line after the 4th (shortest) bounce. The 5th touch almost always breaks the trend line. Be careful out there!
LordDobesDaTAGod
BTC SHORT TO POTENTIAL SUPPORT

Expecting a bearish move to $80,000 zone (Potential Support)
LordDobesDaTAGod
More upside before a bearish move

I'm looking at the market making this move. Based on my strategy, the market looks more bullish. The market pulled back to -0.7 level (green) which a signal to buy just like it did previously at 0.7. NOT FINANCIAL ADVISE.
LordDobesDaTAGod
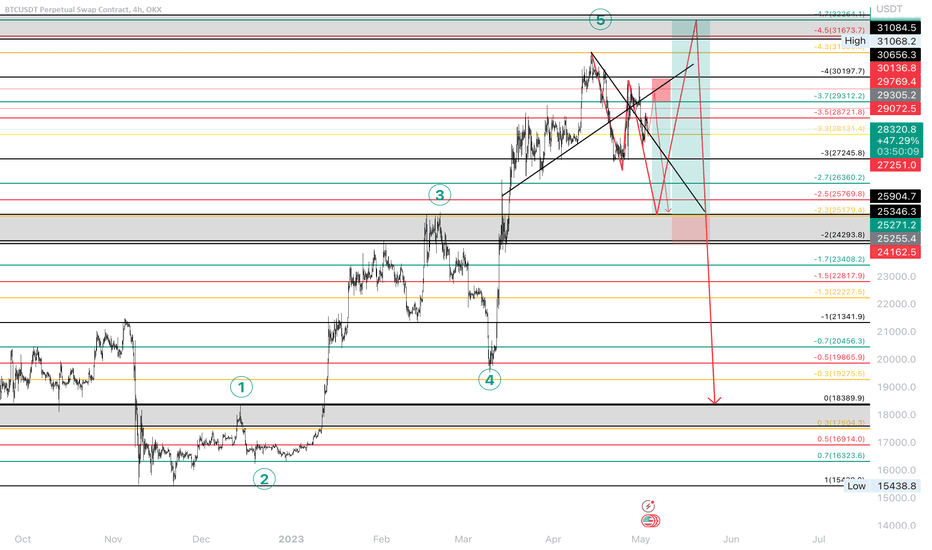
Bearish

I'm looking at this move to happen in order to push higher. Why? 1. The price failed to break the previous high. 2. Previous low broke below the red 50% level and yellow (30%) 3. A red candle closed below the green line and a bullish candle started below which could signal a bearish move down. If the price closes above the trendline, I know the price may likely push to the resistance. If it closes below the trendline and green zone, the short term bearish move is confirmed. The best and safest confirmation is a break and retest of the descending trendline+ the resistance zone at 27K
LordDobesDaTAGod
Short trade

I'm looking at this setup. The price broke the previous low and found support at -1 area and it looks like the price wont be making a new high. So I'm expecting a new low and I will be shorting to $0.45738 area. I'm waiting for confirmation to enter this trade
LordDobesDaTAGod
Short
I'm looking for these 2 moves. I think BTC still has some more juice but needs liquidity. My longterm view is bearish.So far so good :)Almost there! 🤑
LordDobesDaTAGod
Confluence Analysis

1. 2 rejections of the descending trend line and a break of the trend line. 2. The price pulls back to the 0.70 level (This level more consistent than 0.618, which is overrated, because 0.7 is a masculine number) 3. Price breaks the trend at 0.50 level signify and end to the downtrend. 4. Price pulls back to the descending trend line and the ascending trend line forming the X/crossing (X marks the spot) 5. Resistance at the 0.70 level turns to support ( Double top M turns to Double bottom W, it failed to hold at the 0.5 so it comes down to the 0.70 zone) 6. My target is 0.65. Why? Because the previous support hasn't been retested as resistance. Also the yellow lines are weak, the price never breaks a previous high or low unless it breaks below the 100 level or above the 0 level. 7. I will wait for a reaction at the 0.5 level, and see what the price is showing me and trade accordingly.Target done :)
Disclaimer
Any content and materials included in Sahmeto's website and official communication channels are a compilation of personal opinions and analyses and are not binding. They do not constitute any recommendation for buying, selling, entering or exiting the stock market and cryptocurrency market. Also, all news and analyses included in the website and channels are merely republished information from official and unofficial domestic and foreign sources, and it is obvious that users of the said content are responsible for following up and ensuring the authenticity and accuracy of the materials. Therefore, while disclaiming responsibility, it is declared that the responsibility for any decision-making, action, and potential profit and loss in the capital market and cryptocurrency market lies with the trader.