
LegionQ8
@t_LegionQ8

What symbols does the trader recommend buying?
Purchase History
پیام های تریدر
Filter
LegionQ8
XAUUSD Holds Bullish Structure - Resistance at $4,380 in Focus
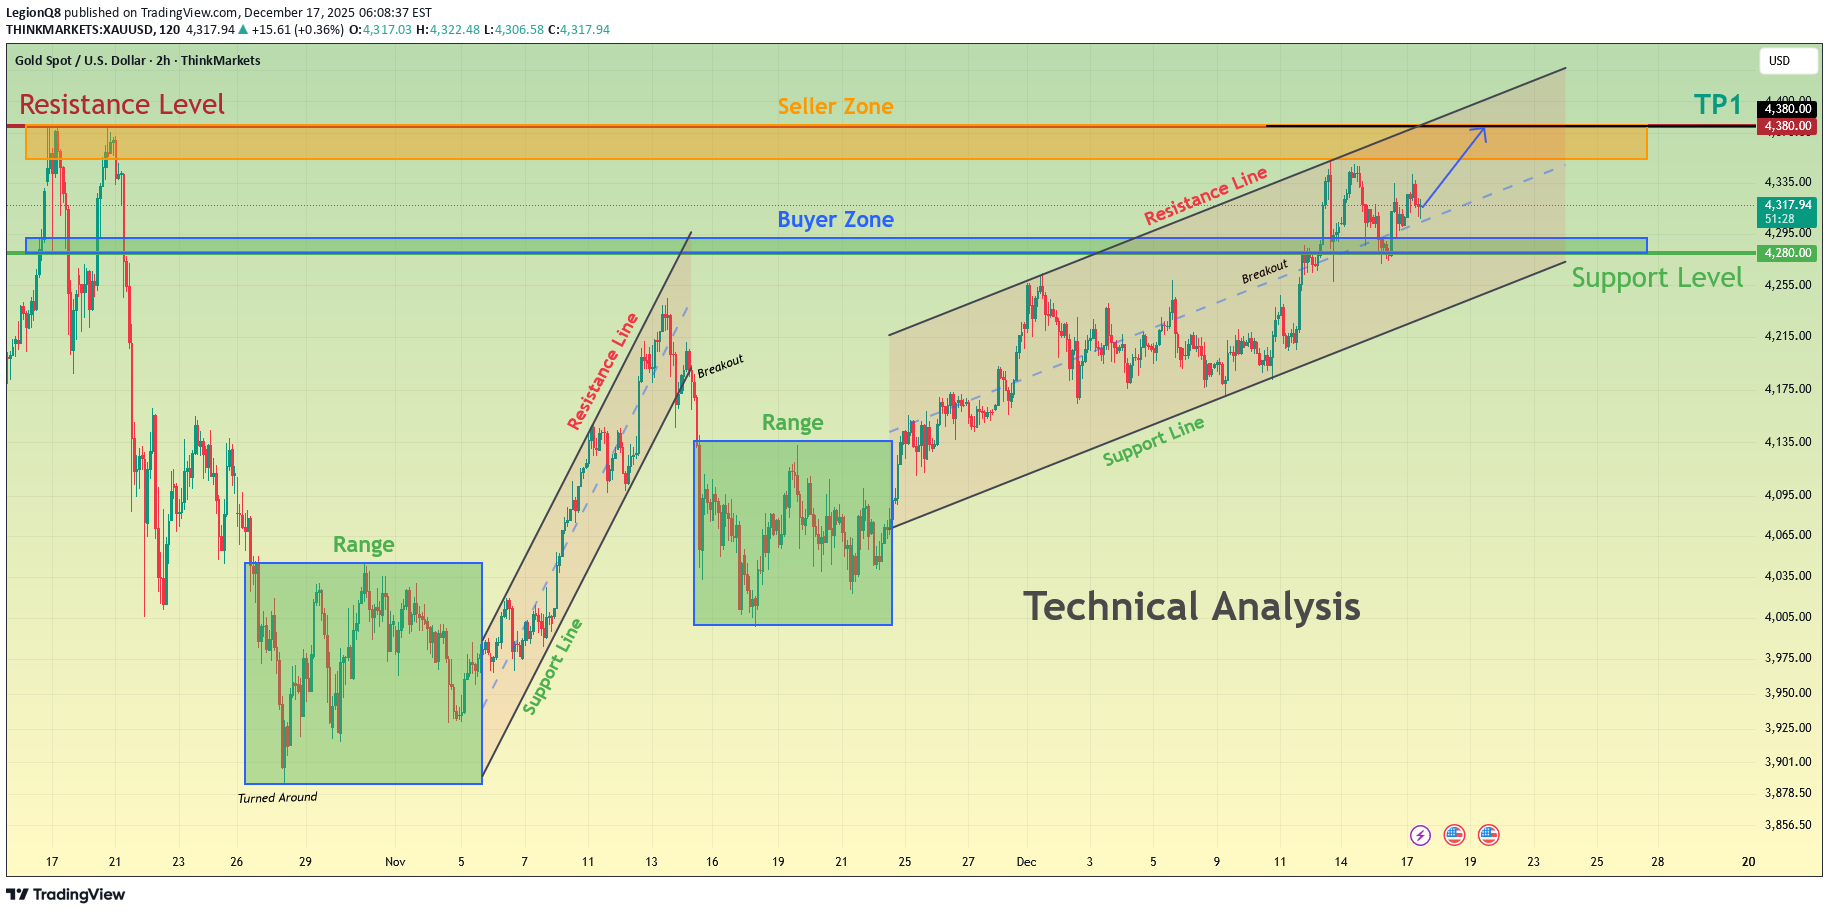
Hello traders! Here’s my technical outlook on XAUUSD (Gold) based on the current chart structure. After a corrective phase, Gold established a solid base and transitioned into a bullish recovery, forming higher lows and respecting the rising Support Line. The price previously moved through a consolidation Range, where accumulation took place before a clear breakout confirmed renewed buying momentum. Following this breakout, XAUUSD continued to trade within an ascending channel, showing a well-structured bullish trend. Recently, price pulled back into the Buyer Zone around 4,280, which aligns with the horizontal Support Level and the lower boundary of the rising structure. Buyers successfully defended this area, keeping the bullish structure intact. From this support, Gold has started to rebound and is now pressing higher toward the Seller Zone / Resistance Level near 4,380 (TP1) — a key supply area where sellers may attempt to slow the move. As long as XAUUSD holds above the 4,280 Support, the bullish scenario remains valid. I expect continued upside pressure toward the 4,380 Resistance (TP1). A clean breakout and acceptance above this seller zone would open the path for further bullish continuation. However, rejection from resistance could lead to a short-term consolidation or a healthy pullback back toward support. For now, the structure favors buyers, with 4,280 as key support and 4,380 as the main upside target. Always manage your risk and trade with confirmation. Please share this idea with your friends and click Boost 🚀At the moment, everything is going according to our scenario. The price is heading up along the middle line of the ascending channel.
LegionQ8
بیت کوین در مسیر صعود: حمایت مثلثی پابرجا، هدف بعدی ۸۸,۵۰۰ دلار!
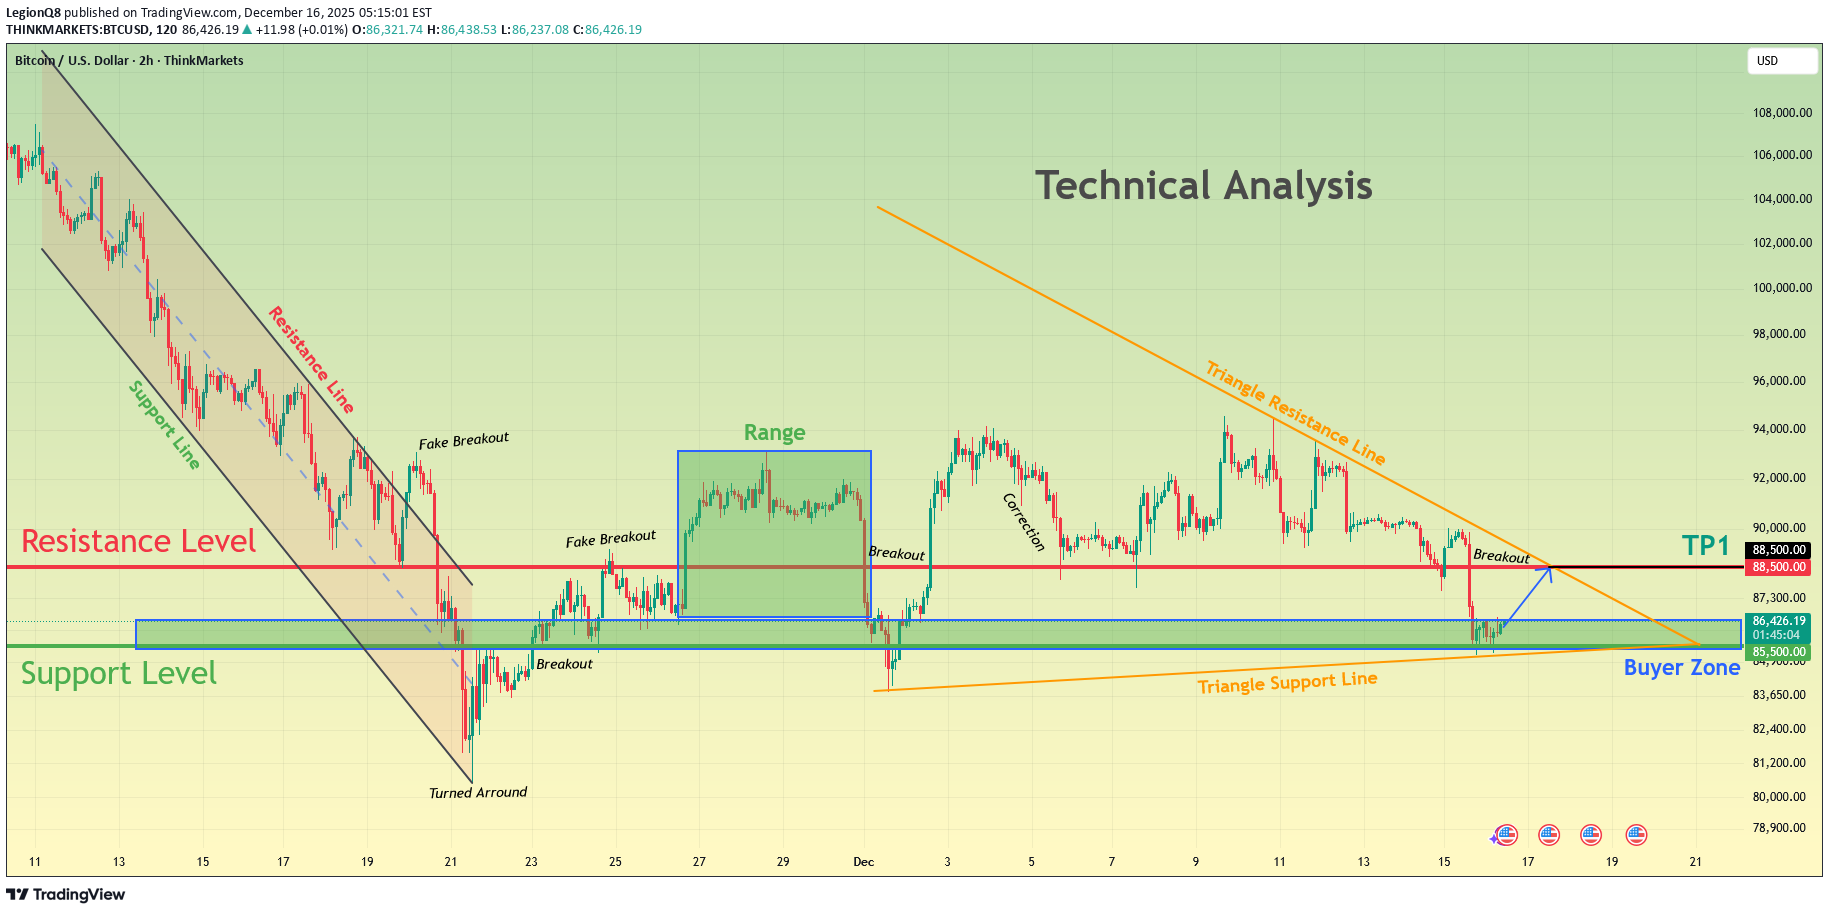
Hello traders! Here’s my technical outlook on BTC/USD based on the current chart structure. After a prolonged bearish move inside a downward channel, Bitcoin found a base near the lower boundary and reversed sharply, signaling seller exhaustion and a shift in momentum. This reversal was followed by a breakout above the descending resistance, confirming the end of the bearish phase. Price then entered a consolidation range, where accumulation took place before a confirmed breakout pushed BTC higher. Following the range breakout, the market formed a triangle structure, with price respecting the Triangle Support Line while facing pressure from the Triangle Resistance Line. Recently, BTC revisited the Buyer Zone around 86,300–85,500, which aligns with both horizontal support and the lower triangle boundary. Buyers stepped in at this level, defending the structure and keeping the recovery scenario intact. Currently, BTC is attempting a rebound from the Buyer Zone and is aiming toward the 88,500 Resistance Level (TP1). As long as price holds above the support zone, a move toward this resistance remains likely. A clean breakout above 88,500 would confirm further upside continuation, while rejection could lead to another consolidation or retest of support. For now, the structure favors buyers, with 86,300–85,500 as key support and 88,500 as the main upside target. Please share this idea with your friends and click Boost 🚀As we can see, Bitcoin is moving in the direction we need. Now there is a correction and we are waiting for the movement to our target.Today we see an unusual picture for Bitcoin, because the candle shadow is at $90K. Informal manipulation, in general, we reached our target.
LegionQ8
طلا (XAUUSD): حمایت حفظ شد! حمله نهایی به هدف 4,380؟
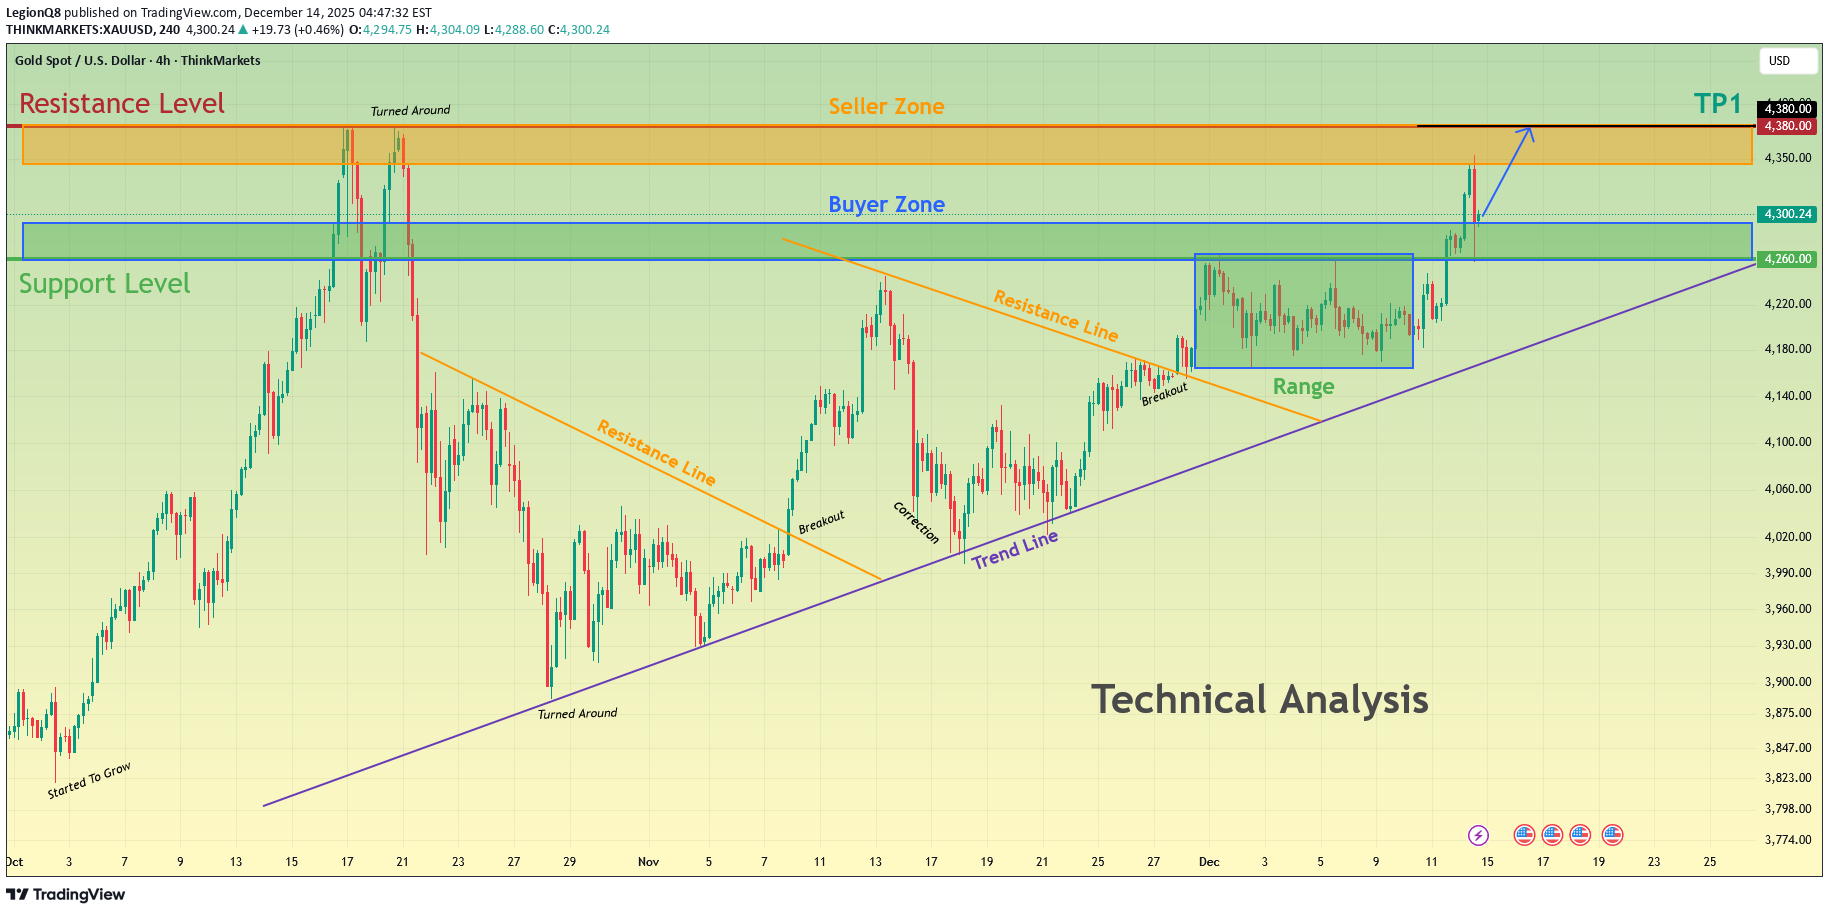
Hello traders! Here’s my technical outlook on XAUUSD based on the current market structure. Gold continues to trade within a well-established bullish trend, supported by a clear ascending Trend Line that has been respected after multiple pullbacks. After an earlier rejection from the upper Resistance Level, price experienced a corrective decline but successfully turned around near the trend line, confirming strong buyer interest at lower levels. Following this reaction, XAUUSD broke above the descending Resistance Line, signaling a shift in momentum back in favor of buyers. The market then entered a Range phase, where price consolidated between the Support Level around 4,260 and the Buyer Zone near 4,300, indicating accumulation and balance before the next impulse move. A confirmed breakout from the range occurred to the upside, with buyers aggressively pushing price above the Buyer Zone. Currently, gold is trading firmly above 4,300, showing sustained bullish strength and acceptance above previous resistance. The next key area of interest is the upper Seller Zone / Resistance Level around 4,380, which has acted as a strong reaction zone in the past. As long as price holds above the 4,260 Support Level and continues to respect the ascending trend line, the bullish scenario remains valid. My primary scenario is a continuation toward the 4,380 resistance, where a reaction or short-term rejection may occur. A clean breakout above this Seller Zone could open the door for further upside expansion, while rejection may lead to a healthy pullback toward the Buyer Zone or trend line support. For now, the structure clearly favors buyers, with 4,380 as the main upside target. Please share this idea with your friends and don’t forget to manage your risk 🚀So far everything is going according to plan. Gold has risen to retest the sellers' zone. We will monitor further actions.Sellers proved to be very strong at this stage and pushed the price back into the buyers' zone.
LegionQ8
BTCUSD Holds Buyer Zone - Push Toward 96,700 Likely
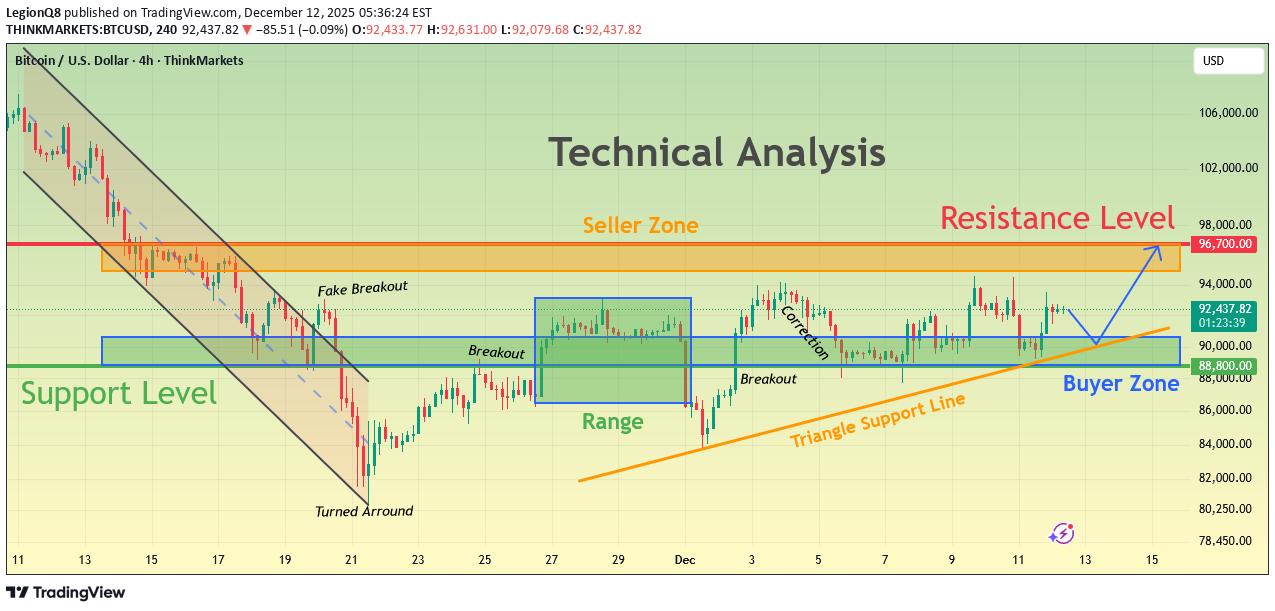
Hello traders! Here’s my technical outlook on BTC/USD based on the current market structure. After a prolonged decline, Bitcoin reversed from the Support Level and broke out of the downward channel, shifting momentum in favor of buyers. The price then moved into a consolidation Range, where accumulation formed before a confirmed Breakout pushed BTC higher. Since then, Bitcoin has been respecting the rising Triangle Support Line, forming higher highs and higher lows. Buyers consistently defend this structure, keeping the bullish trend intact despite local corrections. Currently, BTC is holding above the 90,500–88,800 Buyer Zone, which serves as the key demand area maintaining bullish pressure. As long as the price stays above this zone, the upward scenario remains valid. The market is now heading toward the major 96,700 Resistance Level, located inside the broader Seller Zone. A breakout above this level may open the door for further continuation, while rejection could trigger a pullback toward the Triangle Support Line. For now, the structure favors buyers, with 96,700 as the main upside target. Please share this idea with your friends and click Boost 🚀Bitcoin has turned negative and entered the consolidation phase again, we are waiting for further actions from market participants.As we can see, even in the upward movement, Bitcoin fell from the consolidation zone again to retest the support line.
LegionQ8
BTCUSD Buyers Defend Support — Market Targets $91,5K — $93K Zone
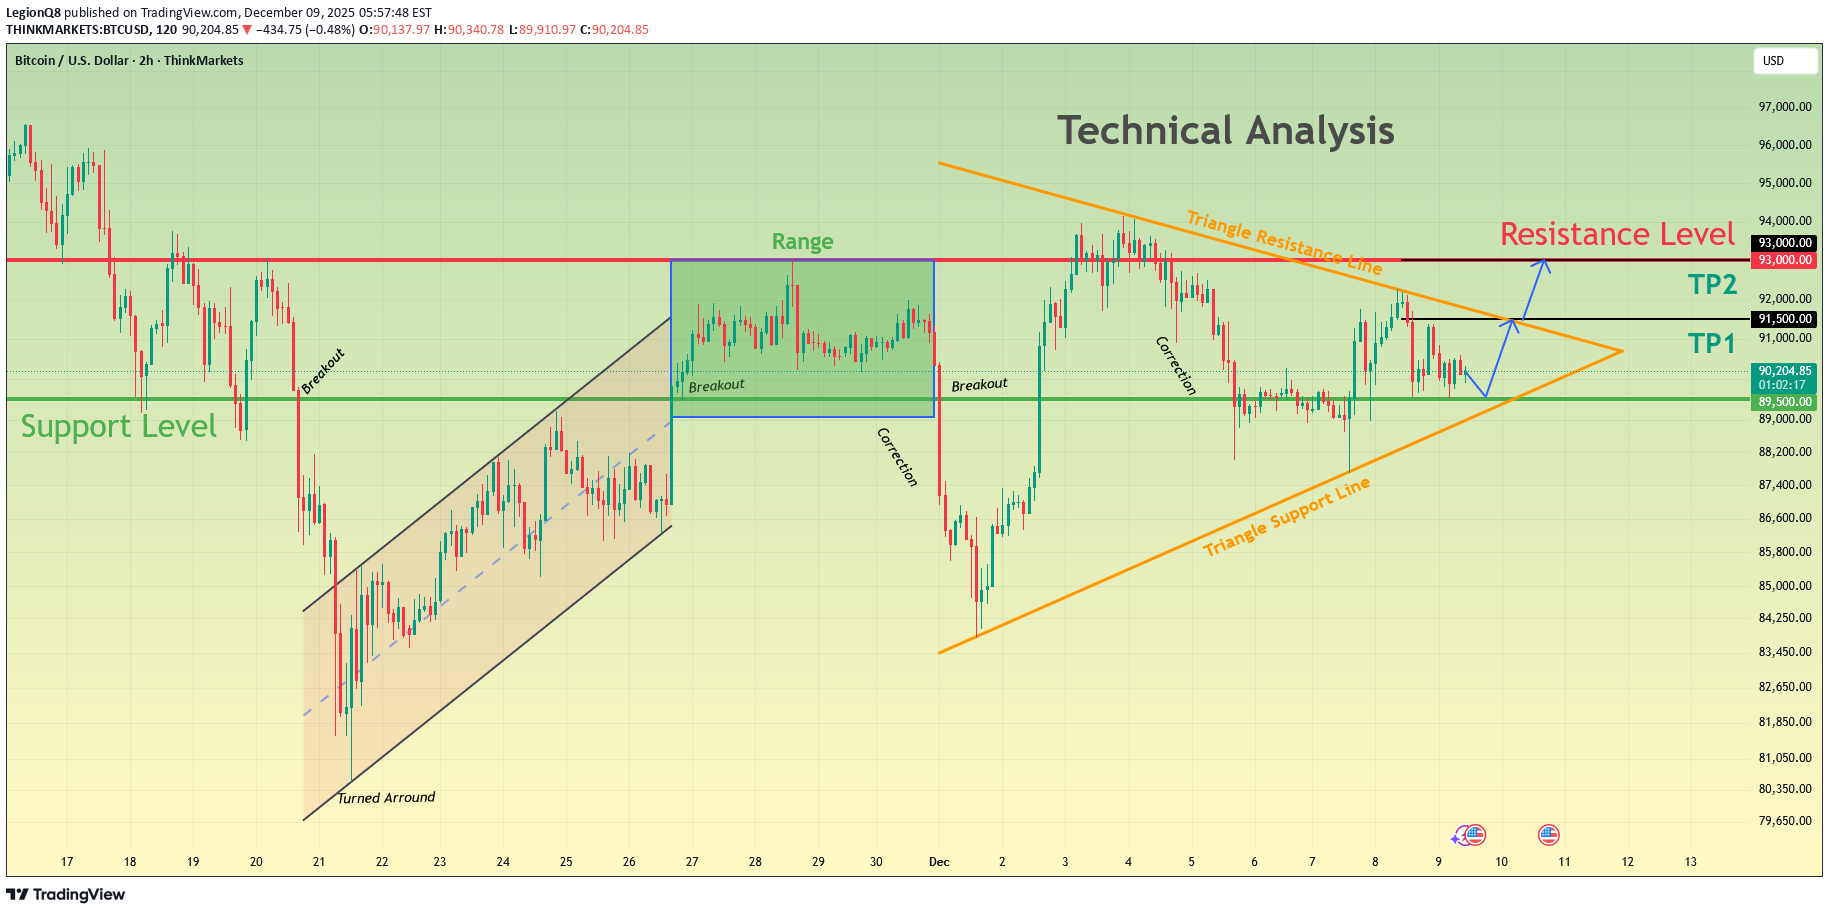
Hello traders! Here’s my technical outlook on BTC/USD based on the current market structure. After a strong bullish recovery from the lower demand area near $83,500–$85,000, the price formed a steady impulsive move upward and entered a consolidation phase inside the marked range below the key $93,000 resistance level. Multiple breakout attempts from the range were followed by corrective pullbacks, showing active participation from both buyers and sellers. Once BTC broke above the range, the price initiated another bullish leg but quickly transitioned into a symmetrical triangle structure, defined by the descending Triangle Resistance Line and the rising Triangle Support Line. Currently, BTC is compressing inside this triangle while holding above the critical $89,500 Support Level, which is acting as the main short-term demand zone. Buyers continue to defend this area, keeping the bullish bias technically valid. The price is now approaching the upper triangle resistance again, hinting at a possible volatility expansion. As long as BTC remains above $89,500, the bullish scenario stays in play. I expect a breakout from the triangle toward TP1 at $91,500, followed by a potential continuation toward TP2 at $93,000, which is the major resistance zone. However, a breakdown below the triangle support would invalidate the setup and may trigger a deeper corrective move. For now, the market remains in a compression phase, preparing for its next directional impulse. Please share this idea with your friends and click Boost 🚀To date, our analysis has been successful by 200%. We have achieved both the first target and the second. An incredible result.
LegionQ8
بیت کوین در سقف ساختار متوقف شد: آیا 95,500 دلار دوباره هدف گاوها خواهد بود؟
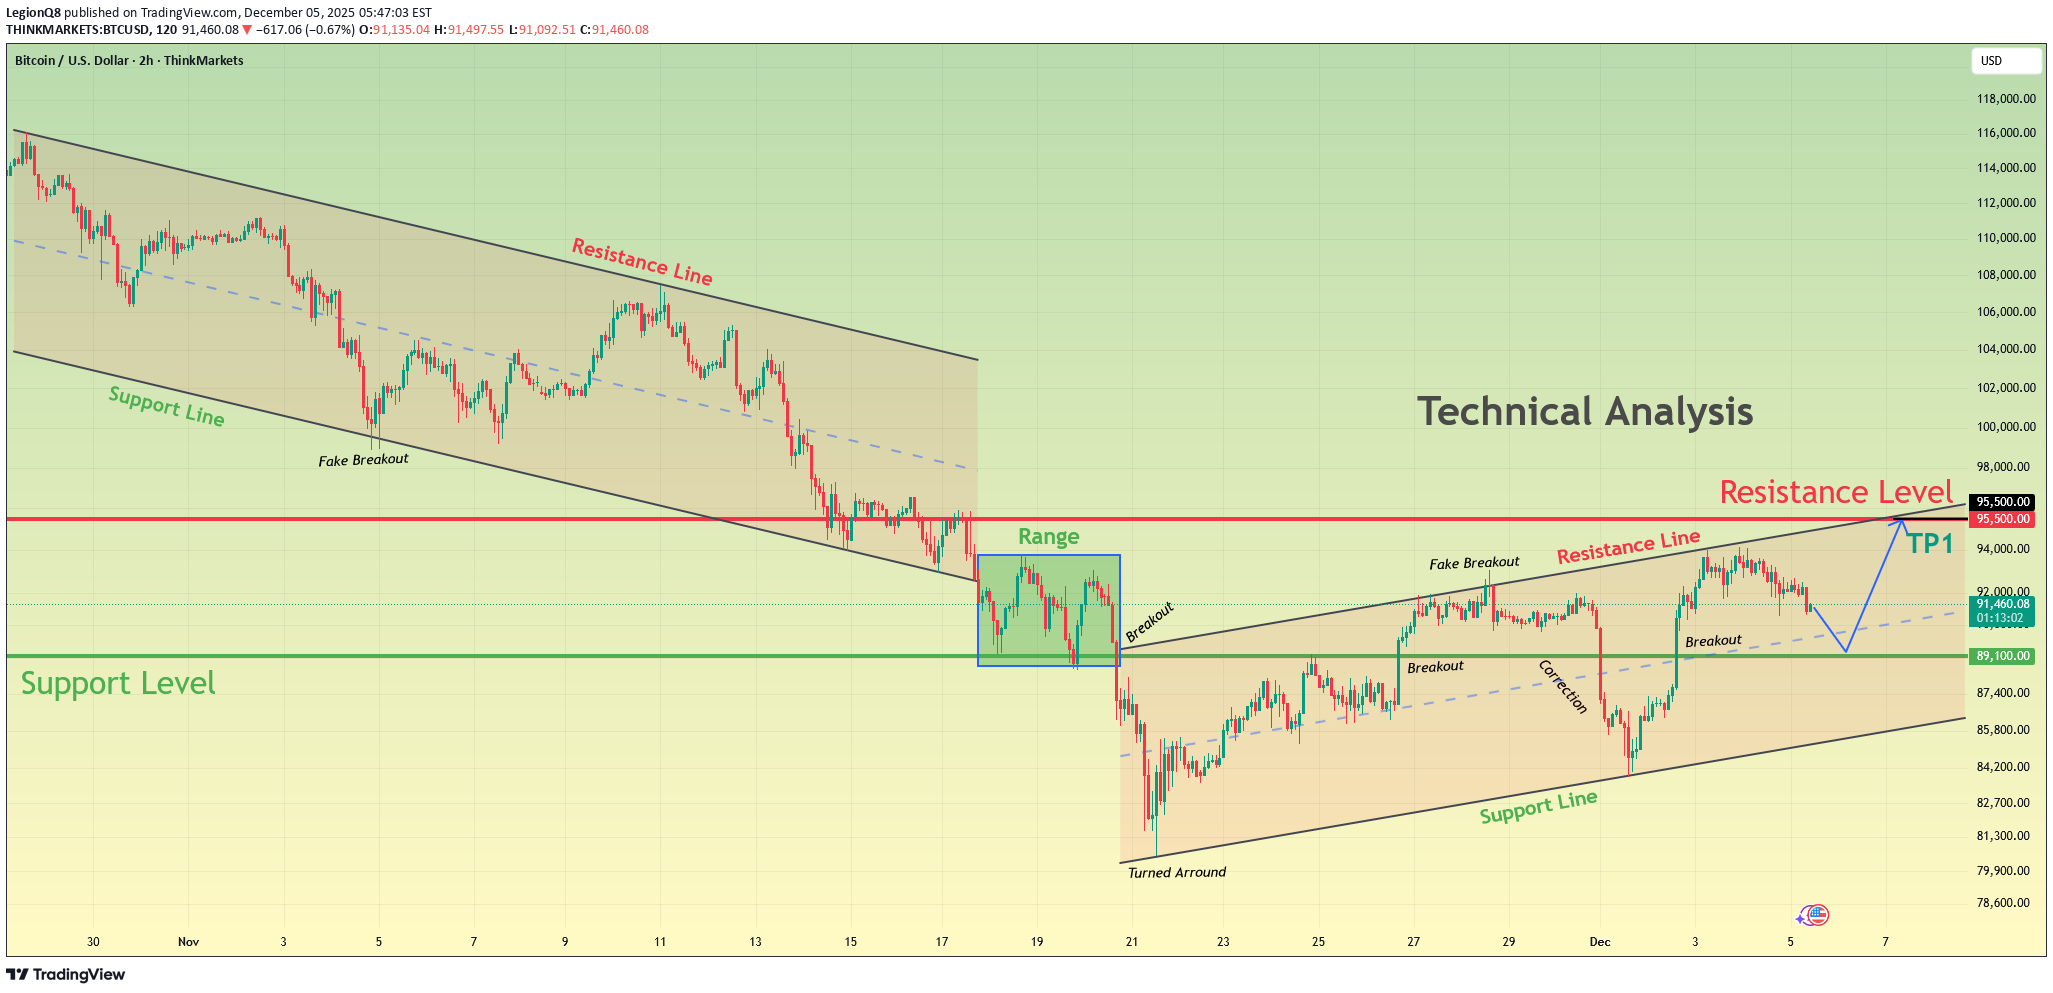
Hello traders! Here is my breakdown of the current BTCUSD setup. After a strong bearish phase, Bitcoin found support near the major Support Level around $89,100. Before reaching this zone, price was trading inside a broad descending channel, where both the Resistance Line and Support Line guided the downtrend. A fake breakout occurred near the lower boundary, showing early buyer interest, but overall momentum remained bearish until price reached the support. From there, BTC formed a clear sideways Range, signaling accumulation before a reversal attempt. Once buyers gained strength, price broke out of the range and shifted into a bullish structure. BTC began climbing within a rising wedge-like channel, respecting both the ascending Support Line and the diagonal Resistance Line. Along the way, the market formed multiple breakouts and fake breakouts, confirming active participation from both sides. However, buyers consistently defended the rising trendline, maintaining higher lows while approaching the key horizontal Resistance Level near $95,500. Currently, BTCUSD is pulling back slightly after touching the wedge resistance. As long as price holds above the ascending support and stays above $89,100, the bullish structure remains intact. My scenario suggests a potential continuation toward TP1 → $95,500 upon a successful rebound from the local support. If the market breaks below the rising structure, however, a deeper correction may unfold before any further upward attempt. For now, buyers are favored while the price remains inside the ascending channel. Please share this idea with your friends and click Boost 🚀At the moment, we see that the price has fallen to the support line as we expected and is in a consolidation phase before the next push.The current price came out of the consolidation phase and began to move upward as we began to recover. At this stage, the price only reached the middle of the output channel.
LegionQ8
بیت کوین در مرز نوسان: آیا خریداران از کف حمایت میکنند؟ هدف کوتاهمدت ۸۹,۲۰۰ دلار کجاست؟
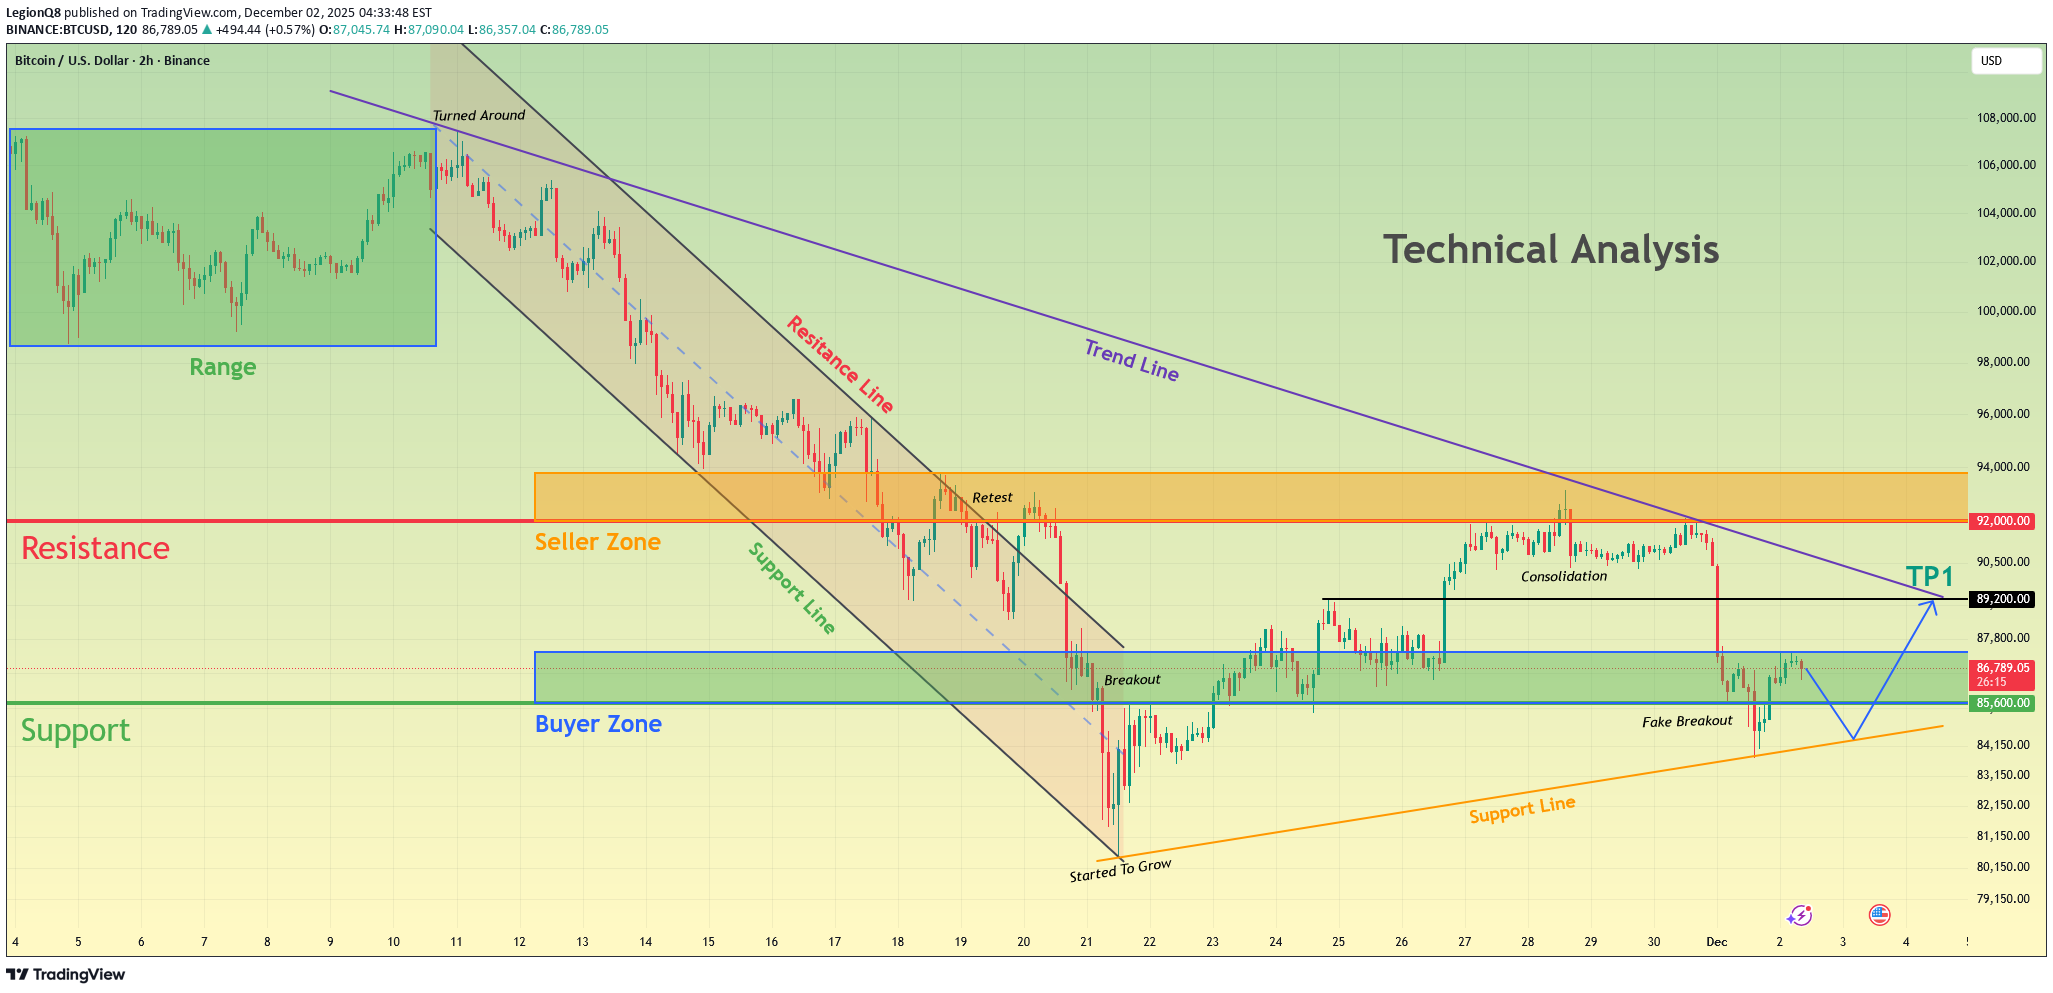
Hello traders! Here’s my technical outlook on BTC/USD based on the current market structure. After reaching the Seller Zone near $92,000, the price once again faced strong rejection, forming a clear reversal right under the descending Trend Line. This confirms that sellers continue to defend this area and keep Bitcoin within a broader corrective structure. From there, BTC pulled back toward the Buyer Zone around $86,000–$85,500, which has acted as a reliable support multiple times in the recent sessions. The market is now forming a potential short-term recovery after a fake breakout below this zone, highlighting attempts from buyers to regain control. However, as long as the price trades below the Seller Zone and the descending Trend Line, bearish pressure still dominates the chart. The structure suggests that Bitcoin may attempt a move toward TP1 at $89,200, where the market previously consolidated and faced resistance. A clean rejection from the Trend Line could send the price back toward support for another test, while a confirmed breakout above $92,000 would shift short-term sentiment and open the way for stronger bullish continuation. On the other hand, a breakdown below $85,500 could expose BTC to deeper declines toward lower support lines. Please share this idea with your friends and click Boost 🚀Today the market is very unpredictable. As we can see, the price, without bouncing from the support zone, flew up, reaching our target and went even higher, breaking through the main resistance level.
LegionQ8
کنترل در دست خریداران بیت کوین: آیا BTC به ۹۵,۷۰۰ دلار حمله میکند؟
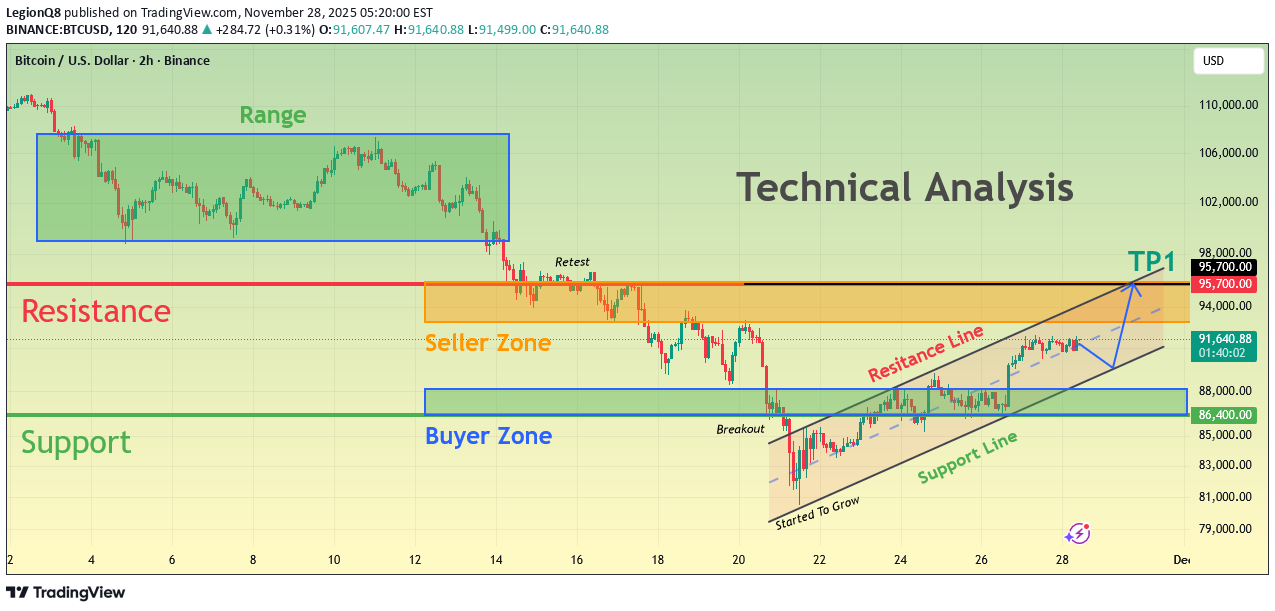
Hello traders! Here’s my technical outlook on BTC/USD based on the current market structure. After breaking out of the Buyer Zone near $86,400–$88,000, the price entered a sustained upward channel, forming higher highs and higher lows along the Support Line. However, BTC recently approached the Resistance Line inside the channel and showed signs of exhaustion, indicating that buyers are losing momentum as the price nears the local Seller Zone around $94,000–$95,700. The chart currently shows the market trading within a rising corrective structure, with bulls trying to hold the Support Line to maintain the short-term uptrend. As long as the price stays above the Buyer Zone and respects the channel’s Support Line, the bullish scenario remains valid. The structure suggests a potential pullback from Resistance toward the mid-channel area before buyers attempt another move upward. A continuation of this trend may push BTC/USD toward the TP1 target at $95,700, where the previous rejection occurred. A clean breakout above this level would open the door for stronger bullish expansion. However, a breakdown below the Support Line or a drop back into the Buyer Zone could weaken the trend and expose the price to deeper declines. Please share this idea with your friends and click Boost 🚀At this stage, the price exited the consolidation zone, making a slight rebound from the support line of the ascending channel.After a long consolidation, the price risked going down to retest the support line, which was not part of our plans!
LegionQ8
بیت کوین از ۸۵ هزار دلار جهش کرد: آیا رالی به سمت مقاومت ۹۳ هزار دلاری آغاز میشود؟
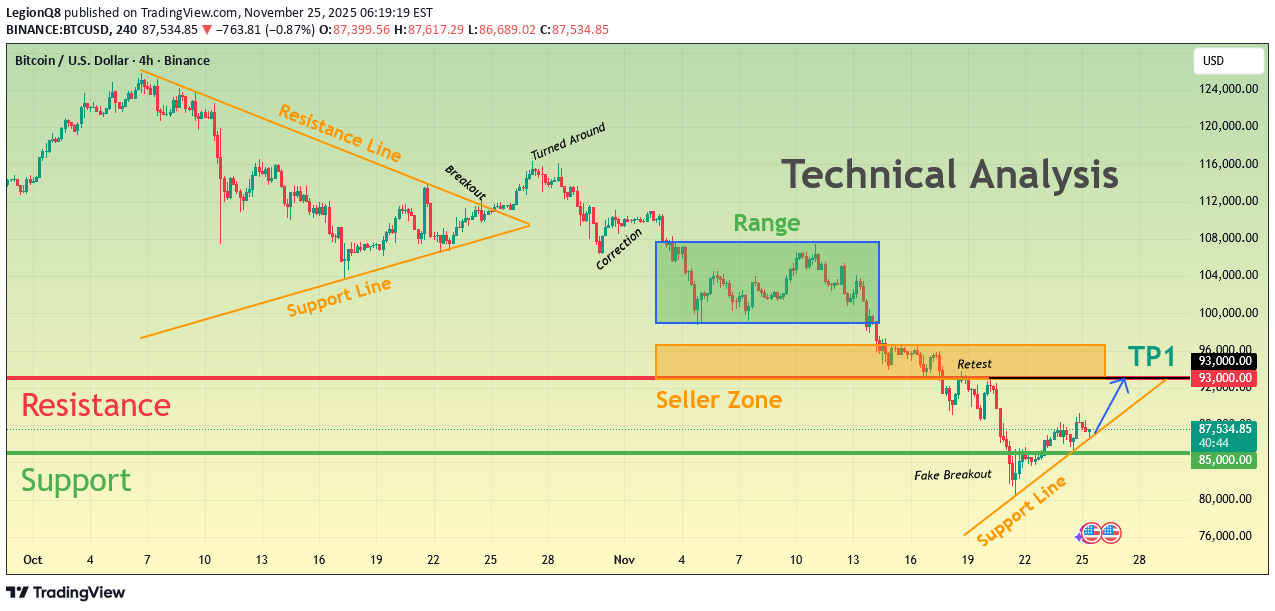
Hello traders! Let’s take a look at BTCUSD (Bitcoin). BTCUSD continues to trade within a broader corrective structure after a long bearish decline. Earlier, the market formed a large descending wedge, where price consistently respected both the Resistance Line and the Support Line. After the breakout from this wedge pattern, Bitcoin briefly turned bullish but soon entered a sideways Range, showing indecision and weakening momentum. The Range eventually broke to the downside, sending BTCUSD directly into the Seller Zone around $93,000, a key area that triggered several strong rejections in the past. A clean retest of this zone confirmed bearish pressure, leading to another impulsive drop. During the decline, price briefly pushed below the Support Zone near $85,000, creating a fake breakout, which trapped sellers and sparked a strong bullish reaction. From this point, buyers gained control and pushed price into a new ascending structure, supported by a rising Support Line shown on the chart. This indicates a shift in short-term momentum, with BTCUSD now forming higher highs and higher lows. Currently, Bitcoin is approaching the $93,000 Resistance Level, which aligns with the upper boundary of the previous Seller Zone. This is the key barrier for buyers. If price manages a clean breakout above this level, bullish continuation toward higher resistance zones becomes likely. As long as BTCUSD holds above the ascending Support Line and the $85,000 Support Area, the outlook remains bullish in the short term. From my perspective, BTCUSD is showing a short-term bullish continuation setup, supported by the ascending Support Line and the strong rejection from the $85,000 demand zone. If BTCUSD breaks back below $85,000, the bullish scenario becomes invalid, and a deeper correction could follow. For now, market structure supports a bullish recovery as long as buyers defend support and maintain the ascending trend. Please share this idea with your friends and click Boost 🚀So far, the price has entered the sideways zone and slightly broke the ascending support line. We will wait for further market action.After breaking the ascending support line, the price turned around and started to rise towards our target of $93K.
LegionQ8
حمایت بیت کوین در کانال نزولی: آیا هدف بعدی ۸۵ هزار دلار است؟
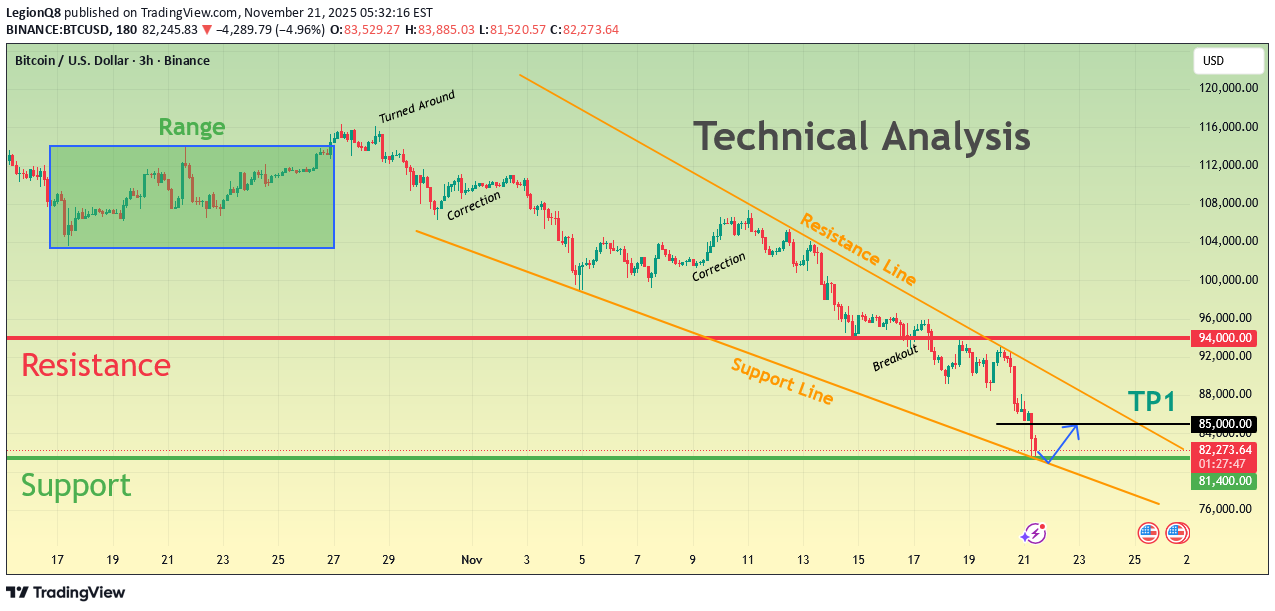
Hello traders! Let’s break down the current BTCUSD market structure. Bitcoin is trading inside a well-defined descending channel, forming consistent lower highs and lower lows. This structure confirms that the market is still moving within a broader bearish trend. Earlier, BTC created a large range phase on the left side of the chart, showing indecision before breaking down and starting the current downtrend. Each approach to the upper trendline (Resistance Line) resulted in a clear turnaround, proving that sellers continue to defend this zone aggressively. During the recent decline, BTC made multiple corrections inside the channel, but every upward move was short-lived and rejected by the descending resistance. A recent breakout attempt failed, and price quickly returned back into the channel, signaling that bullish momentum remains weak. Currently, Bitcoin is testing the Support Line of the descending channel near the $81,400–$82,000 zone. This level has acted as a key demand area within the trend. A short-term bounce from support is possible, and the chart shows a projected move toward TP1 near $85,000, which aligns with a minor internal resistance level. However, as long as BTC trades below the major Resistance Level around $94,000 and within the descending channel, the market maintains a bearish bias. Any bullish recovery is likely to be limited unless price can break above the channel and secure structure above $94,000. Please share this idea with your friends and click Boost 🚀Our analysis was based on the fact that there will be a rebound from the resistance line, which is what we are currently seeing in the market. Therefore, I congratulate everyone on achieving the target.
Disclaimer
Any content and materials included in Sahmeto's website and official communication channels are a compilation of personal opinions and analyses and are not binding. They do not constitute any recommendation for buying, selling, entering or exiting the stock market and cryptocurrency market. Also, all news and analyses included in the website and channels are merely republished information from official and unofficial domestic and foreign sources, and it is obvious that users of the said content are responsible for following up and ensuring the authenticity and accuracy of the materials. Therefore, while disclaiming responsibility, it is declared that the responsibility for any decision-making, action, and potential profit and loss in the capital market and cryptocurrency market lies with the trader.