
Learn_And_Earn_Trading
@t_Learn_And_Earn_Trading

What symbols does the trader recommend buying?
Purchase History
پیام های تریدر
Filter
Learn And Earn BTC/USD Analysis

Current Price Around $95,300Resistance Zone: Around $95,750Support Zone: Around $93,500Market Setup:Bitcoin has entered a strong resistance zone, marked as a selling area.Price has previously reversed from this area, suggesting sellers may step in again.The price may continue to decline towards the support level.Like our ideas Comments on our ideas.
Learn And Earn XAUUSD Setup

Support Zone: $3,270/$3265Resistance Zone: $3,310 and $3,360Gold is near a support level around $3,270. This is a key zone to watch for possible price reactions.Buy Setup:If price bounces from the support zone ($3,270/$3265), it may go up toward $3,310 or even $3,360.Sell Setup:If price breaks below the $3,270 support zone, it could fall further.like our ideascomments on our ideas
GOLD TECHNICAL ANALYSIS.

This chart shows a technical analysis of Gold (XAU/USD).The price was moving within an upward channel, indicating a bullish trend.The price repeatedly broke resistance levels, confirming the uptrend.Now The price reached a resistance zone, leading to a reversal.Here we can expect, the price will be move in downward direction. towards support 3115 / 3110.KEY LEVELSResistance near $3,148Support around $3,110Strong support at $3,080If you have any question on the setup, Drop in the comments.Support us by liking, sharing and following.
(XAU/USD) GOLD UPDATE

The market has been in an uptrend, moving within a parallel channel.There are multiple Breaks of Structure (BOS) indicating bullish momentum.The price has reached the upper resistance and is showing signs of rejection.A potential bearish move is expected towards the lower support area.The marked zone suggests a sell-off might occur after price breaks below the local support.If the price follows the projected move, it could decline towards the 3,107 - 3,108 zone before finding support. However, if it reclaims the resistance level, the uptrend may continue.Support us by liking,sharing and following.if you have any thoughts about analysis,drop in the comments.
GOLD (XAU/USD) ANALYSIS 26 MARCH 2025

Current Trend: Gold is moving within a range-bound structure between the support area (around $3,016 - $3,014) and the resistance area (around $3,032 - $3,036).Key Patterns: A W-shaped pattern has been observed, indicating multiple rejections from support and resistance levels.A breakout above resistance might push the price toward higher levels around $3,040+.A break below support could send gold towards the $3,000 level.Conclusion: Gold is currently ranging, and a breakout in either direction will decide the next major move. Traders should watch key support and resistance levels before entering trades.If you found this analysis helpful, don't forget to like and follow for more updates! Got any questions? Drop them in the comments below.
Gold (XAU/USD) Analysis – 30-Min Chart.

Initially, Gold price was following an upward trendline and making higher highs. A breakout occurred, shifting the momentum into a downtrend, confirmed by a downward trendline and lower highs.Key level:Resistance Area: The price reached a high and then reversed.Support Level: The price found support multiple times.Bullish Scenario: A breakout above the downward trendline could lead to a move towards the resistance area.Bearish Scenario: If the price fails to break resistance, it may retest the support or even the strong support level before bouncing back.A break above resistance could signal a strong buying opportunity.A drop to support levels may offer a buying opportunity on a bounce or a selling opportunity if support breaks.Guys, If you like the post, support me with like and follow. if you have any question about analysis drop a comment.
Bitcoin (BTC/USD) analysis Chart 1-hour timeframe

1. Uptrend in a Channel: Bitcoin is moving inside an ascending channel, indicating a bullish trend.2. Resistance Zone (88,000 - 89,000): The price might struggle to break this level and could reverse downward.3. Support Zone (86,500 - 87,000): This is where buyers might step in to push the price back up.4. Expected Movement: The price may rise toward the resistance, face rejection, and then drop toward the support zone. If support breaks, a further drop could happen.However, if Bitcoin gains strong bullish momentum, it could break above resistance and move even higher. Always wait for confirmation before making trading decisions.support us by liking, following and sharing.
Gold (XAU/USD) 1-hour time frame chart analysis.

Go through the analysis carefully.1. Resistance and Support Zones:The chart highlights key resistance and support zones.The price has reacted multiple times to these levels.2. Downtrend Line:A downward trendline is present, acting as resistance.Price has tested this trendline multiple times and failed to break above it.3. Current Price Action:The price is approaching a resistance zone near $3,028.If it fails to break above, a downward move is expected towards the support zone around $3,010-$3,015.If it breaks above, it may target higher resistance levels around $3,044 or above.4. Expected Movement:The chart suggests a possible rejection from the resistance zone, leading to a bearish move.Alternatively, a breakout above resistance could lead to a bullish move.what are your thoughts about my analysis?support us by liking, following and sharing the post.
Gold Price Analysis (XAU/USD) – 25 March 2025

Trend Overview: Gold is currently trading within a downward channel after a strong bullish trend.Key Levels:Resistance: Around 3,040Support Zones: 3,000 and 2,980Market Structure:The price has formed lower highs, confirming a bearish channel.A break above resistance may push the price towards 3,040+.If the price stays below the support zone (3,000), further downside toward 2,980 is possible.Trading Strategy:Bullish Scenario: Break above the channel resistance may lead to a reversal.Bearish Scenario: If rejection occurs at the current resistance, gold may continue its downtrend.Trade wisely and manage risk!What are your thought? Let me know in the comments.Support me with likes and follow.
GOLD PRICE ANALYSIS TODAY-TREND SHIFT AND KEY LEVELS
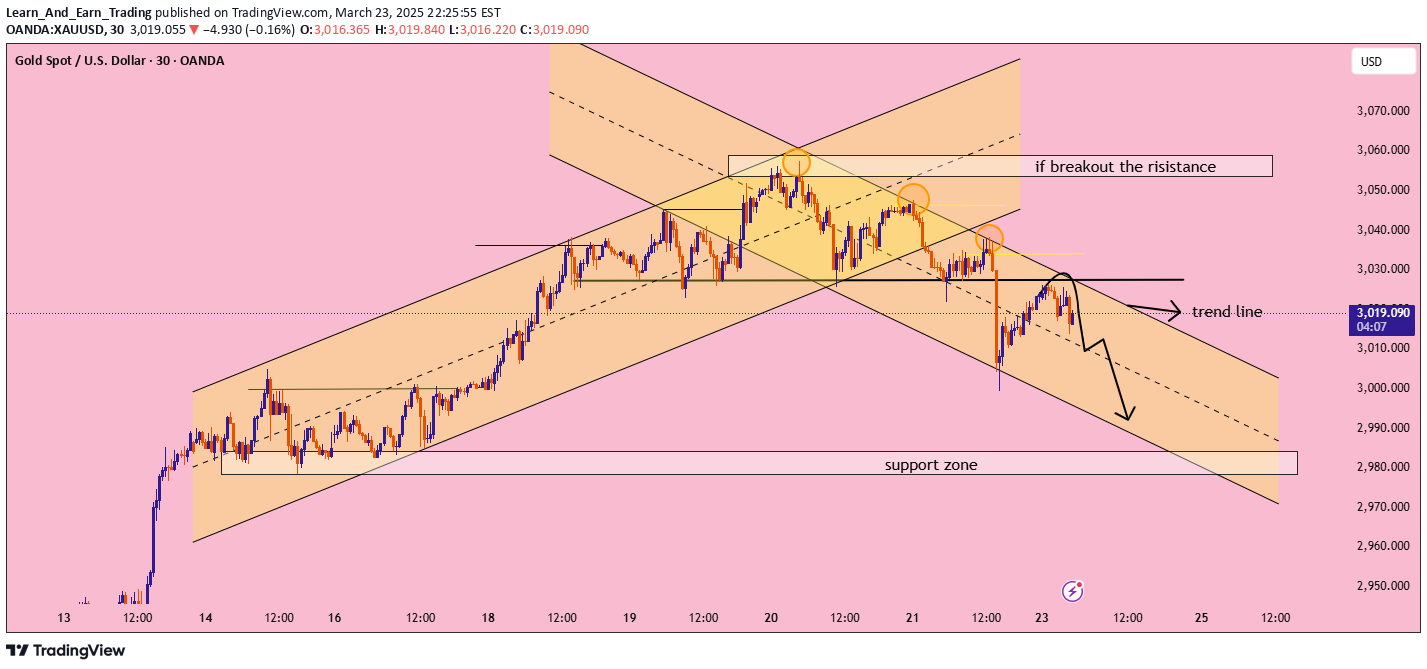
Gold was moving in an upward channel but recently broke the trend line, indicating a potential bearish move. The price tested resistance multiple times but failed to break above. Now, it is moving downward toward the support zone (around 2,980).If the support holds, we might see a bounce.If the price breaks below, further downside movement is expected.Key Levels:✅ Resistance: 3,040 - 3,060✅ Support: 2,980What are your thoughts? Let me know in the comments.Suport me with follow and likes.
Disclaimer
Any content and materials included in Sahmeto's website and official communication channels are a compilation of personal opinions and analyses and are not binding. They do not constitute any recommendation for buying, selling, entering or exiting the stock market and cryptocurrency market. Also, all news and analyses included in the website and channels are merely republished information from official and unofficial domestic and foreign sources, and it is obvious that users of the said content are responsible for following up and ensuring the authenticity and accuracy of the materials. Therefore, while disclaiming responsibility, it is declared that the responsibility for any decision-making, action, and potential profit and loss in the capital market and cryptocurrency market lies with the trader.