
Le-Loup-de-Zurich
@t_Le-Loup-de-Zurich

What symbols does the trader recommend buying?
Purchase History
پیام های تریدر
Filter
Le-Loup-de-Zurich
Alım Satımlarda Düşen Kama'nın Gerçek Başarı Oranları

Alım Satımlarda Düşen Kama'nın Gerçek Başarı OranlarıDüşen kama, düşüş veya konsolidasyon evresinden sonra yükseliş dönüşleri potansiyeli nedeniyle yatırımcılar tarafından oldukça değer verilen bir grafik desenidir. Etkinliği çeşitli teknik analistler ve önde gelen yazarlar tarafından kapsamlı bir şekilde incelenmiş ve belgelenmiştir.Temel İstatistiklerBoğa Çıkışı: Vakaların %82'sinde, düşen kamadan çıkış yukarı yönlüdür ve bu da onu olumlu bir dönüşü tahmin etmek için en güvenilir desenlerden biri yapar.Fiyat Hedefine Ulaşıldı: Desenin teorik hedefi (kırılma noktasında kamanın yüksekliğinin çizilmesiyle hesaplanır) kaynağa bağlı olarak yaklaşık %63 ila %88 oranında elde edilir ve kar alma için yüksek bir başarı oranı gösterir.Trend Tersine Dönüşü: Vakaların %55 ila %68'inde, düşen kama bir geri dönüş deseni olarak hareket eder ve bir düşüş trendinin sonunu ve yeni bir yükseliş evresinin başlangıcını işaret eder.Geri çekilme: Kopuştan sonra, geri çekilme (direnç çizgisine dönüş) vakaların yaklaşık %53 ila %56'sında gerçekleşir ve bu ikinci bir giriş fırsatı sağlayabilir ancak desenin genel performansını düşürme eğilimindedir.Yanlış Kopuşlar: Yanlış çıkışlar vakaların %10 ila %27'sini temsil eder. Ancak, yanlış bir boğa kopuşu vakaların yalnızca %3'ünde gerçek bir ayı kopuşuyla sonuçlanır ve boğa sinyalini özellikle sağlam hale getirir.Performans ve BağlamBoğa Piyasası: Desen, bir yükseliş trendinin düzeltici fazında ortaya çıktığında özellikle iyi performans gösterir ve üç ay içinde vakaların %70'inde bir kar hedefine ulaşılır.Kazanç Potansiyeli: Hisse senedi piyasaları üzerine yapılan istatistiksel çalışmalara göre, boğa kopuşu sırasında maksimum kazanç potansiyeli vakaların yarısında %32'ye ulaşabilir.Oluşum Zamanı: Kama ne kadar geniş ve trend çizgileri ne kadar dik olursa, kopuş sonrası yukarı hareket o kadar hızlı ve şiddetli olur.Başarı Oranlarının Karşılaştırmalı Özeti:Kriter Oran ................................................Gözlemlenen FrekansBoğa Çıkışı ..............................................................%82Fiyat Hedefine Ulaşıldı ............................................%63 ila %88Ters Dönüş Deseni ..................................................%55 ila %68Çıkıştan Sonra Geri Çekilme ......................................%53 ila %56Yanlış Çıkışlar (Yanlış Çıkışlar) ....................................%10 ila %27Aşağı Yönelik Boğa Yanlış Çıkışları ..................................%3Dikkat NoktalarıDüşen kama, doğru bir şekilde tanımlanması zor ve nadir bir desendir ve geçerli olması için en az beş temas noktası gerekir.Performans, çıkış desenin uzunluğunun yaklaşık %60'ında gerçekleştiğinde ve çıkış anında hacim arttığında en iyisidir.Geri çekilmeler, sık görülmelerine rağmen, başlangıçtaki boğa momentumunu zayıflatma eğilimindedir.SonuçDüşen kama, 10 vakadan 8'inden fazlasının boğa çıkışıyla sonuçlanması ve vakaların çoğunda bir fiyat hedefine ulaşılmasıyla dikkat çekici bir başarı oranına sahiptir. Ancak, diğer teknik sinyallerle (hacim, momentum) deseni doğrulamak ve oranları nispeten düşük olsa bile yanlış kırılmalara karşı dikkatli olmak esastır. Bu desen ustalaşıldığında, boğa dönüşlerinde optimize edilmiş giriş noktaları arayan yatırımcılar için değerli bir araç olduğu kanıtlanmıştır.
Le-Loup-de-Zurich
Real Success Rates of the Falling Wedge in Trading

Real Success Rates of the Falling Wedge in TradingThe falling wedge is a chart pattern highly valued by traders for its potential for bullish reversals after a bearish or consolidation phase. Its effectiveness has been extensively studied and documented by various technical analysts and leading authors.Key StatisticsBullish Exit: In 82% of cases, the exit from the falling wedge is upward, making it one of the most reliable patterns for anticipating a positive reversal.Price Target Achieved: The pattern's theoretical target (calculated by plotting the height of the wedge at the breakout point) is achieved in approximately 63% to 88% of cases, depending on the source, demonstrating a high success rate for profit-taking.Trend Reversal: In 55% to 68% of cases, the falling wedge acts as a reversal pattern, signaling the end of a downtrend and the beginning of a new bullish phase.Pullback: After the breakout, a pullback (return to the resistance line) occurs in approximately 53% to 56% of cases, which can provide a second entry opportunity but tends to reduce the pattern's overall performance.False Breakouts: False exits represent between 10% and 27% of cases. However, a false bullish breakout only results in a true bearish breakout in 3% of cases, making the bullish signal particularly robust.Performance and ContextBull Market: The pattern performs particularly well when it appears during a corrective phase of an uptrend, with a profit target reached in 70% of cases within three months.Gain Potential: The maximum gain potential can reach 32% in half of cases during a bullish breakout, according to statistical studies on equity markets.Formation Time: The wider the wedge and the steeper the trend lines, the faster and more violent the post-breakout upward movement will be.Comparative Summary of Success Rates:Criteria Rate Observed FrequencyBullish Exit 82%Price Target Achieved 63% to 88%Reversal Pattern 55% to 68%Pullback After Breakout 53% to 56%False Breakouts (False Exits) 10% to 27%Bullish False Breakouts Leading to a Downside 3%Points of AttentionThe falling wedge is a rare and difficult pattern to correctly identify, requiring at least five contact points to be valid.Performance is best when the breakout occurs around 60% of the pattern's length and when volume increases at the time of the breakout.Pullbacks, although frequent, tend to weaken the initial bullish momentum.ConclusionThe falling wedge has a remarkable success rate, with more than 8 out of 10 cases resulting in a bullish exit and a price target being reached in the majority of cases. However, it remains essential to validate the pattern with other technical signals (volume, momentum) and to remain vigilant against false breakouts, even if their rate is relatively low. When mastered, this pattern proves to be a valuable tool for traders looking for optimized entry points on bullish reversals.
Le-Loup-de-Zurich
TONCOIN: Olası "Baş-Omuzlar" inşa ediliyor mu?!

TONCOIN: Possible "heads" are it being built? After the arrest of Pavel Durov, CEO of the "Telegram Messenger" company, this news can sharpen the downward movement! Be careful !!
Le-Loup-de-Zurich
GOLD: Bearish: WOLFE Wave detected + Divergences

GOLD: Bearish: WOLFE Wave detected + DivergencesThe Wolf of Zurich has detected a Wolfe Wave on the XAUUSD.The price could reach 242 then 2291In addition, there are two divergences with the price: The ROC Rate of Change and the RSI.To watch the exponential moving averages 50 and 20, as well as the Fibonacci levelsWe have reached the price of 2520 that I will indicateThe maximum can be 3000. So be careful!!
Le-Loup-de-Zurich
BTC : Simetrik üçgen!
Symmetrical triangle! The price is expected to break the triangle within 3-4 days! In addition to Fibonacci and Ichımoku levels, the volatility that can explode at any time will be watched! Be careful!
Le-Loup-de-Zurich
BTC : Simetrik üçgen!

Simetrik üçgen!Fiyatın 3-4 gün içinde üçgeni kırması bekleniyor!Fibonacci ve ICHIMOKU seviyelerinin yanı sıra her an patlayabilecek volatilite de izlenecek!dikkat olmak !
Le-Loup-de-Zurich
DOGECOIN: artan takoz + R.O.C Diverjansı

DOGECOIN: artan takoz + R.O.C Diverjansı Zürih Kurdu, yükselen bir kama + R.O.C = Değişim Oranı üzerinde güzel bir sapma tespit etti; bu, temelin Momentumundaki değişimi gösterir. 50 ve 200 üstel hareketli ortalamalarını izlemek için Fibonacci ve ICHIMOKU seviyeleri Zürih'in kurdu
Le-Loup-de-Zurich
DOGECOIN: Rising wedge + R.O.C Divergence

DOGECOIN: Rising wedge + R.O.C Divergence The Wolf of Zurich has detected an ascending wedge + A nice divergence on the R.O.C = Rate Of Change, which indicates the variation of the Momentum of the underlying. To watch the 50 and 200 exponential moving averages The Fibonacci and ICHIMOKU levels
Le-Loup-de-Zurich
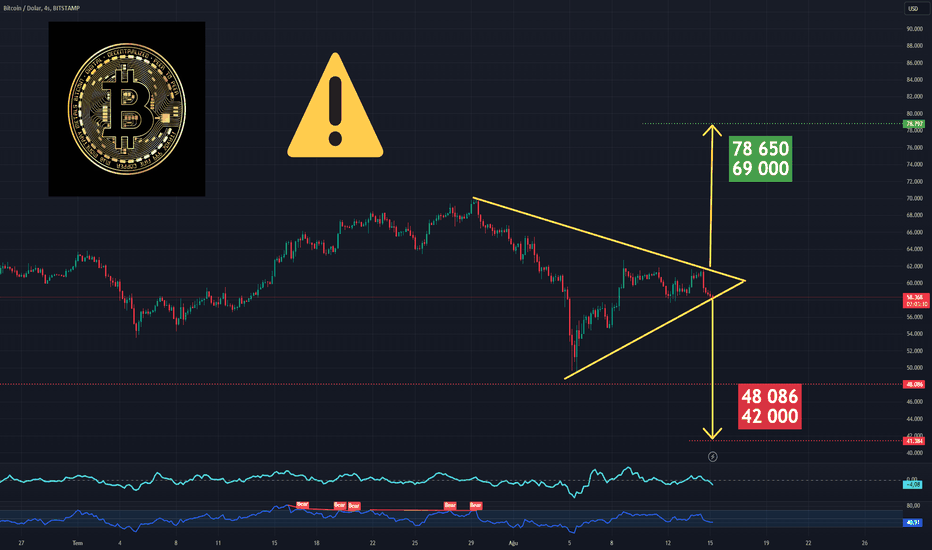
BITCOIN: Çift tepe mümkün: 48 000 + NAVARRO 2000 yükseliş

BITCOIN: Çift tepe mümkün: 48 000 + NAVARRO 2000 yükseliş = 2 karşıt rakama dikkat edin. Zürih Kurdu Bitcoin'de olası bir çift zirve tespit etti Beklendiği gibi, yaptığım analizler sayesinde 56 400'e mükemmel bir şekilde ulaşıldı. Sonraki seviyeler şunlardır: Düşüşte: 56 425 (tekrar) 48 000 40 770 Yükselişte: NAVAROO 200 yükselişi tespit edildi ve fiyat 72.000 $'a, ardından 80.000 $'a ulaşabilir Ayrıca dikkatli olun çünkü ROC ile yükseliş yönünde bir uyumsuzluk var!! EMA 50 ve 200 ile ICHIMOKU ve Fibonacci seviyelerini izlemek için
Le-Loup-de-Zurich
BITCOIN: Double top possible + NAVARRO 200 bullish : Watch out!!

BITCOIN: Double top possible: Watch out for 48,000 + NAVARRO 2000 bullish = 2 opposing patterns.The Wolf of Zurich detected a possible double top on bitcoinAs expected, the 56,400 was reached perfectly thanks to my analysis.The next levels are:On the decline :56,425 (again)48,00040,770On the rise:NAVAROO 200 bullish detected, and the price could reach $72,000 then $80,000In addition, Be careful because there is a bullish divergence with the ROC!!To watch the EMA 50 and 200, and the ICHIMOKU and Fibonacci levels
Disclaimer
Any content and materials included in Sahmeto's website and official communication channels are a compilation of personal opinions and analyses and are not binding. They do not constitute any recommendation for buying, selling, entering or exiting the stock market and cryptocurrency market. Also, all news and analyses included in the website and channels are merely republished information from official and unofficial domestic and foreign sources, and it is obvious that users of the said content are responsible for following up and ensuring the authenticity and accuracy of the materials. Therefore, while disclaiming responsibility, it is declared that the responsibility for any decision-making, action, and potential profit and loss in the capital market and cryptocurrency market lies with the trader.