Laurentsius
@t_Laurentsius
What symbols does the trader recommend buying?
Purchase History
پیام های تریدر
Filter
Signal Type

Laurentsius

Hi! If you are even little bit interested in Crypto then you probably have noticed all the buzz and excitement around MEME token launch (especially in Crypto Twitter, now X). Looks like they are stealing all the spotlight with their upcoming Binance listing which should happen tomorrow( Nov 3rd). Company behind that token is Memeland, which was founded in June 2022 (same team who started 9GAG back in 2008). Memeland is an independent web3 venture studio. They are really good at marketing and the way how they launched their marketing campaign could be a great case study about creative marketing. But let’s rewind time back to the end of September and see how I approached to that event. And maybe more importantly why? I knew Memeland project way before that – they have quite popular NFT collections. They belong into top 10 NFT projects. I also knew that at some point they will launch their token. At the end of September Memeland’s CEO confirmed in Twitter spaces that token will be launched in October. As I’m not new to Crypto, I knew that there are always a lot of delays with everything related to Crypto. This time my gut told me they are going to do it within that timeframe. So it might be a good idea to buy their NFTs. Because holding those NFTs are basically only way to participate in token pre-sale and every NFT will get an airdrop of MEME tokens. Information about NFTs: • 25% of the total token supply will go to NFT holders. • 20% unlocked at TGE (Token Generation Event) • 80 % locked in NFTs with non-linear unlock I bought some of their NFTs before marketing campaign and my entry timing was quite good. I’d say there was a window of opportunity. Since that value of those NFTs has increased significantly from my entry point and I have already participated in token pre-sale. By selling now I would be in instant profit but that’s not the plan. These NFTs will hold 80% of the tokens so it would be interesting to see the price action of these assets after 1st part of airdrop. Why I decided to participate in MEME pre-sale? So far I have never traded meme coins, it’s not my thing. On the other hand, I’m open-minded and ready for new challenges. This time I decided differently and here's some of the reasons: 1) Financial interest – As a trader I see an opportunity here. I think this token's launch will have a lot of buzz around it. People are tired of long bear market (2 years) where basically nothing happens. This event will create a lot of excitement for crypto community (and remind good old days to some Crypto OGs). 2) Timing – Crypto bear market, nothing happens, no excitement. Market sentiment is low (although it has been improving lately). On the other hand all eyes are on their token launch. Would like to see how this plays out, especially in current market cycle. 3) Token symbol MEME - can you think a better name for a meme coin. 4) Trading education – I’ll probably learn a lot about markets with this launch, no matter what’s the outcome. Now let’s move to the trading plan My thesis is that this token can have its momentum and will fly for some time. In other words, odds are good for price increase. Of course I could be wrong but that’s the way how I’m evaluating that event. At launch I have: • 20% of my NFT airdrop unlocked (80% locked) • 25% of my pre-sale allocation unlocked (75% locked) My plan is to liquidate all my unlocked tokens within first few weeks. If the price is going where I anticipate, it would be wise to lock in some profit. This doesn’t mean this token could not have its value in the future. MEME will play important role in their ecosystem. My trading plan is simple 😊: • Watch price action and make adjustments to my plan if necessary • Scale-out from my position i.e. sell with blocks at different price levels • Market cap - I have created a table with calculations of different prices and market caps so this will help me to set scale-out levels. • Compare it with other popular meme coins • Most recent example is PEPE Thank you and don’t forget to enjoy your trading! Cheers

Laurentsius

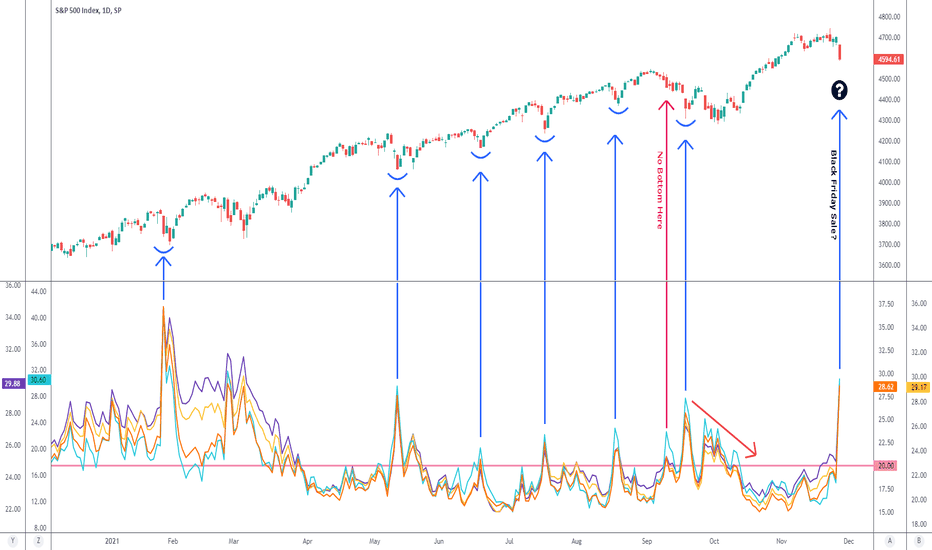
Hi and happy Monday to everyone :) This educational post is about VIX and I will present one way how to use it for trying to catch bottoms. Let's start with little introduction: What is VIX? The VIX is an index run by the Chicago Board Options Exchange ( CBOE ), that measures the stock market’s expectation for volatility over the next 30 days based on option prices for the S&P 500 . Volatility is a statistical measure based on how much an asset’s price moves in either direction and is often used to measure the riskiness of an asset. VIX is often called 'fear index' because investors use the VIX to measure the level of risk, fear, or stress in the market when making investment decisions. The higher the VIX goes, the more volatile price movements are expected. Most traders know about VIX and there are many ways how to use it. But in addition to so called regular VIX (30 days), CBOE also calculates VIX for different time-periods: 9-day, 3-month and 6-month. These are all plotted below S&P 500 index on chart above. I got this idea several years ago from well known trader and author Alexander Elder. Logic behind plotting these 4 different VIX indicators is pretty simple. Usually, the longer the timeframe, the higher the VIX . This is like buying insurance - more things can happen in longer timeframe so 6-month insurance is more expensive than 9-day insurance . Same goes with VIX . During panic sometimes shortest (9-day) VIX shoots above longer timeframe indicators (1-month, 3-month and 6-month). Then things will become interesting. If this happens then it is not sustainable (for long periods) and market bottom could be near. At chart above I have highlighted all recent occasions when shortest VIX (9-day) is above all the rest. I have excluded signals that have happened below 20 because usually VIX below 20 is normal level. But as always, it can vary and depends from market context. This indicator has had tendency to catch at least short-term market bottoms and there are many ways how to use it. Here are some examples: 1) Buy when shortest timeframe VIX (9-days) rises above others and then returns down again. 2) Add Keltner Channels or Bollinger Bands around them - signals could be lines breaking out of channels and then re-entering for example. 3) Combine VIX signal with some price action setups. Or something else - trading is a little bit like art where you can be creative! Please keep in mind that I have not back-tested this idea. In my own trading I use it as one tool of measuring market environment and it helps me to adjust my day-trading style during volatile times. Intraday I pay attention to these lines even below 20 i.e. I will be alert when shortest (9d day) line rises above VIX (30 day). Feel free to play around with this idea if you find it interesting and suitable for you. As always, DYOR (Do Your Own Research) before deciding to use it with real money. I've added several additional charts with examples to this post. Thank you and enjoy your trading :)Here is a chart with several VIX lines. "Correct Order" should be following: 1) Lowest value - VIX9D (9 day) - Cyan 2) Followed by VIX (30 days) - Orange 3) Followed by VIX3m (3 months) - Yellow 4) Highest value VIX6M /6 months) - Purple As mentioned above, this should be so called "Correct Order" of VIX lines.March 2020 - Market Selloff Trader should use his/her experience and have understanding about current market context. By that I mean trader should try to determine if this is just a pullback or something more serious. This was time where to stay alert for surprises. Remember - staying sidelines is perfectly good position when there is high degree of uncertainty. Also keep in mind that it is quite easy to analyse charts afterwards compared with real-time situations when things are just unfolding, and you don't have no more data on the right side of the chart than current bar!December 2018 - Market Selloff - VIX > 30Weekly chart covering approximately 17 years. As you can see VIX readings over 50 are very rare. VIX above 30 is also quite infrequent event. Just pointing out that if trader wants to focus only on high VIX (>30) readings then he/she will get very few signals (which is not necessarily a bad thing). Also there are periods when VIX stays below 20 for years (highlighted boxes). Thank you :)

Laurentsius

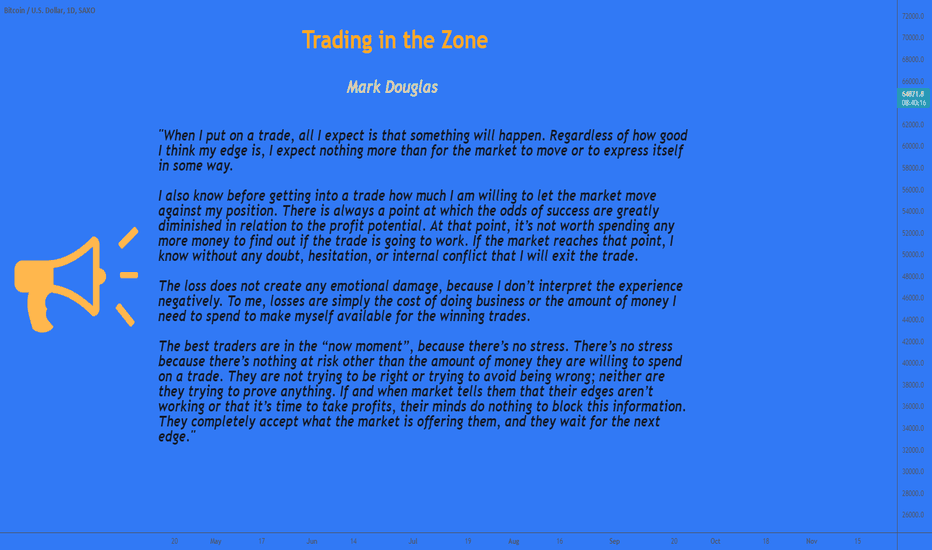
I wish you all to have a nice day. Something about how to deal with losses :) Thanks!

Laurentsius

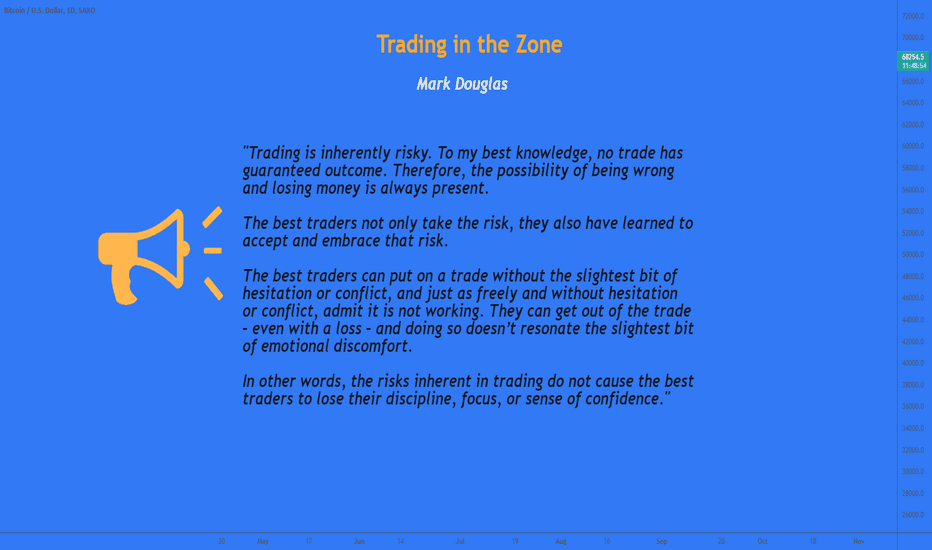
Quote from one of the best trading psychology books in my opinion. I have this on my office wall. Happy trading to You :)
Disclaimer
Any content and materials included in Sahmeto's website and official communication channels are a compilation of personal opinions and analyses and are not binding. They do not constitute any recommendation for buying, selling, entering or exiting the stock market and cryptocurrency market. Also, all news and analyses included in the website and channels are merely republished information from official and unofficial domestic and foreign sources, and it is obvious that users of the said content are responsible for following up and ensuring the authenticity and accuracy of the materials. Therefore, while disclaiming responsibility, it is declared that the responsibility for any decision-making, action, and potential profit and loss in the capital market and cryptocurrency market lies with the trader.