
Lamassu_Trade
@t_Lamassu_Trade

What symbols does the trader recommend buying?
Purchase History
پیام های تریدر
Filter
Lamassu_Trade
تحلیل اتریوم: قیمت دقیقاً کجا میرود؟ (هدف بعدی ۲۱۰۰ دلار؟)
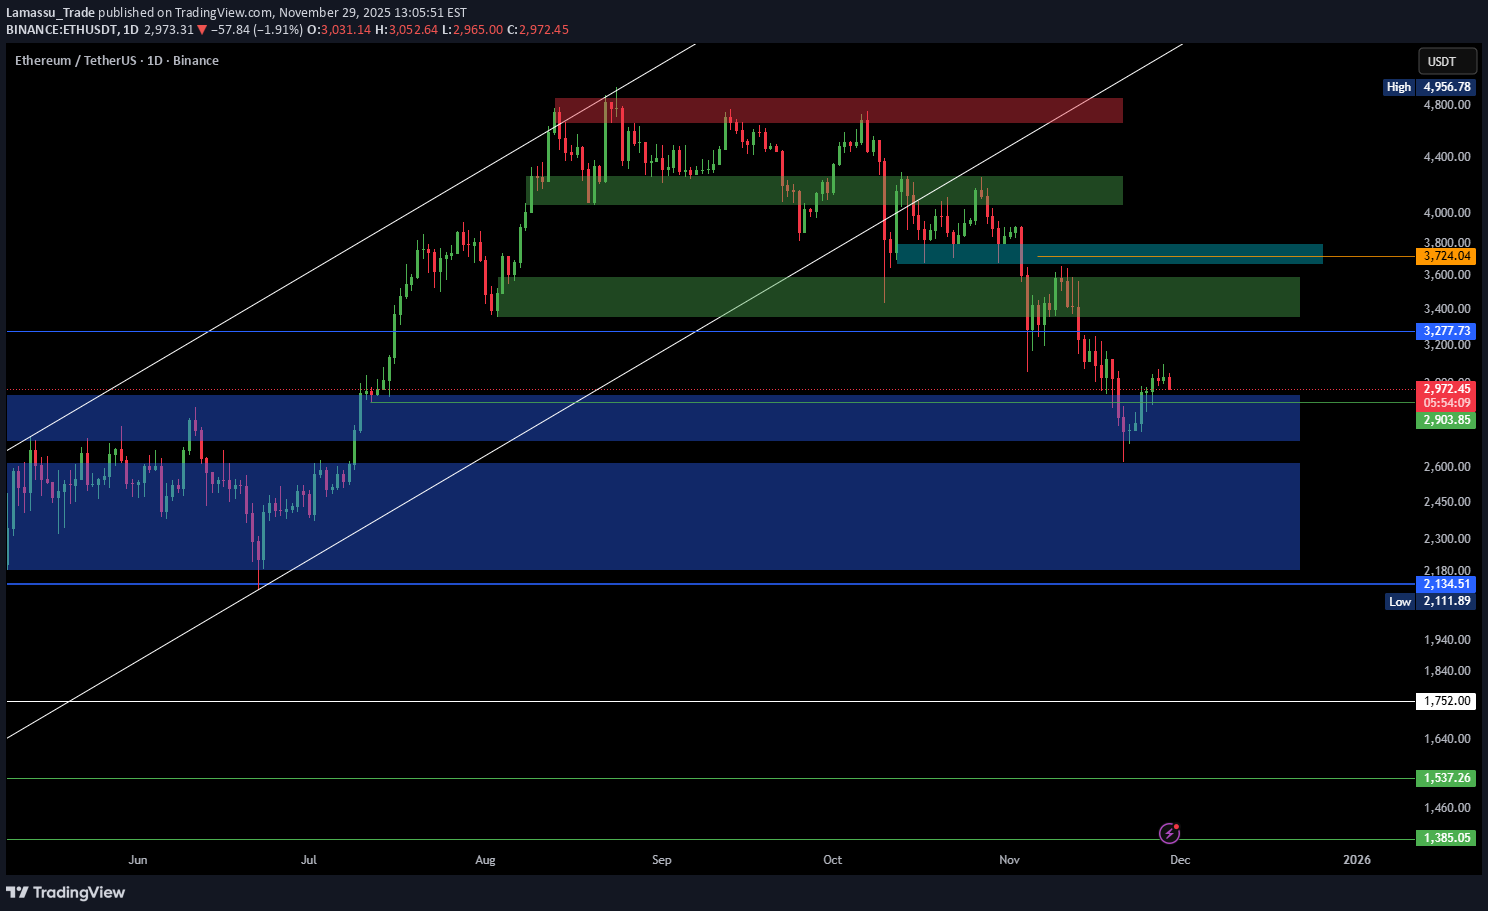
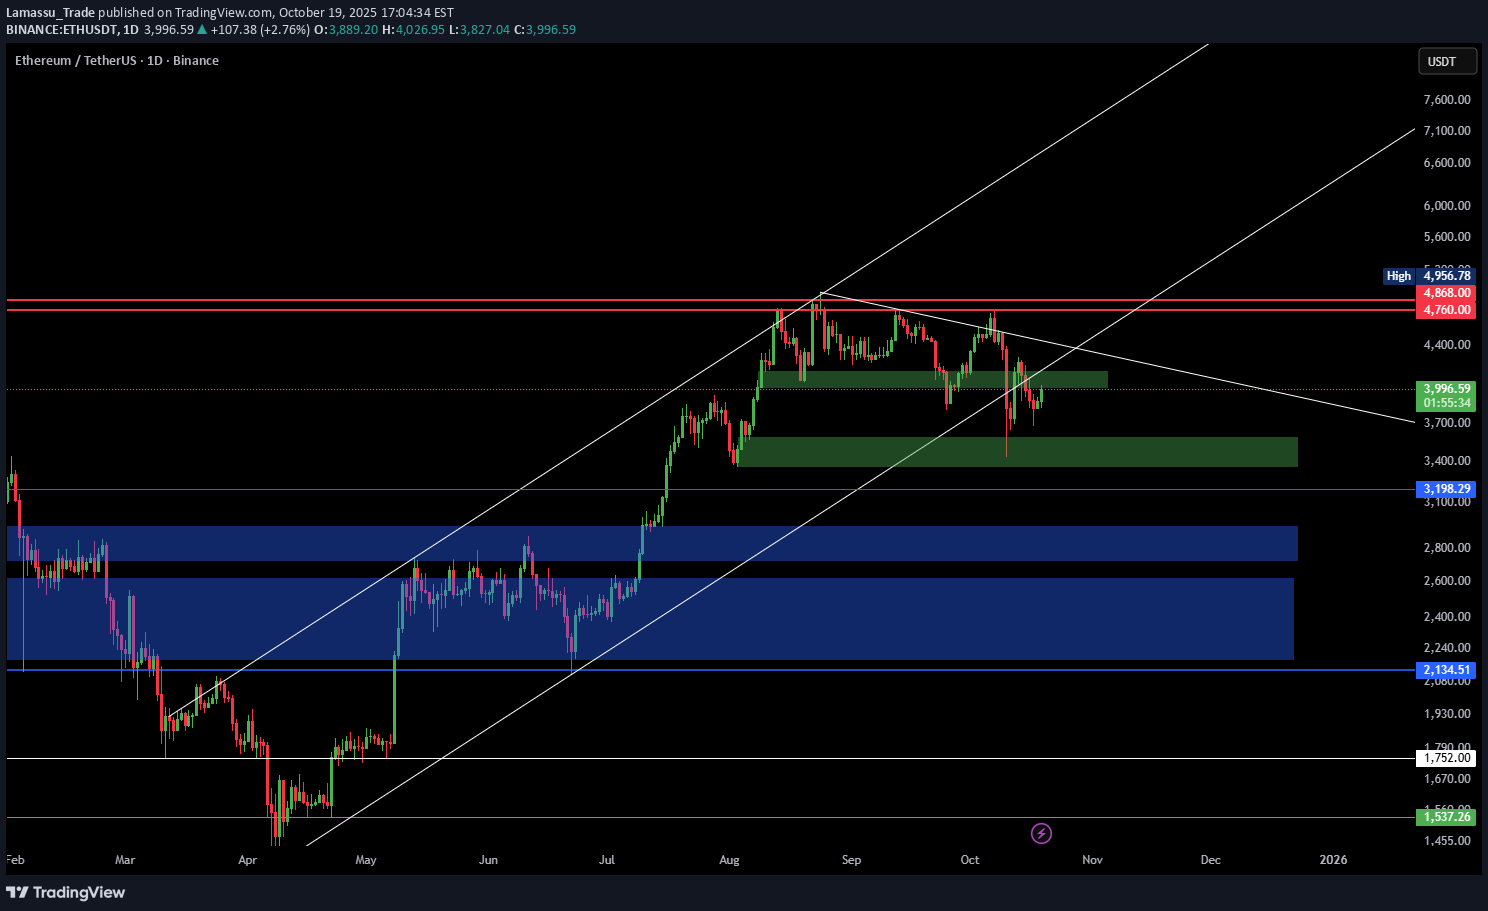
ETH continues to follow the levels we mapped out weeks ago. Every zone has reacted with precision, confirming the strength of the HTF structure and the broader bearish momentum. 🔻 Trend Outlook ETH remains below the broken ascending channel — no bullish structure has formed since the breakdown. The current bounce is weak and corrective, showing no sign of trend reversal. Market is forming consistent lower highs, signaling continuation to the downside. 🎯 Next Major Target Price is currently heading toward the blue demand zone, which we’ve been tracking: 👉 $2,134 – $2,200 This is the next high-probability reaction area, and until price reaches that zone, bearish continuation remains the most likely scenario. ⚠️ No Bullish Bias Yet Temporary green candles do not change the structure. Until ETH reclaims $3,277 with strength, all rallies are simply relief moves inside a downtrend. 📌 Summary All previously marked zones have respected perfectly. ETH remains bearish. Next key destination: $2.13k – $2.20k Expect volatility but structure remains clearly downward. ❗ Not financial advice — personal analysis only.we told you:next support zones:
Lamassu_Trade
بیت کوین: ریزش طبق پیشبینی تا کجای کانال نزولی ادامه دارد؟
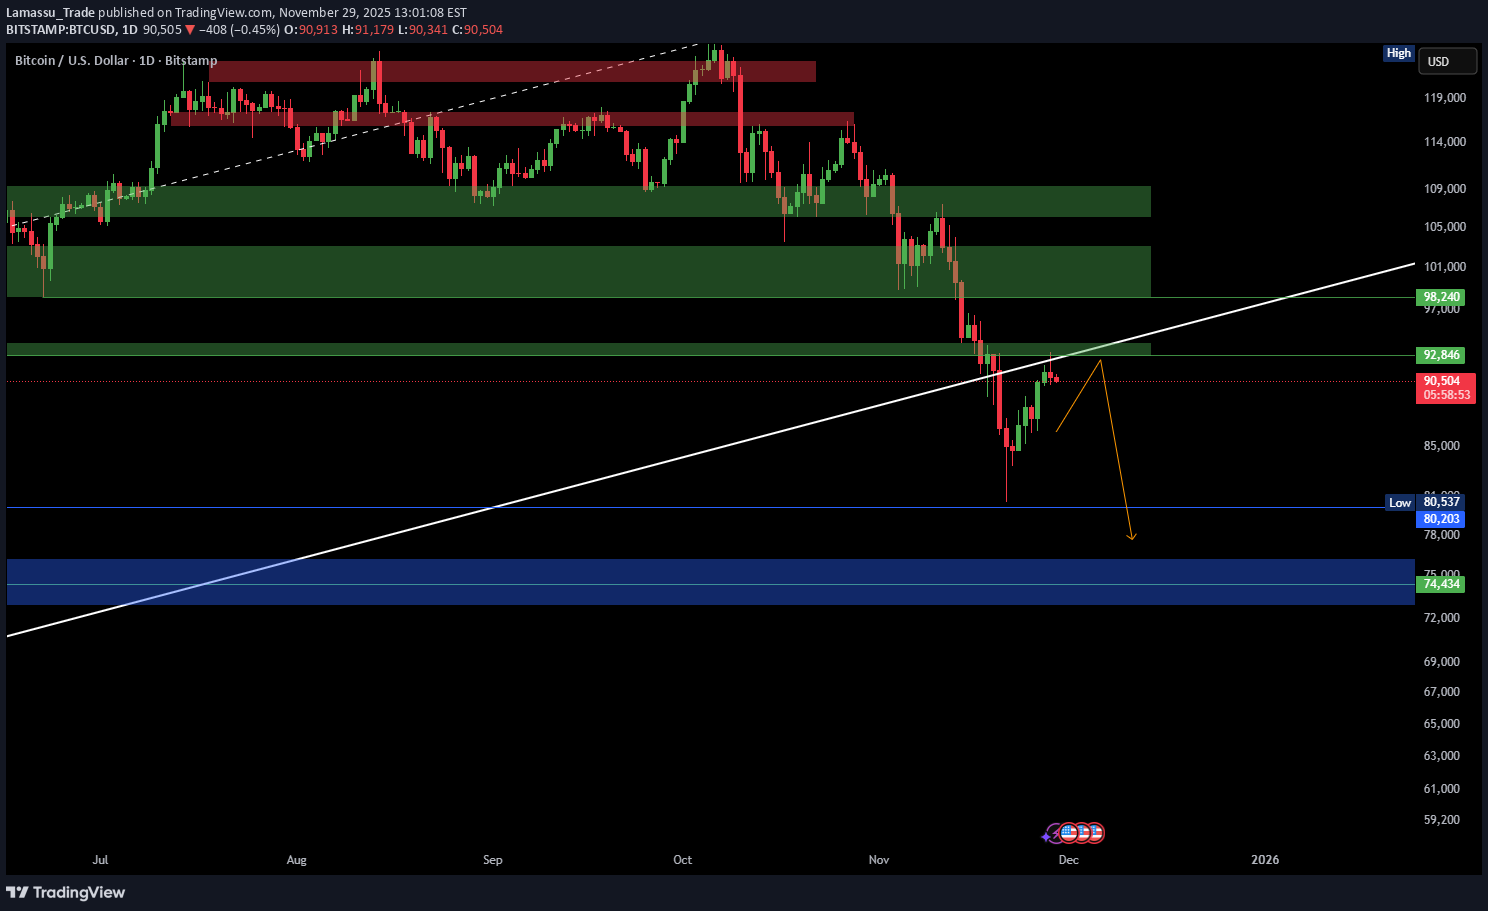
The pullback played out exactly as anticipated. Before price even touched the 92,846 zone, we highlighted it as a key rejection level — and the market reacted precisely from that point. The current move confirms that the bounce was only a relief rally inside a broader downtrend. 🔻 Trend Structure BTC remains below the broken long-term dynamic trendline. Every upward move is getting sold into — classic bearish continuation behavior. Lower highs are forming consistently, showing sustained pressure from sellers. 🎯 Next Target Zone Based on structure and liquidity mapping, price is now heading toward the 80,203 – 74,434 demand zone — the major support we have been tracking for weeks. This zone is extremely important: It’s the last untested high-timeframe demand block It includes major liquidity pools A sweep into this range would align perfectly with the macro break in structure ⚠️ No Change in Bias The trend remains bearish. The rejection from 92,846 confirms sellers are still in full control. This is not a trend reversal — it’s continuation. 📌 Summary Our earlier projection played out exactly as expected The dynamic trendline break remains valid BTC is likely heading toward the blue zone Expect volatility, but structure is still bearish ❗ Not financial advice — just my personal market outlook.The market is following our path:Next support zones:
Lamassu_Trade
بیت کوین در آستانه سقوط به ۷۴ هزار دلار؟ چرا نباید به این "اصلاح" فریبنده اعتماد کنید!
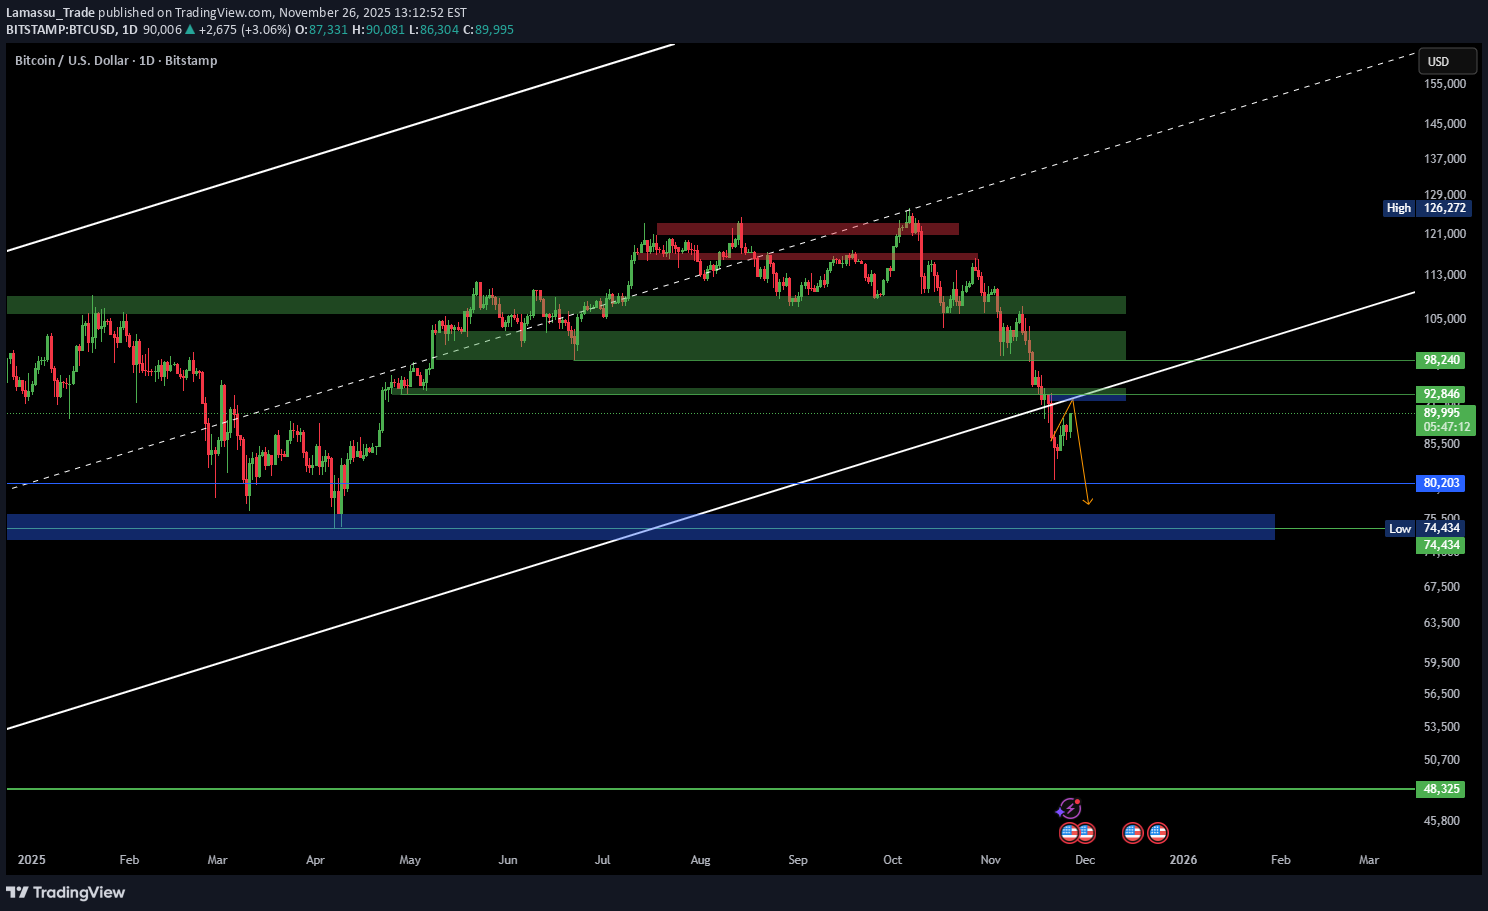
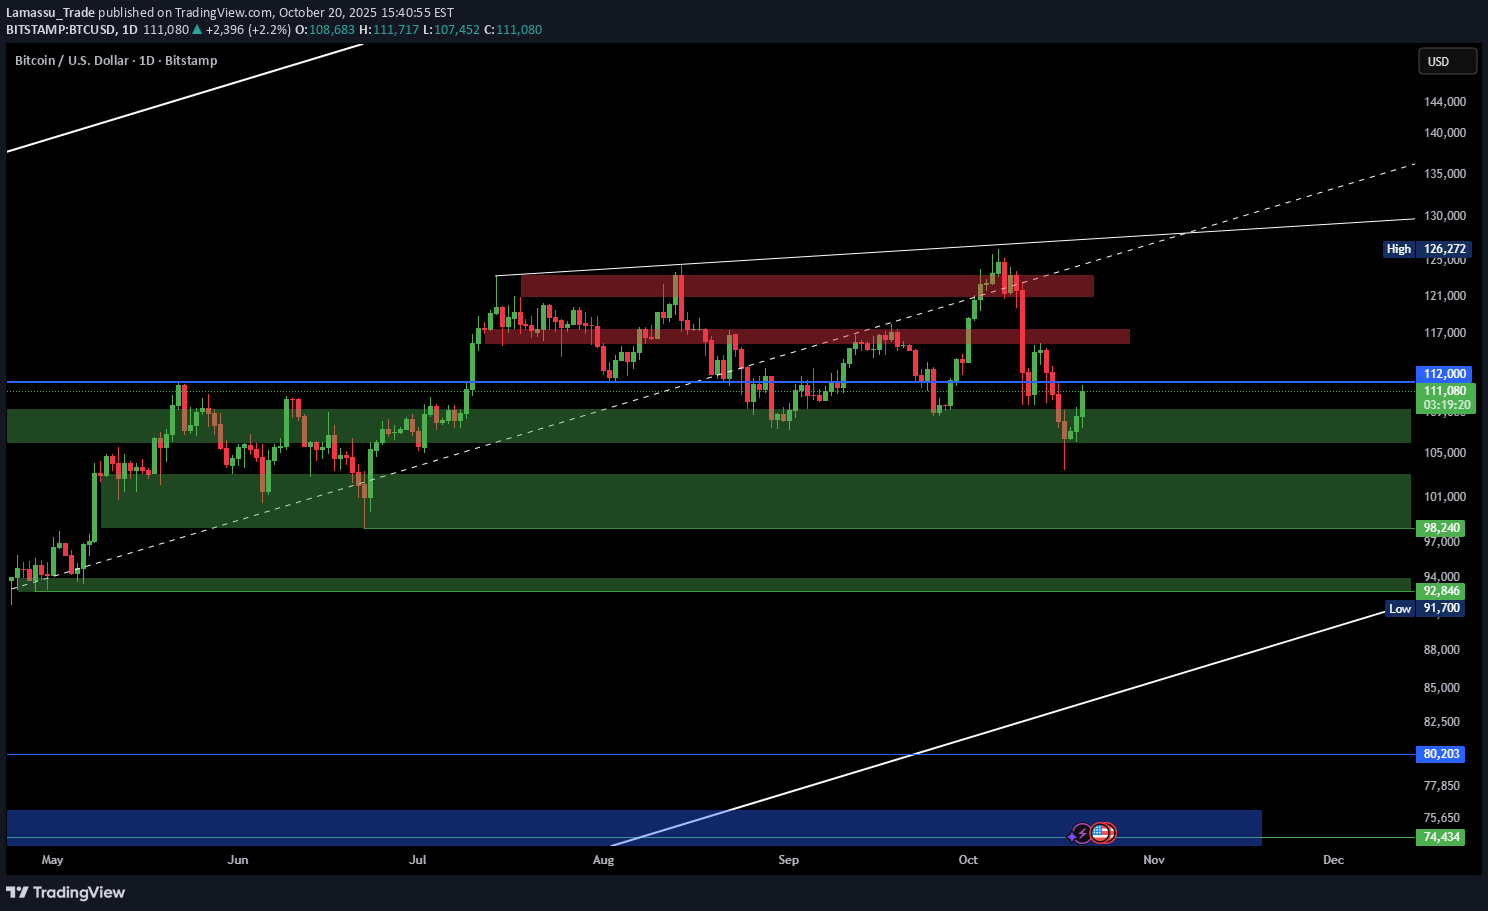
We’ve been calling the selloff since $124K, and price has followed the projected path exactly. Right now BTC is doing what most traders misread: a clean pullback into a broken long-term dynamic trendline. This bounce is not strength — it’s classic relief flow after a major breakdown. 🔥 Key Notes The long-term ascending trendline is broken. Current move up = textbook pullback, not reversal. Liquidity is still stacked below → market structure remains bearish. Maintain discipline: protect profits, avoid emotional longs. 🎯 My View Unless BTC reclaims and closes above the broken trendline, the market is still headed toward the next major liquidity pocket: 👉 Target: $74K (high probability — ~99%) I’ll update again once we get confirmation, but for now: Don’t get fooled by green candles. Structure always wins. ❗Not financial advice — just my personal analysis.Are you Ready? Put the stop above 92k and let's go down
Lamassu_Trade
اتریوم به هدف اول رسید: آیا سقوط ادامه دارد؟ (سقف شکسته شد)
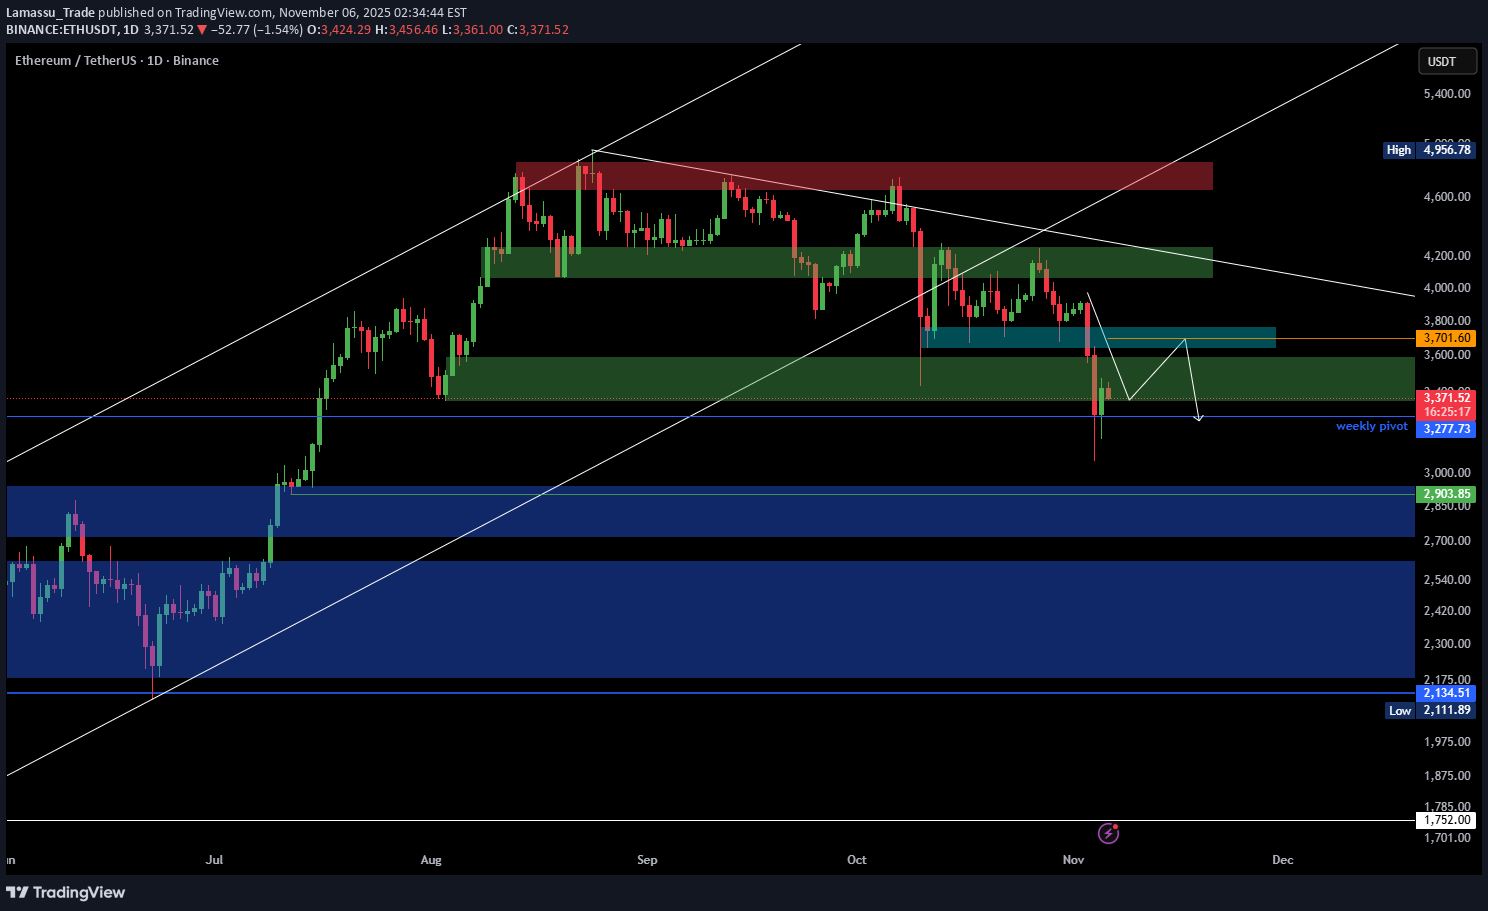
ETH has perfectly reached the first downside target we mapped earlier. Price broke the key support zone and today's candles confirm that the move was not a fakeout — this is real momentum, not noise. Right now, ETH is only retesting broken structure and still trading below all major resistances. Nothing about this chart suggests strength. 🔻 Next Steps (as plotted on the chart): A small bounce / retest is normal here, but as long as ETH stays below $3,700–$3,800, the trend remains bearish and continuation toward $2,900–$3,000 stays the primary target. This is still not a place to consider longs — it's simply a corrective pullback inside a confirmed downtrend. ⚠️ Trend direction has not changed. This move down is following the same plan we laid out from the top. ❗ Not financial advice — only my personal view.closer view: 4Hnext Support zones :
Lamassu_Trade
بیت کوین در آستانه سقوط بزرگ: آیا هدف بعدی 92 هزار دلار است؟
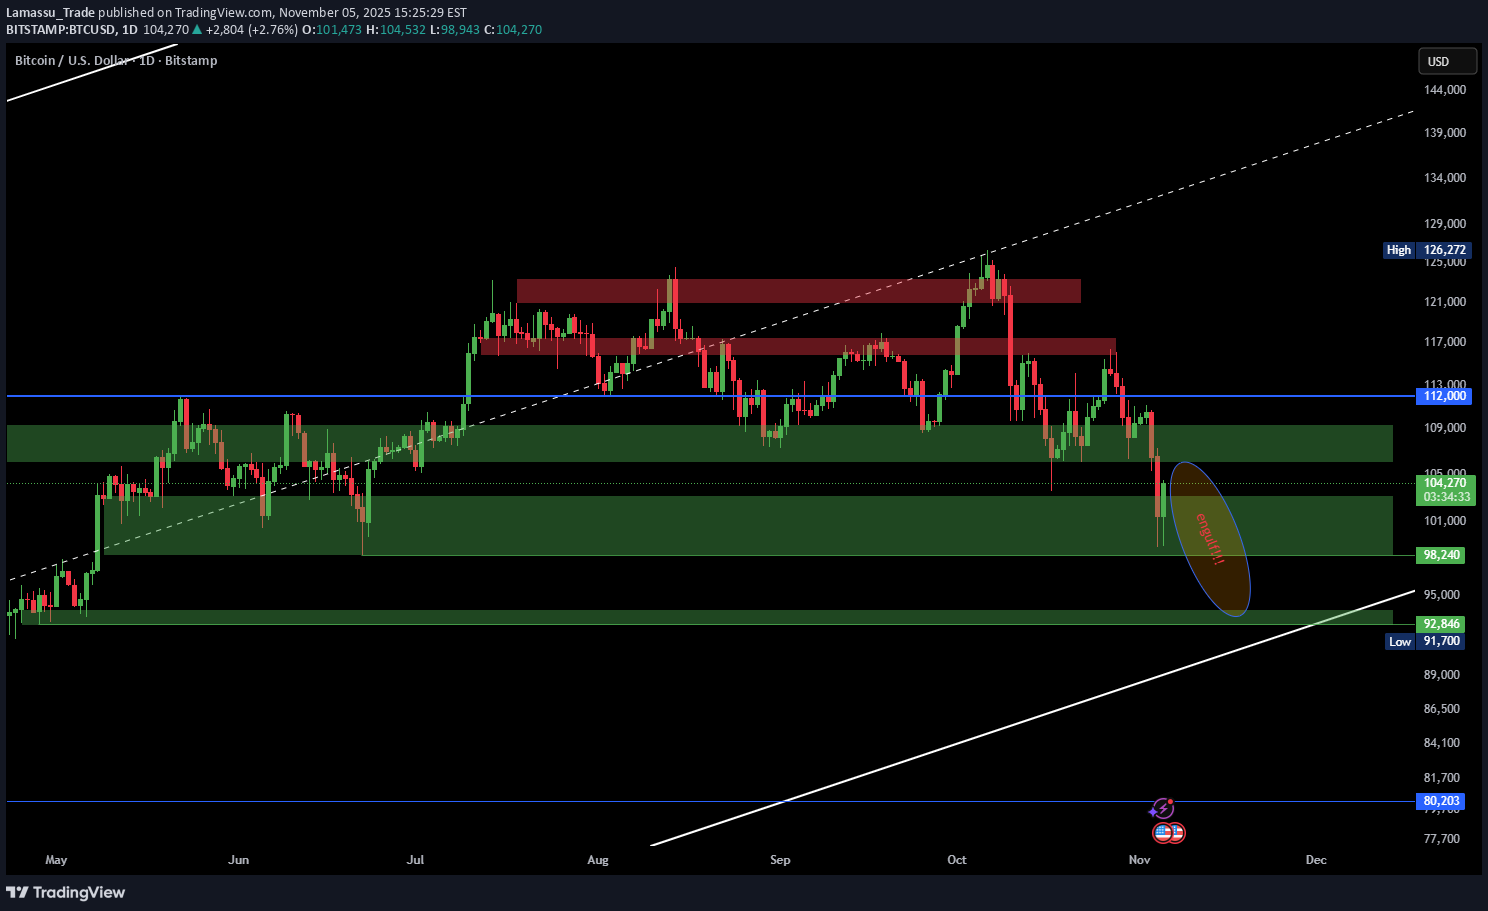
We’ve been calling for this drop since the top — and it’s playing out perfectly. The current green candle looks weak, and I expect it to be fully engulfed tomorrow by a strong red daily close. The $106K support is already broken and turning into a pivot resistance, showing clear weakness. Structure remains heavy; buyers have no control here. 📉 Key Outlook Engulf likely to form tomorrow → strong continuation signal Structure: Lower highs + selling pressure intact Next support: $98K → $92K Below $106K, the market stays bearish — no reason to long 💣 Every bounce is just a trap. Until BTC closes above $112K, this market belongs to the bears. ⚖️ Target zone: $92K — and it’s coming faster than most expect. ❗ Not financial advice — just exactly how I see it.closer view : 4H
Lamassu_Trade
بیت کوین سقوط کرد: آیا ریزش تا ۹۸ هزار دلار قطعی است؟
💥 Bitcoin (BTC/USD) — Downtrend Resumes Toward $98K Support Bitcoin has confirmed another rejection from the $120K–$124K supply zone, continuing its correction phase. The daily structure remains bearish, with price forming consistent lower highs and failing to reclaim the channel midpoint. 📉 Technical Outlook BTC is trading below key structure resistance at $113K–$115K. Immediate support lies at $109K–$105K — a break below this zone could accelerate a drop toward $98K–$92K. Momentum indicators remain weak, showing no signs of accumulation. The next strong demand zone sits between $98K–$93K, aligning with the previous breakout base. 💣 Bearish Continuation Sellers remain dominant while BTC trades under $115K. The trend structure favors continuation to the downside, and any short-term bounce is likely to face heavy selling pressure. 🚫 No Long Positions Suggested The market remains in a corrective leg — long entries at this stage carry high risk. Patience and discipline are essential while volatility remains high. ⚖️ Summary BTC continues its downward correction toward $98K–$92K support. Momentum remains bearish; traders should focus on managing risk, not chasing reversals. ❗ Not financial advice — only my personal view.
Lamassu_Trade
تحلیل بیت کوین: اتریوم در چنگ خرسها! مقصد بعدی کجاست؟
Ethereum remains under strong selling pressure. After losing its ascending channel and failing to reclaim $4,000, momentum has clearly shifted in favor of the bears. The market is now forming lower highs and showing no signs of strength recovery. 📉 Market Outlook Price action remains heavy below $4,000–$4,200 resistance. Current supports: $3,800, $3,400, and $3,200 — all potential short-term reaction zones, not reversal points. Breaking below $3,800 would likely trigger continuation toward $3,200–$2,800. Volume structure confirms distribution — no demand yet visible from buyers. 🚫 No Long Positions Recommended The market is still in a corrective phase; long setups carry high risk. Until ETH reclaims strong structure, short-term rallies are expected to be sold into. ⚖️ Summary Bearish momentum dominates while below $4,000. Patience and discipline are key — avoid counter-trend trades in this environment. ❗ Not financial advice — just my personal market view.Are You Ready!!!!???
Lamassu_Trade
بیت کوین سقوط کرد: پیشبینی دقیق ریزش از سقف ۱۲۴ هزار دلاری!

In our previous analysis, we warned: “Bitcoin is testing the $120K–$124K resistance zone, right under the mid-line of the long-term ascending channel. A daily close above $124K = breakout. Rejection = bearish retrace.” And here we are — the rejection hit perfectly. BTC reached $126K, couldn’t close above $124K, and then dumped straight to $112K, confirming our bearish scenario 🔻 📉 Market recap: Clean rejection at mid-channel resistance. Price broke below $118K support → bearish confirmation. Current zone $112K–$109K may act as short-term demand. Next major support levels: $105K and $95K. For bulls to recover, BTC needs to reclaim $118K–$120K on a daily close. 💣 We said this would happen — and it did. Massive liquidations followed, and once again, patience paid off. ⚖️ Outlook: Momentum remains bearish while under $118K. Short opportunities still valid, but manage risk — volatility remains extreme. 💬 Check the proof — our previous BTC call 👇
Lamassu_Trade
پیشبینی محقق شد: اتریوم زیر ۴۰۰۰ دلار سقوط کرد! آیا این پایان کار است؟

In our previous analysis (Oct 3) we warned loud and clear: “For ETH to stay bullish, it must close above $4,960 — otherwise, rejection could trigger a deep retrace.” ETH only managed to reach $4,700, failed to break or close above $4,960, and then collapsed, closing below the $4,000 level — confirming a major bearish breakdown right after one of the largest crypto liquidation waves of 2025. 🔻 Technical Breakdown: ETH has broken below the ascending channel and lost key structural support. Price is now consolidating around $3,800–$3,600, but momentum remains weak. If this zone breaks, next demand levels are $3,200–$2,800, and $2,130 as the final strong support. Only a daily close back above $4,200–$4,300 can shift structure back to neutral. 📉 Market Context: Last night’s liquidation wiped out billions in leveraged longs across the crypto market. ETH followed BTC’s rejection perfectly — exactly as we predicted. We said it before: no close above $4,960 = correction, and that’s precisely what played out. ⚖️ Outlook: Short-term → Bearish Mid-term → Testing support for possible relief bounce Long-term → Bullish only if price reclaims the channel and $4,300 For those who followed the plan and stayed cautious — well done. For late longs — the market just gave a painful reminder. ❗ This is not financial advice — just my personal market view. 💬 Check our previous analysis below 👇
Lamassu_Trade
اتریوم در نقطه تصمیمگیری حیاتی: آیا ETH به ۵۵۰۰ دلار میرسد یا سقوط میکند؟

Ethereum is testing the $4,760–$4,960 resistance zone inside its long-term ascending channel. 🔼 Bullish case: A daily close above $4,960 opens the path to $5,500–$6,300, targeting the upper channel. 🔽 Bearish case: Rejection here could pull ETH back to $4,000–$4,100, with deeper supports at $3,200–$2,800 and $2,130. ETH follows BTC’s momentum — but U.S. macro risks (shutdown, Fed uncertainty) keep downside risk alive. ⚖️ Summary: ETH is at a decision point — breakout above $4,960 = bullish continuation, rejection = bearish retrace. ❗ Not financial advice — only my personal view.We said it! ETH couldn’t close above $4,960 — just like we warned. Market dropped hard below $4,000 after massive liquidations.
Disclaimer
Any content and materials included in Sahmeto's website and official communication channels are a compilation of personal opinions and analyses and are not binding. They do not constitute any recommendation for buying, selling, entering or exiting the stock market and cryptocurrency market. Also, all news and analyses included in the website and channels are merely republished information from official and unofficial domestic and foreign sources, and it is obvious that users of the said content are responsible for following up and ensuring the authenticity and accuracy of the materials. Therefore, while disclaiming responsibility, it is declared that the responsibility for any decision-making, action, and potential profit and loss in the capital market and cryptocurrency market lies with the trader.