
Kyle_Jokinjef
@t_Kyle_Jokinjef

What symbols does the trader recommend buying?
Purchase History
پیام های تریدر
Filter
Kyle_Jokinjef
سیگنال دقیق خرید و فروش بیت کوین: فرصتهای لانگ و شورت در چه قیمتهایی؟

BTCUSD signal analysis: Currently, there is a selling opportunity in the $94,600-$96,300 area. Support and buying opportunities are seen in the $91,200-$90,300 area, with key support at $898,700. Good luck to all traders.
Kyle_Jokinjef
تحلیل بیت کوین: سیگنال خرید و فروش روزانه در چه قیمتی است؟

BTC Daily Chart Analysis: Short-term selling resistance is at $88,600-$89,700, which can be considered a selling reference. The downside potential is around $86,500-$85,100, where there is support. This support level can be considered a buying reference. Good luck to all traders.
Kyle_Jokinjef
سیگنال خرید و فروش بیت کوین: سطوح کلیدی حمایت و مقاومت امروز (۸۴ تا ۹۴ هزار دلار)

Short-term pullback buying opportunities are seen at $86,100-$85,000, with key support at $84,200. Meanwhile, selling resistance is seen in the $89,700-$91,500 area; a break above this area would target the $93,700 resistance level. Wishing all traders the best of luck.
Kyle_Jokinjef
سیگنالهای خرید و فروش دقیق بیت کوین: سطوح کلیدی و زمانبندی معامله!

Daily chart analysis indicates short-term selling pressure for BTC at $85,700-$86,800. If the price fails to break through this resistance zone, you can choose to execute a sell order. Consider executing a buy order when the price retraces to the $81,700-$79,200 range. Good luck to all traders.
Kyle_Jokinjef
سیگنال خرید و فروش بیت کوین (BTC): مراقب این سطوح قیمتی باشید!

In the short term, watch for selling pressure at $93,800 for BTC, and buying support at $91,300-$90,700.The BTC plan is exactly as expected, precisely hitting the $93,800 resistance level before pulling back by nearly $1,000. If it does not break through $93,800, the pullback area will be the $92,300-$91,700 support zone.
Kyle_Jokinjef
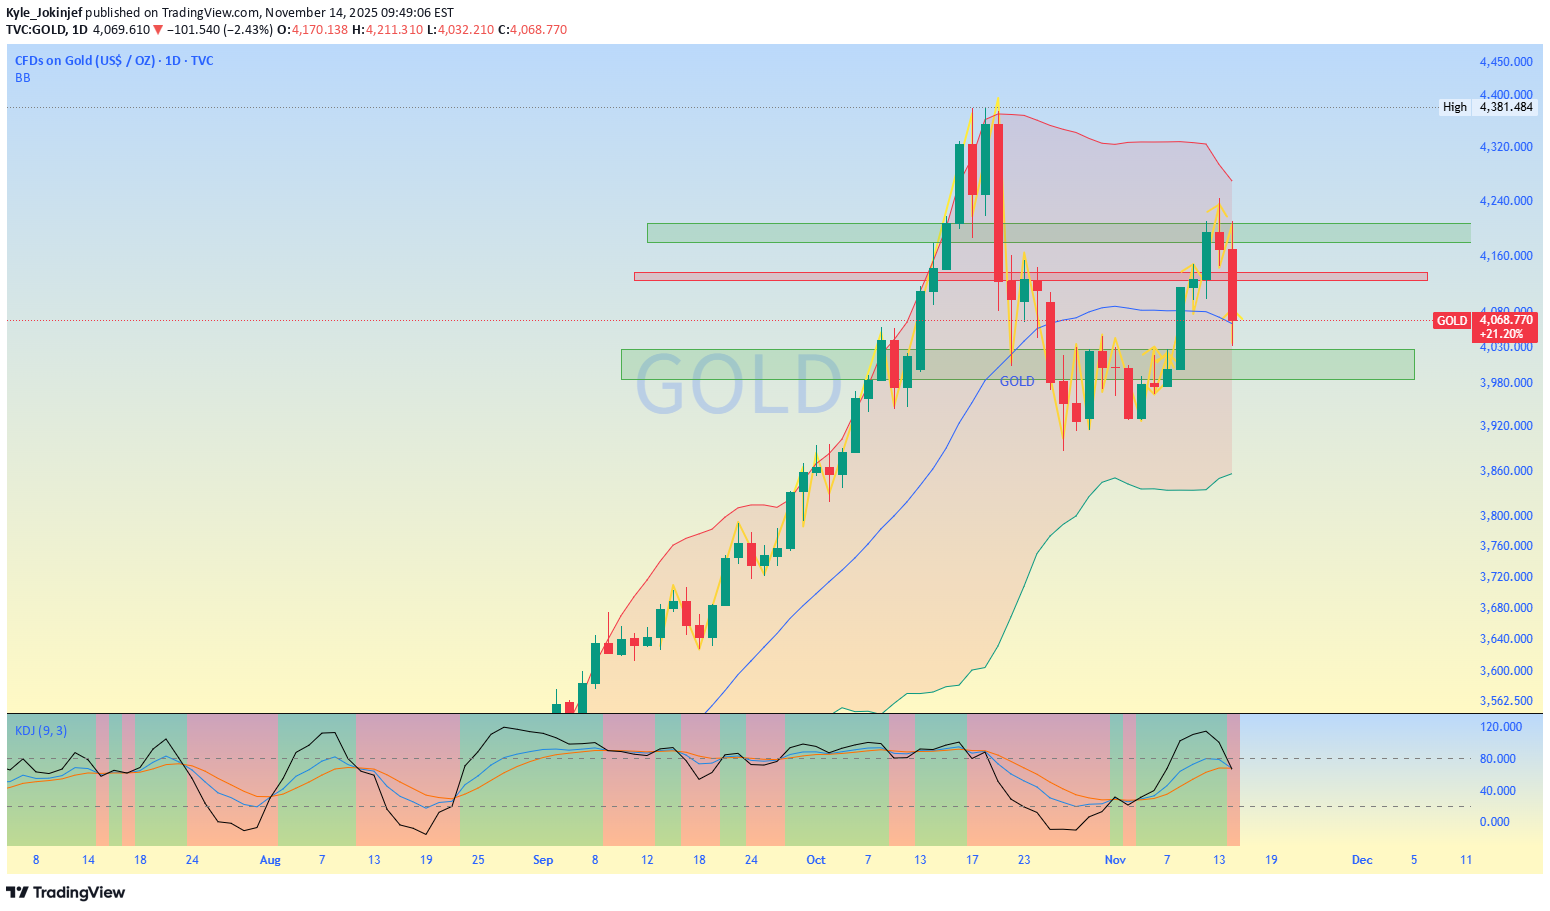
سیگنالهای طلایی خرید و فروش: نقاط حساس ورود طلا در بازار امروز!

Short entry opportunity: If gold prices rebound and encounter resistance in the $4087-$4100 area. Long entry opportunity: If gold prices fall back to the $4006-$4013 support area and show signs of stabilization.
Kyle_Jokinjef
برنامه دقیق خرید طلا: ۲۲ دلار سود در هر اونس!

Perfect! This plan accurately hit the $4055 buy signal, and the price has now risen to around $4080, an increase of over $22 per ounce. This once again verifies that the plan perfectly aligns with market trends. Real-time member trading has once again yielded substantial profits, and the traders executing this plan have also been correct. Precise and successful trading signals in the market are the only way to help independent traders escape difficulties. Wishing all traders the best.
Kyle_Jokinjef
سطوح حیاتی بیت کوین: مقاومت $96,300 کجاست و کجا بخریم؟

BTC is showing a short-term corrective upward trend. Selling pressure is at $96,300; a break above this level would lead to a rise to $97,200-$97,800. Meanwhile, support lies at $91,300-$93,700 for buying opportunities. Key support is at $89,700.
Kyle_Jokinjef
سیگنال طلای امروز: مراقب سطوح حیاتی خرید و فروش در بازار باشید!

Analyzing the 4-hour chart, short-term resistance is seen at $4126-$4137, with a key selling pressure at $4151. Support is seen at $4055-$4046, with a key support level at $4018. Wishing all traders the best of luck.Perfect! This plan accurately hit the $4055 buy signal, and the price has now risen to around $4080.The increase of over $22 per ounce further validates that this plan perfectly aligns with market trends.Those who followed the plan have succeeded.Did you execute it?Perfect! This plan accurately hit the $4055 buy signal, and the price has now risen to around $4080, an increase of over $22 per ounce. This once again verifies that the plan perfectly aligns with market trends. Those who followed the plan have achieved victory. Did you execute it?
Kyle_Jokinjef
سیگنال فروش طلا: طلا در آستانه مقاومت کلیدی $4,085، آماده ریزش؟
After the US market opened, gold touched $4,033 and then rebounded quickly. The key resistance level to watch for this upward move is $4,085-$4,096.The expected upward range of $4085-$4097 will be reached soon, with an increase of more than $50 per ounce.This is entirely in line with market trends. Did you do it right?
Disclaimer
Any content and materials included in Sahmeto's website and official communication channels are a compilation of personal opinions and analyses and are not binding. They do not constitute any recommendation for buying, selling, entering or exiting the stock market and cryptocurrency market. Also, all news and analyses included in the website and channels are merely republished information from official and unofficial domestic and foreign sources, and it is obvious that users of the said content are responsible for following up and ensuring the authenticity and accuracy of the materials. Therefore, while disclaiming responsibility, it is declared that the responsibility for any decision-making, action, and potential profit and loss in the capital market and cryptocurrency market lies with the trader.