KiaEskandari
@t_KiaEskandari
What symbols does the trader recommend buying?
Purchase History
پیام های تریدر
Filter

KiaEskandari
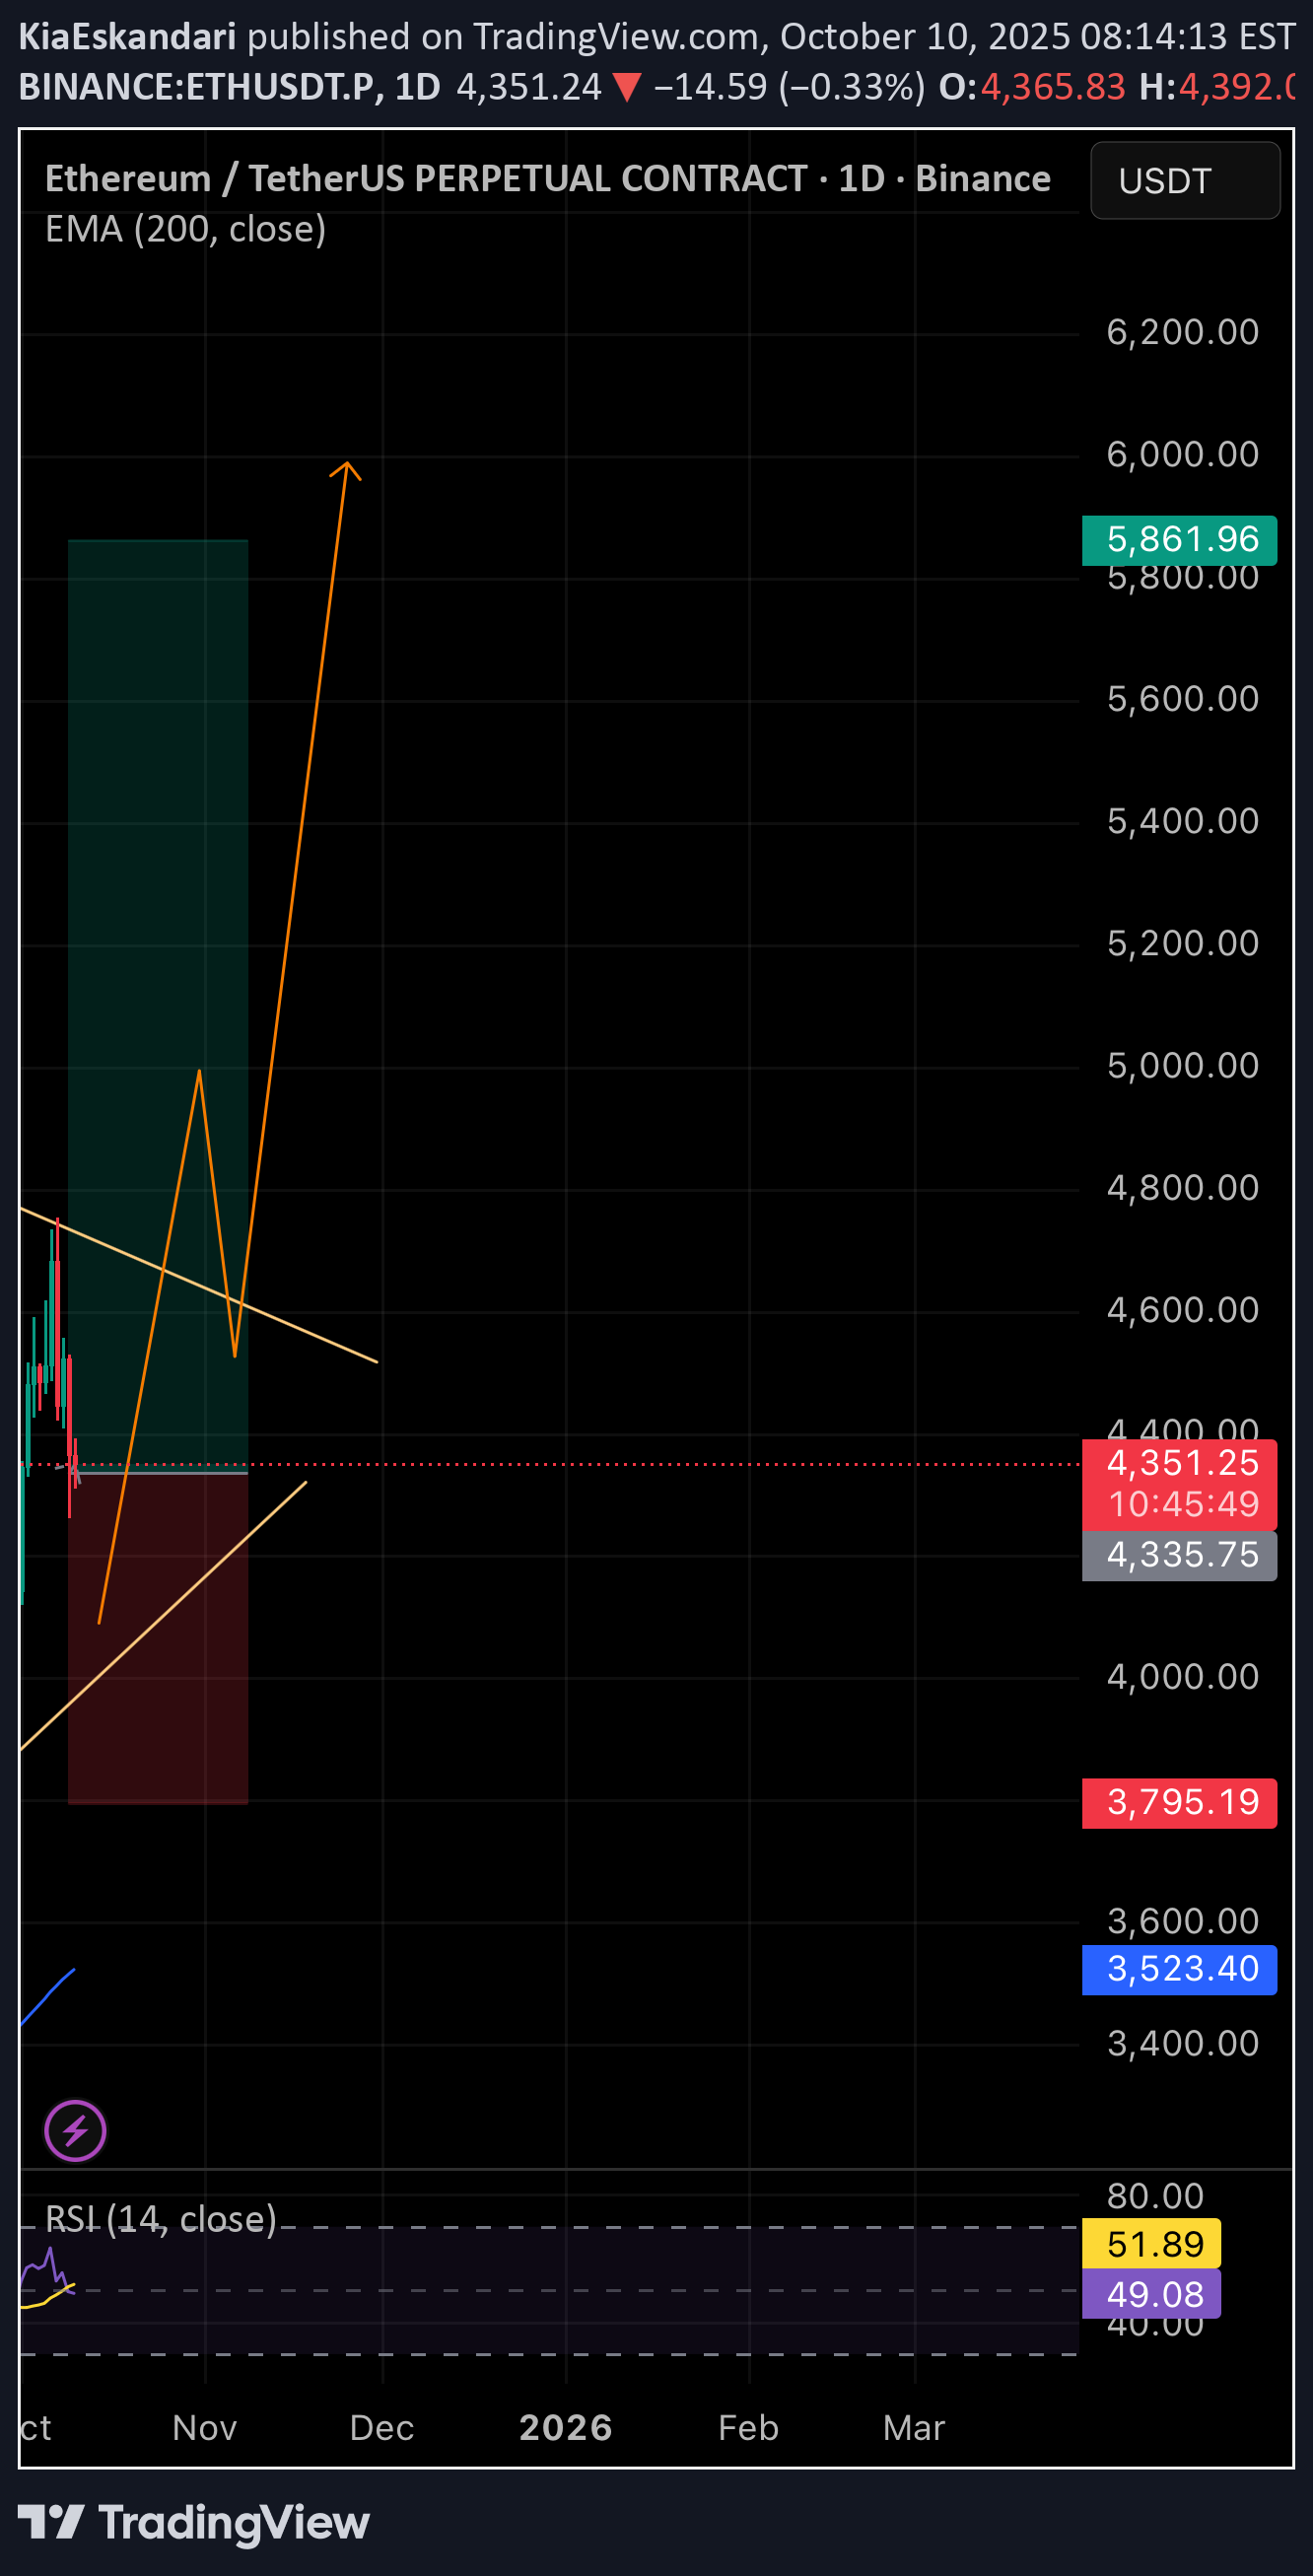
تحلیل تکنیکال اتریوم (ETH): منتظر انفجار بزرگ در کدام قیمت؟

📊 **Ethereum Daily Analysis (ETH/USDT)** The price is consolidating inside a symmetrical triangle, showing strong signs of a major breakout. I’m watching this pattern closely — once the resistance is broken and the price retests the breakout zone, a strong bullish rally could follow. 📈 **Scenario:** - Entry: Around the breakout of the triangle (~$4400) - Target: $5800 - $5900 zone - Stop Loss: Below the trendline support (~$3800) RSI is recovering from mid-levels, and EMA200 is acting as a strong dynamic support — both suggesting bullish momentum might accelerate soon. ⚠️ *Watch out for a potential fake breakout before confirmation. A successful retest could provide a high R:R trade opportunity.* Do you agree with this setup? Share your thoughts below 👇

KiaEskandari
ENA Breakout Setup – Targets at $0.60, $0.76, $0.97, and $1.26

The ENA/USDT daily chart shows a descending triangle formation with price currently testing the upper resistance trendline around $0.419. A breakout above this level could trigger a strong bullish move. The RSI (14) is hovering around 53, suggesting building momentum from the bulls. Once the breakout is confirmed, we could see a rally toward the key resistance levels and Fibonacci extension targets at: •$0.6072 •$0.7665 •$0.9776 •$1.2662 Additionally, a successful breakout could lead to a retest of the 200 EMA, potentially flipping it into support and signaling a longer-term trend reversal. Trade Setup: •Entry: After confirmed breakout above triangle resistance •Stop Loss: Below $0.36 support zone •Take-Profit Targets: $0.6072 / $0.7665 / $0.9776 / $1.2662 •Timeframe: Daily Always manage your risk and wait for confirmation before entering the trade.

KiaEskandari
Ethereum (ETH) Breakout Potential – Trend Reversal in Sight?

Ethereum (ETH) is showing signs of breaking out from a descending channel on the 4-hour timeframe. The price has been consolidating near the upper boundary of the channel, and a breakout above this resistance could signal the start of an uptrend. •Key Levels: •Resistance to break: $1,950 - $2,000 •Potential targets: $2,274, $2,335 •Support: $1,800 •Technical Indicators: •The 200 EMA (blue line) is currently above the price, indicating a broader downtrend. However, a successful breakout could challenge this trend. •Price action is forming higher lows, suggesting increasing buying pressure. •If the breakout is confirmed, we could see a move towards $2,274 and $2,335 in the coming days. •Trade Plan: •Entry: Upon confirmed breakout and retest of the channel. •Stop-loss: Below $1,880 (depending on risk appetite). •Take profit: $2,274 - $2,335. This setup presents a potential trend reversal opportunity for ETH if the breakout sustains. However, failure to break resistance may result in a rejection back into the descending channel. What are your thoughts on this setup? Let me know in the comments!

KiaEskandari
Bitcoin Weekly Outlook – Potential Correction & Long-Term Trend

Bitcoin has reached a critical resistance level within its long-term ascending channel. A possible correction towards the $58,000 - $48,000 range could occur before the next upward impulse. The blue dashed trendline represents a key support level that, if broken, may lead to a deeper retracement. However, a bounce from this area could trigger a bullish continuation towards the upper channel resistance at $120,000 in the long run. Key levels to watch: 🔴 Resistance: $78,359 🟢 Major support levels: $58,632 & $48,324 What are your thoughts? Will Bitcoin retrace before its next bullish move? 🚀

KiaEskandari
Short

Eth when break out 1550 I will open short positions on that What's your idea?
Disclaimer
Any content and materials included in Sahmeto's website and official communication channels are a compilation of personal opinions and analyses and are not binding. They do not constitute any recommendation for buying, selling, entering or exiting the stock market and cryptocurrency market. Also, all news and analyses included in the website and channels are merely republished information from official and unofficial domestic and foreign sources, and it is obvious that users of the said content are responsible for following up and ensuring the authenticity and accuracy of the materials. Therefore, while disclaiming responsibility, it is declared that the responsibility for any decision-making, action, and potential profit and loss in the capital market and cryptocurrency market lies with the trader.