
Kenn_Nguyen
@t_Kenn_Nguyen

What symbols does the trader recommend buying?
Purchase History
پیام های تریدر
Filter
Signal Type

Looking at the XAUUSD chart, I’m genuinely intrigued by what’s unfolding. Price continues to move steadily within an upward parallel channel, perfectly respecting the market structure, while we are starting to see early signs of renewed buying interest right after a strong rejection at the support zone. At the moment, I’m focusing on the area around 3,721, near the upper boundary of the channel, as a safe target. If the upward momentum continues with strength and solid volume, this could present a strategic opportunity to enter the market and ride the trend. Patience is key; I only take action when the price proves its true strength. The market may continue its strong uptrend or create a false move before a deeper correction.
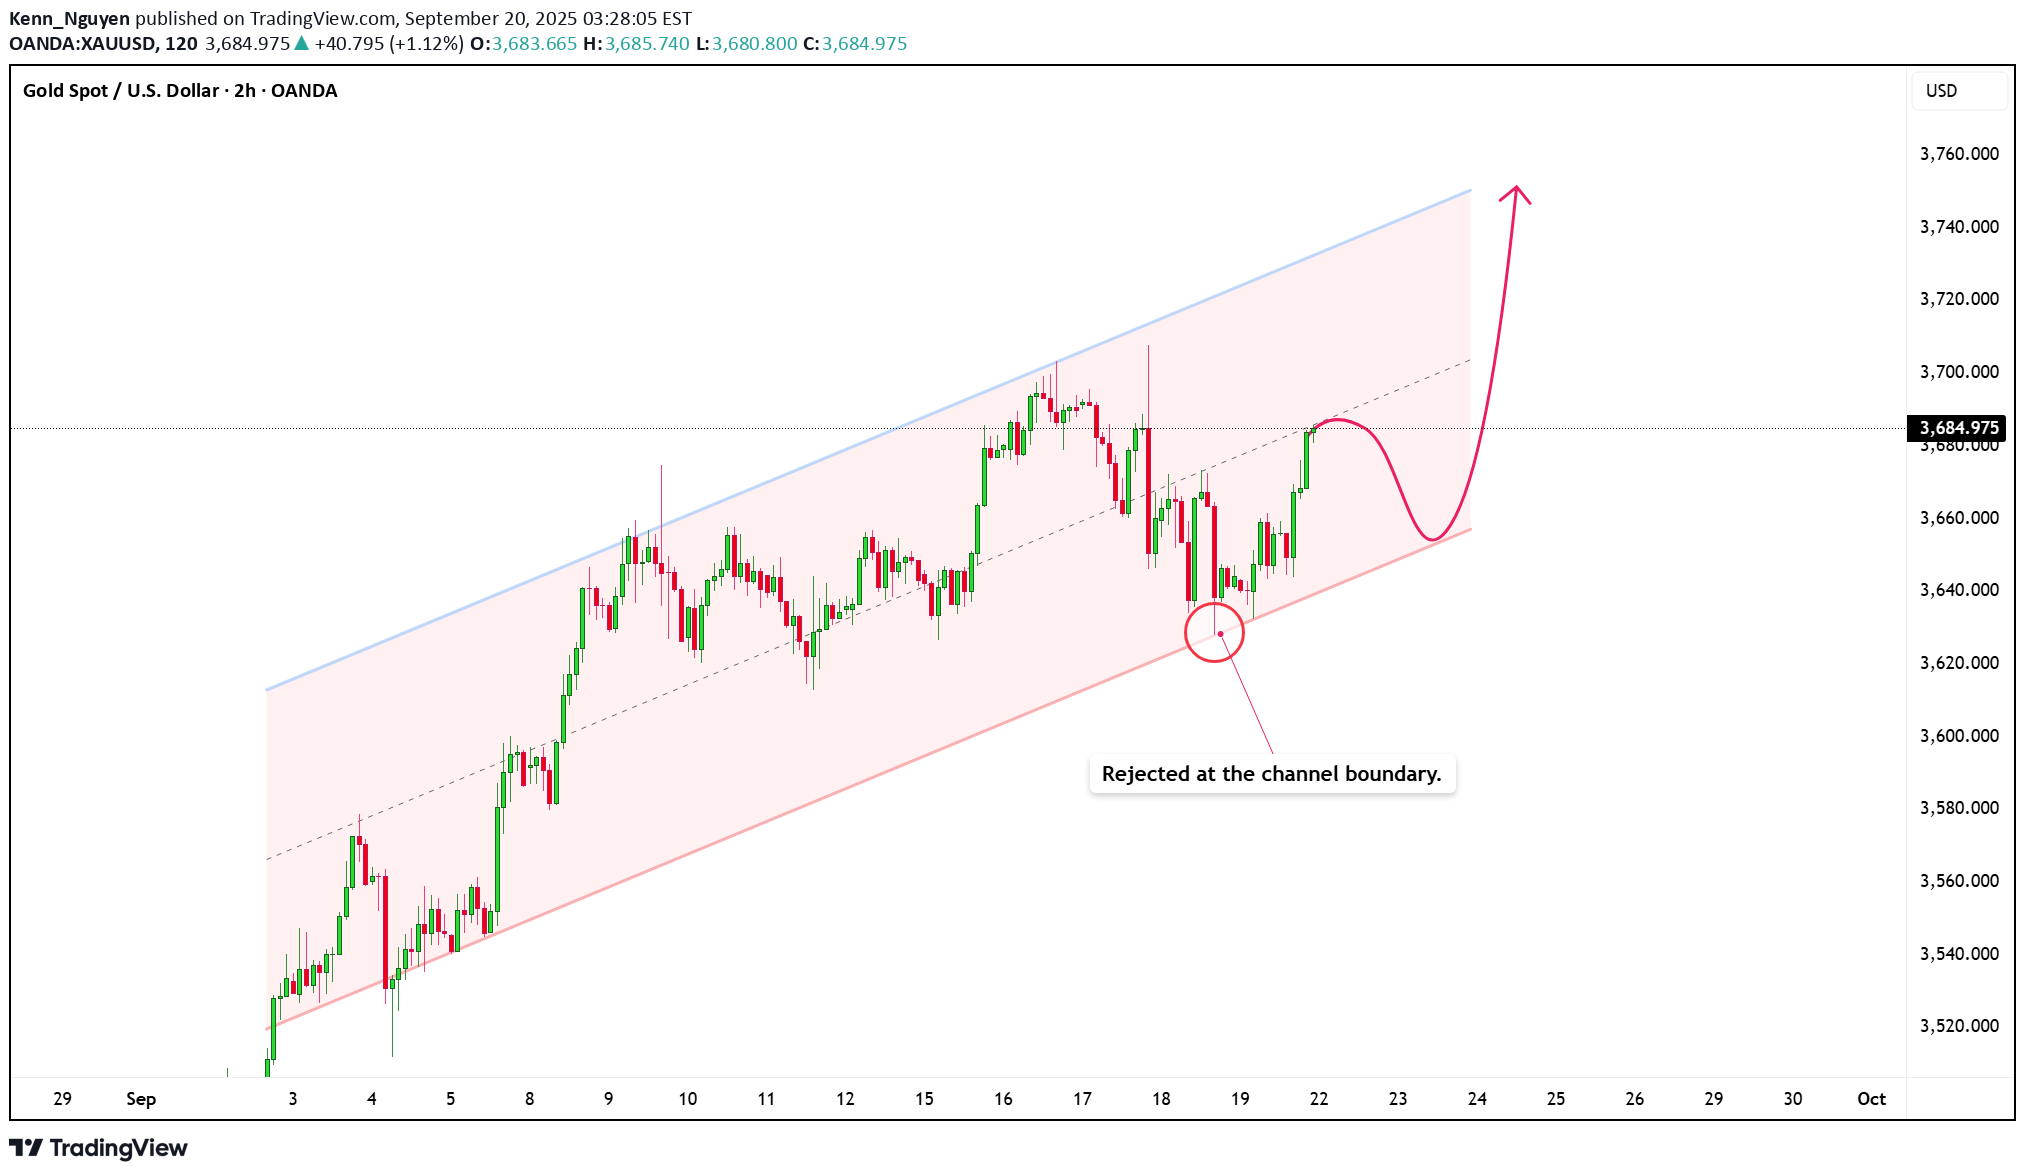
Looking at the XAUUSD chart, I’m finding it quite fascinating. Here’s the situation: XAUUSD is moving within an upward parallel channel, respecting the market structure perfectly, and we’re starting to see early signs of renewed buying interest right after a strong rejection from the support zone. Currently, price is trading near a key resistance zone, and this is where the market gets interesting. At this resistance zone, there's a high likelihood of a short-term correction within the price channel. If price holds within the channel, the uptrend could continue, and the upper channel boundary might even be broken, extending the upward momentum further. I’m targeting the upper boundary of the channel, and given the market context, this is entirely possible. Keep in mind that, in a channel like this, trading with the trend is generally more favorable than fighting against it. Until the channel is broken, the bulls are still in control. Do you agree? Feel free to share your thoughts in the comments below!
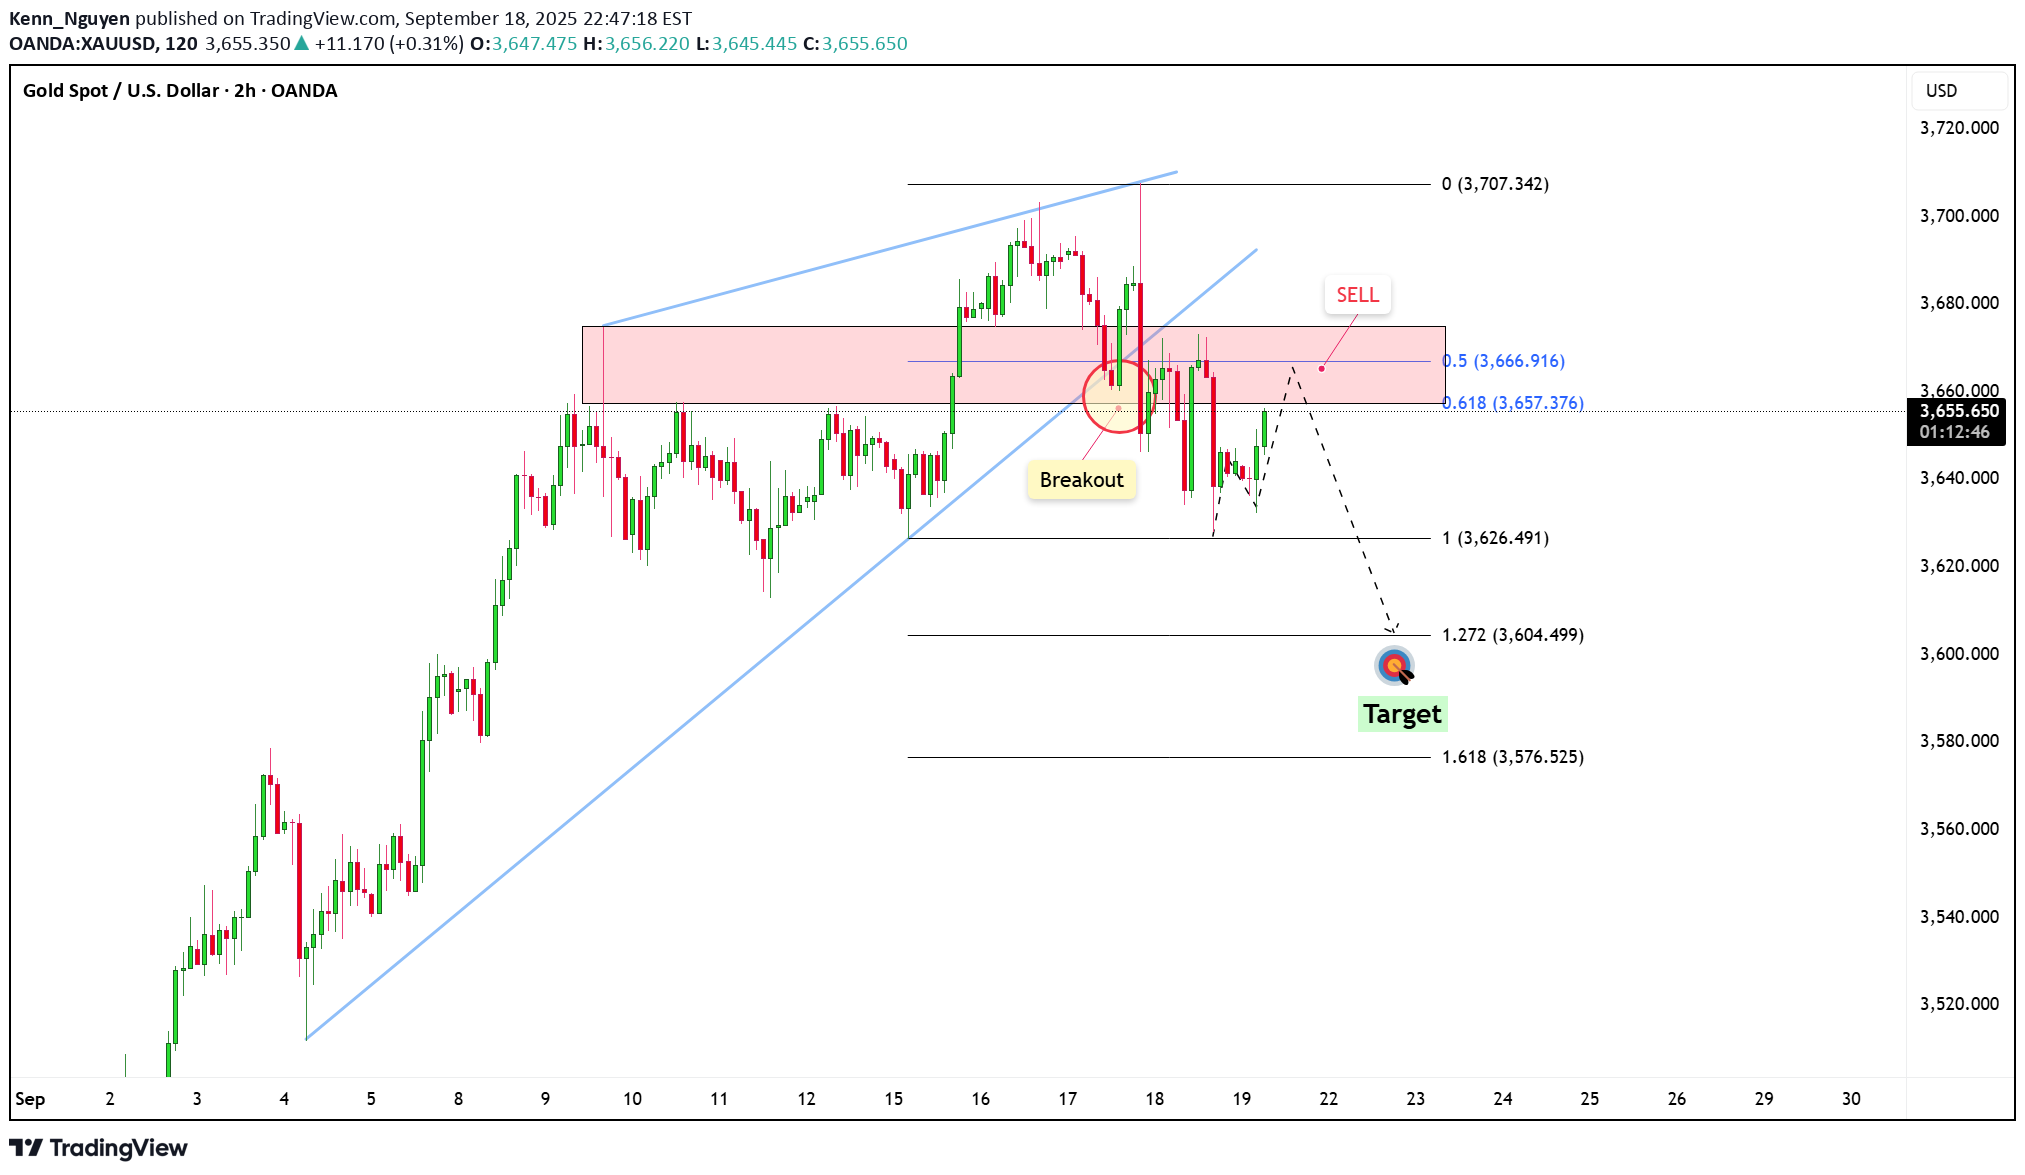
Hey everyone, looking at XAUUSD today, I noticed something quite interesting. Gold has reached an important resistance level, one that in the past has acted as a strong barrier, pushing the price down. This area has also been a strong supply zone, where sellers have previously taken control of the market. Therefore, it becomes a "hot" spot for those looking for shorting opportunities. If the price starts showing bearish signals, such as rejection wicks, bearish candlestick patterns, or signs of weakening buying pressure, I think there's a good chance we could see a drop towards 3,604, and possibly even lower to 3,5XX if the selling pressure remains strong. However, if the price breaks this resistance clearly, the bearish outlook might be invalidated, and we could see a further rally. This is just my personal view on the support and resistance levels, not financial advice. Always double-check your signals and ensure proper risk management. Good luck with your trades!
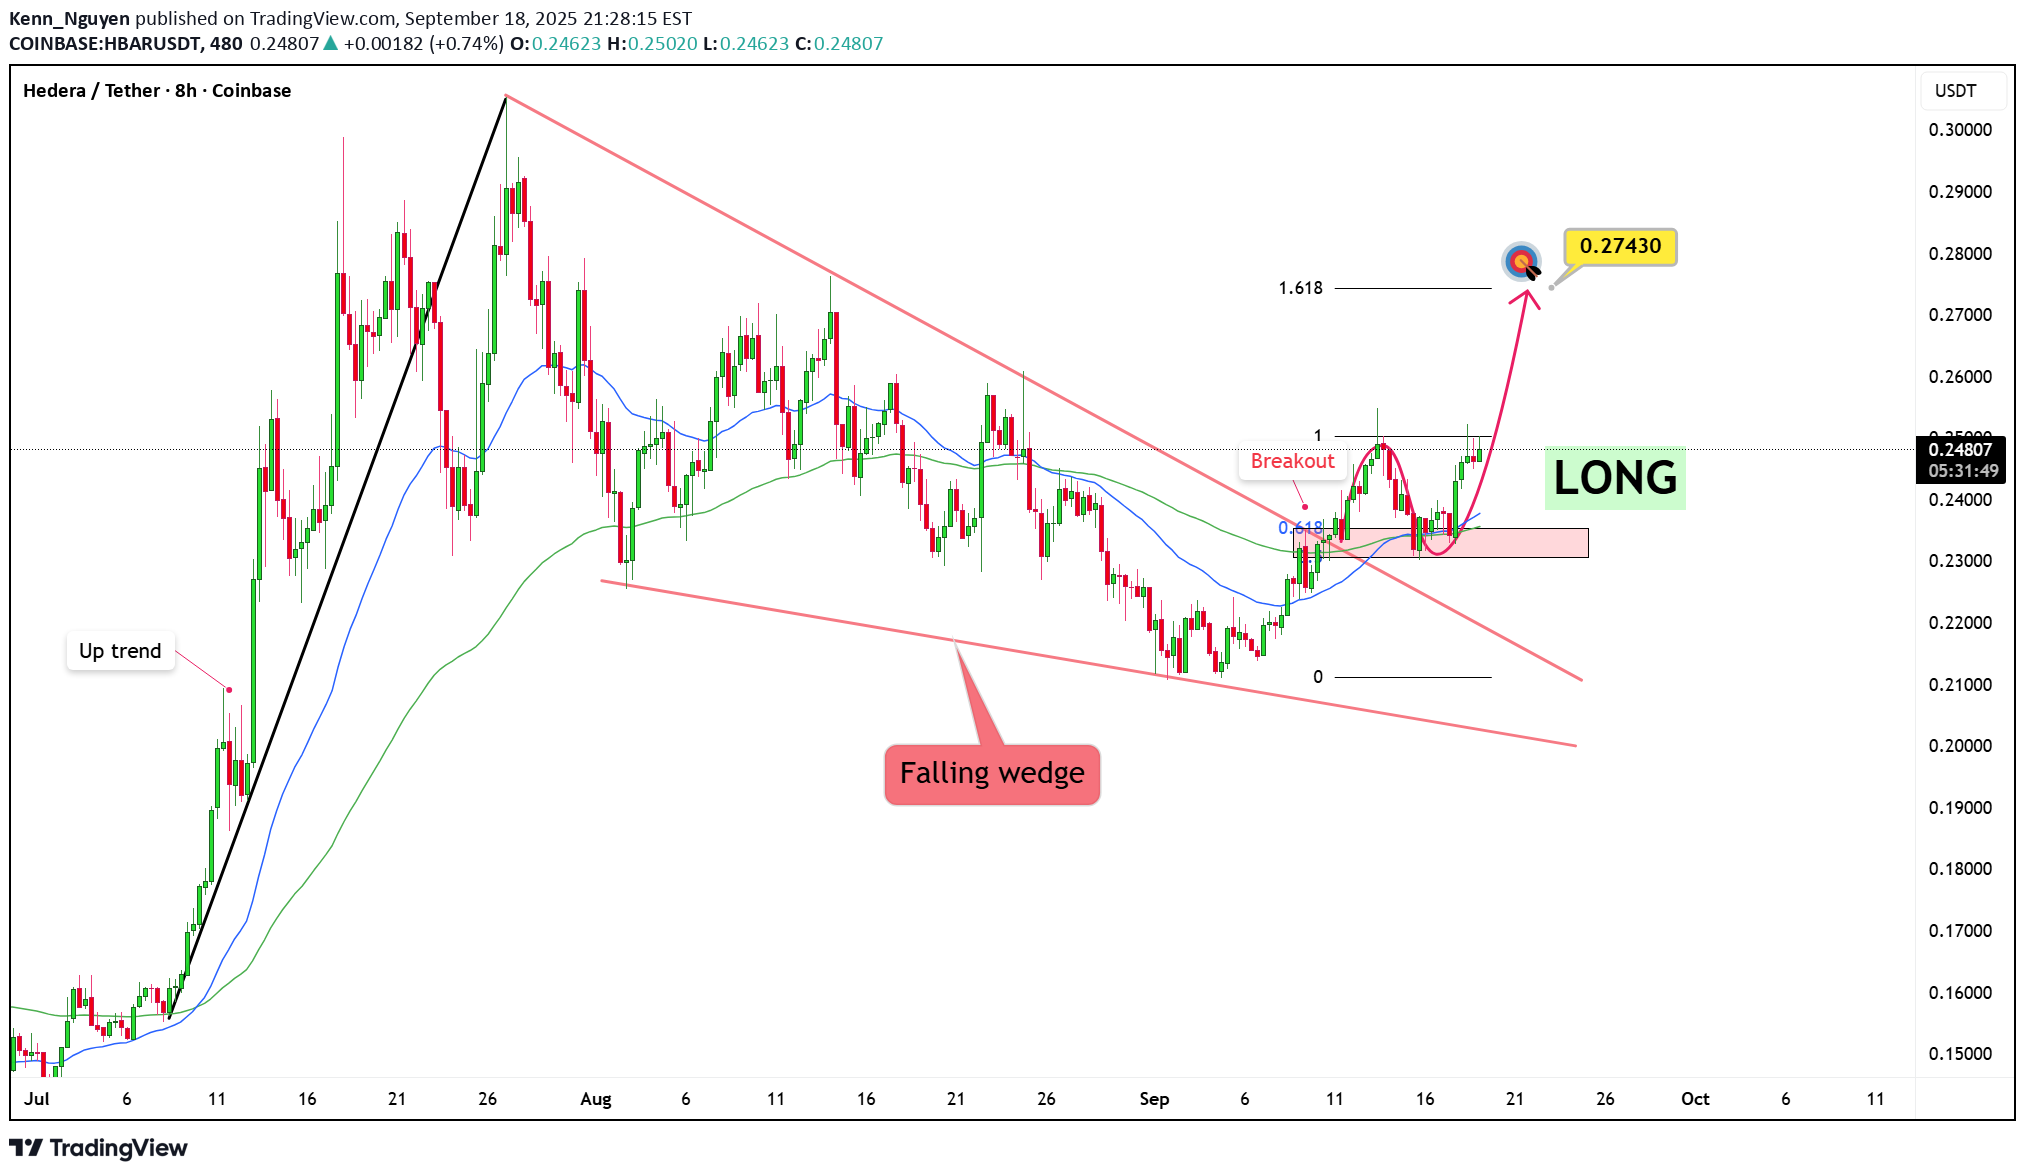
The HBARUSDT market is looking incredibly bullish! We've just seen a strong shift from a downtrend to an uptrend, creating a perfect opportunity to go long. The price has broken through a key resistance level, then pulled back to retest it – a textbook breakout & retest setup. This highlights the strength of the bullish momentum. Now, with the price rejecting that level and turning it into new support, this is a strong long signal with the next target in sight! My target is 0.27430. Let’s get ready for the next move!
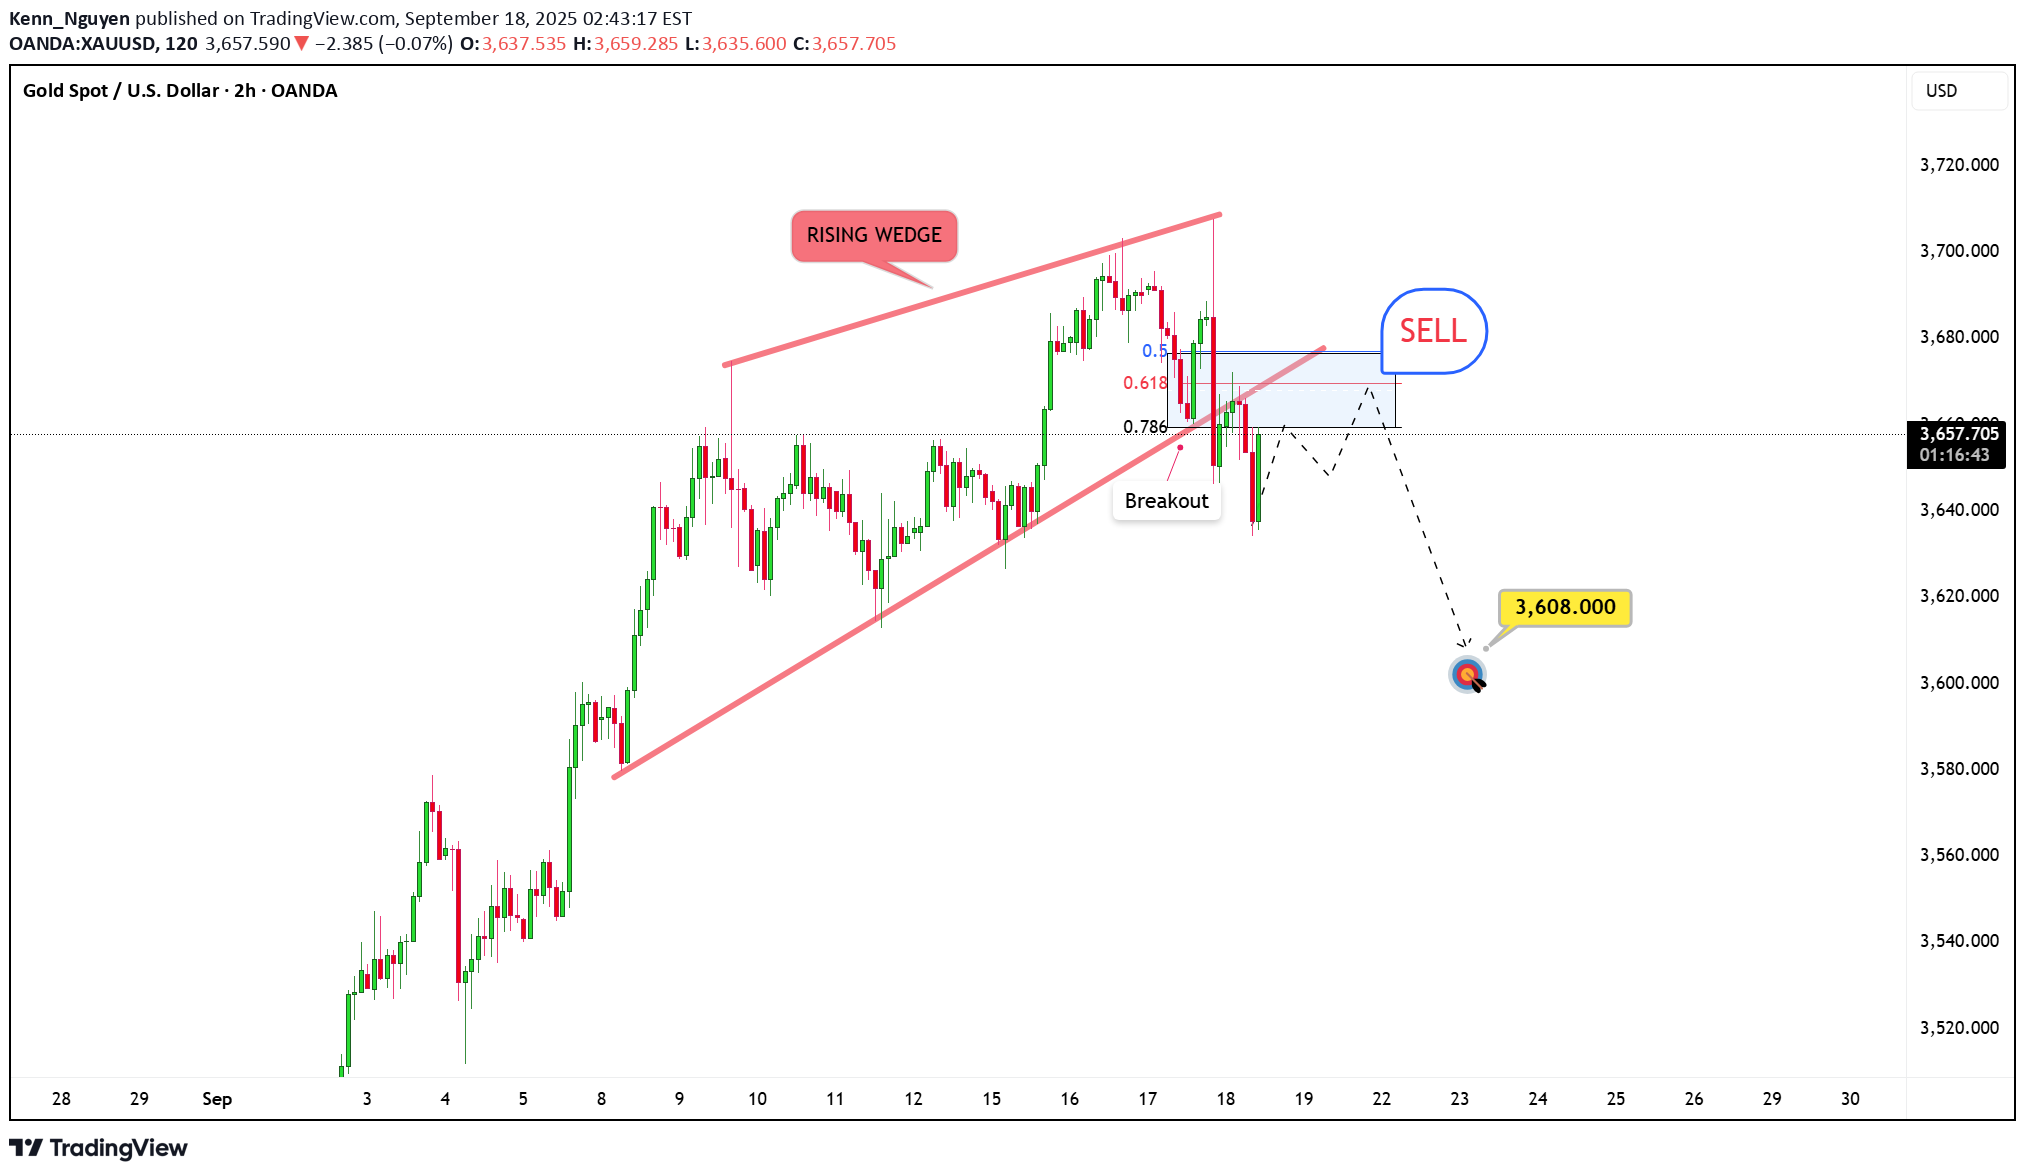
Hi everyone, it’s Ken! On the 2H chart, after careful observation, we can see a RISING WEDGE pattern forming. After XAUUSD broke the previous uptrend and completed its correction phase, there's a high likelihood that a new bearish trend will emerge, continuing the short-term downtrend we've seen recently. Ken's target is to push the price below 3,630, aiming for a further low at 3,608 – this level perfectly aligns with Fibonacci 1.618. What about you? Do you think XAUUSD will continue to drop, or is there a chance for a reversal to the upside? Share your thoughts and targets in the comments!Added: The Fibonacci 1.618 level I’m referring to -Learn more about this pattern in this educational article: "Explore the Two Variations of the Rising Wedge Pattern." -
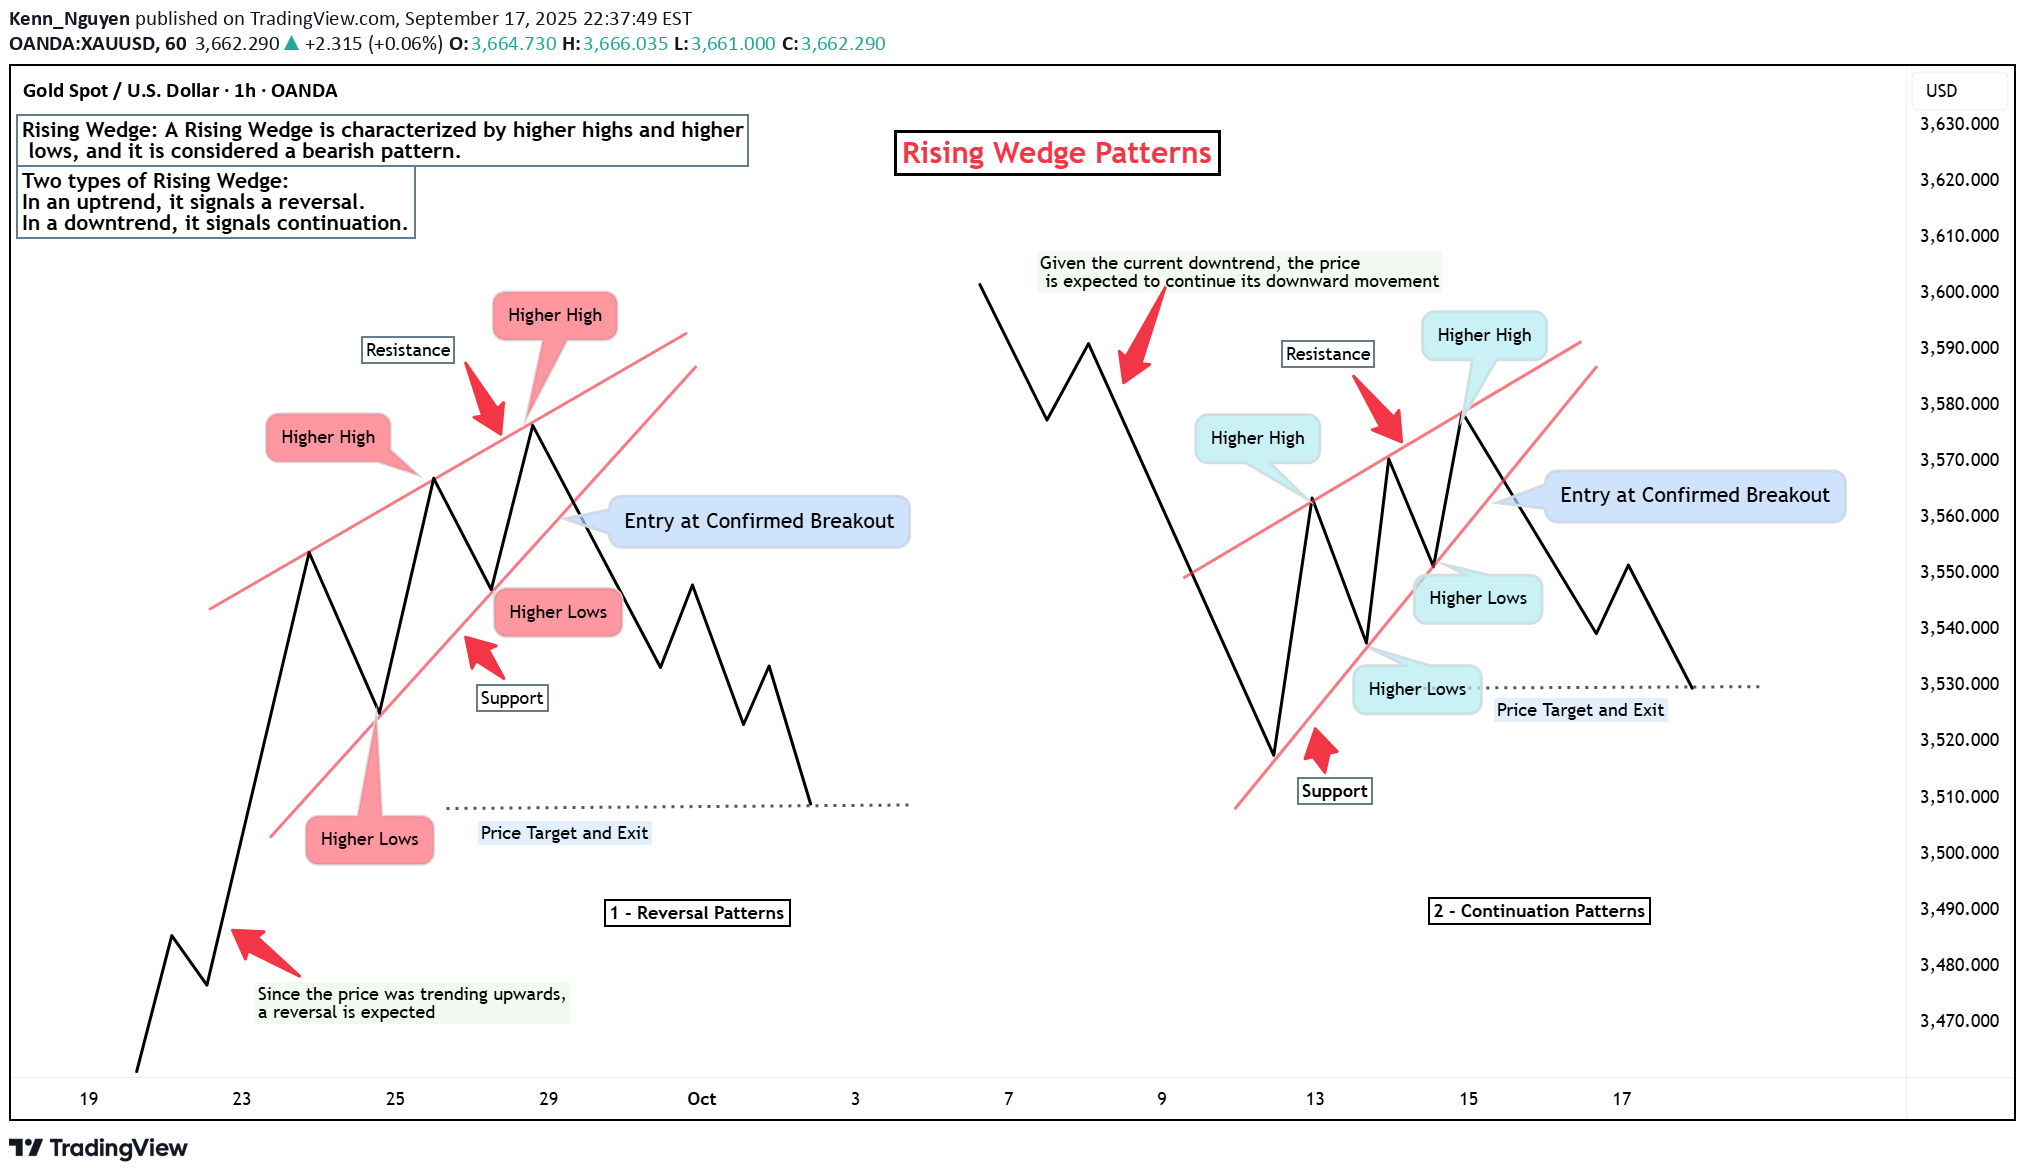
Hello everyone! When I first started learning technical analysis, one of the patterns I found incredibly interesting and important was the Rising Wedge pattern. This pattern is formed when the price creates higher highs and higher lows, but the price range gradually narrows. However, there’s something that few people know – the Rising Wedge pattern can appear in two different forms, and each form has significant implications for predicting market trends. Form 1: Rising Wedge in an Uptrend (Reversal) The first and most common form of the Rising Wedge is when it appears in an uptrend. This pattern signals that the uptrend is losing momentum. When I identify this pattern, I know the market is weakening and is likely to reverse into a downtrend. Characteristics: The price creates higher highs and higher lows, but the range of price movement narrows, and trading volume typically decreases. Confirmation: A breakout below the support at the bottom of the Rising Wedge confirms a trend reversal. When this pattern forms, I prepare to enter a short trade when the price breaks the support at the bottom of the pattern. This is when the market could start to reverse and move downward. Form 2: Rising Wedge in a Downtrend (Continuation) The second form of the Rising Wedge appears in a downtrend. Although it may look similar to the first form, its purpose is different. This pattern does not signal a reversal, but instead indicates that the downtrend will continue after the price breaks below the bottom of the pattern. Characteristics: Similar to the pattern in the uptrend, the price also creates higher highs and higher lows, but the price narrowing occurs within a downtrend. Confirmation: Once the price breaks below the bottom of the pattern, it is expected to continue the strong downward movement. In this case, I do not rush to enter a buy trade because this pattern signals that the downtrend is still strong. After the price breaks below the bottom of the pattern, I will consider entering another short trade. In Summary The Rising Wedge pattern is an incredibly useful tool for technical analysis to identify changes in price trends. Whether in an uptrend or downtrend, this pattern can provide great trading opportunities if you know how to identify and act on it promptly. In an uptrend: The Rising Wedge signals weakness and a potential reversal. In a downtrend: The Rising Wedge signals the continuation of the downward trend. Understanding these two forms helps me make more accurate trading decisions and manage risk more effectively in any market condition.
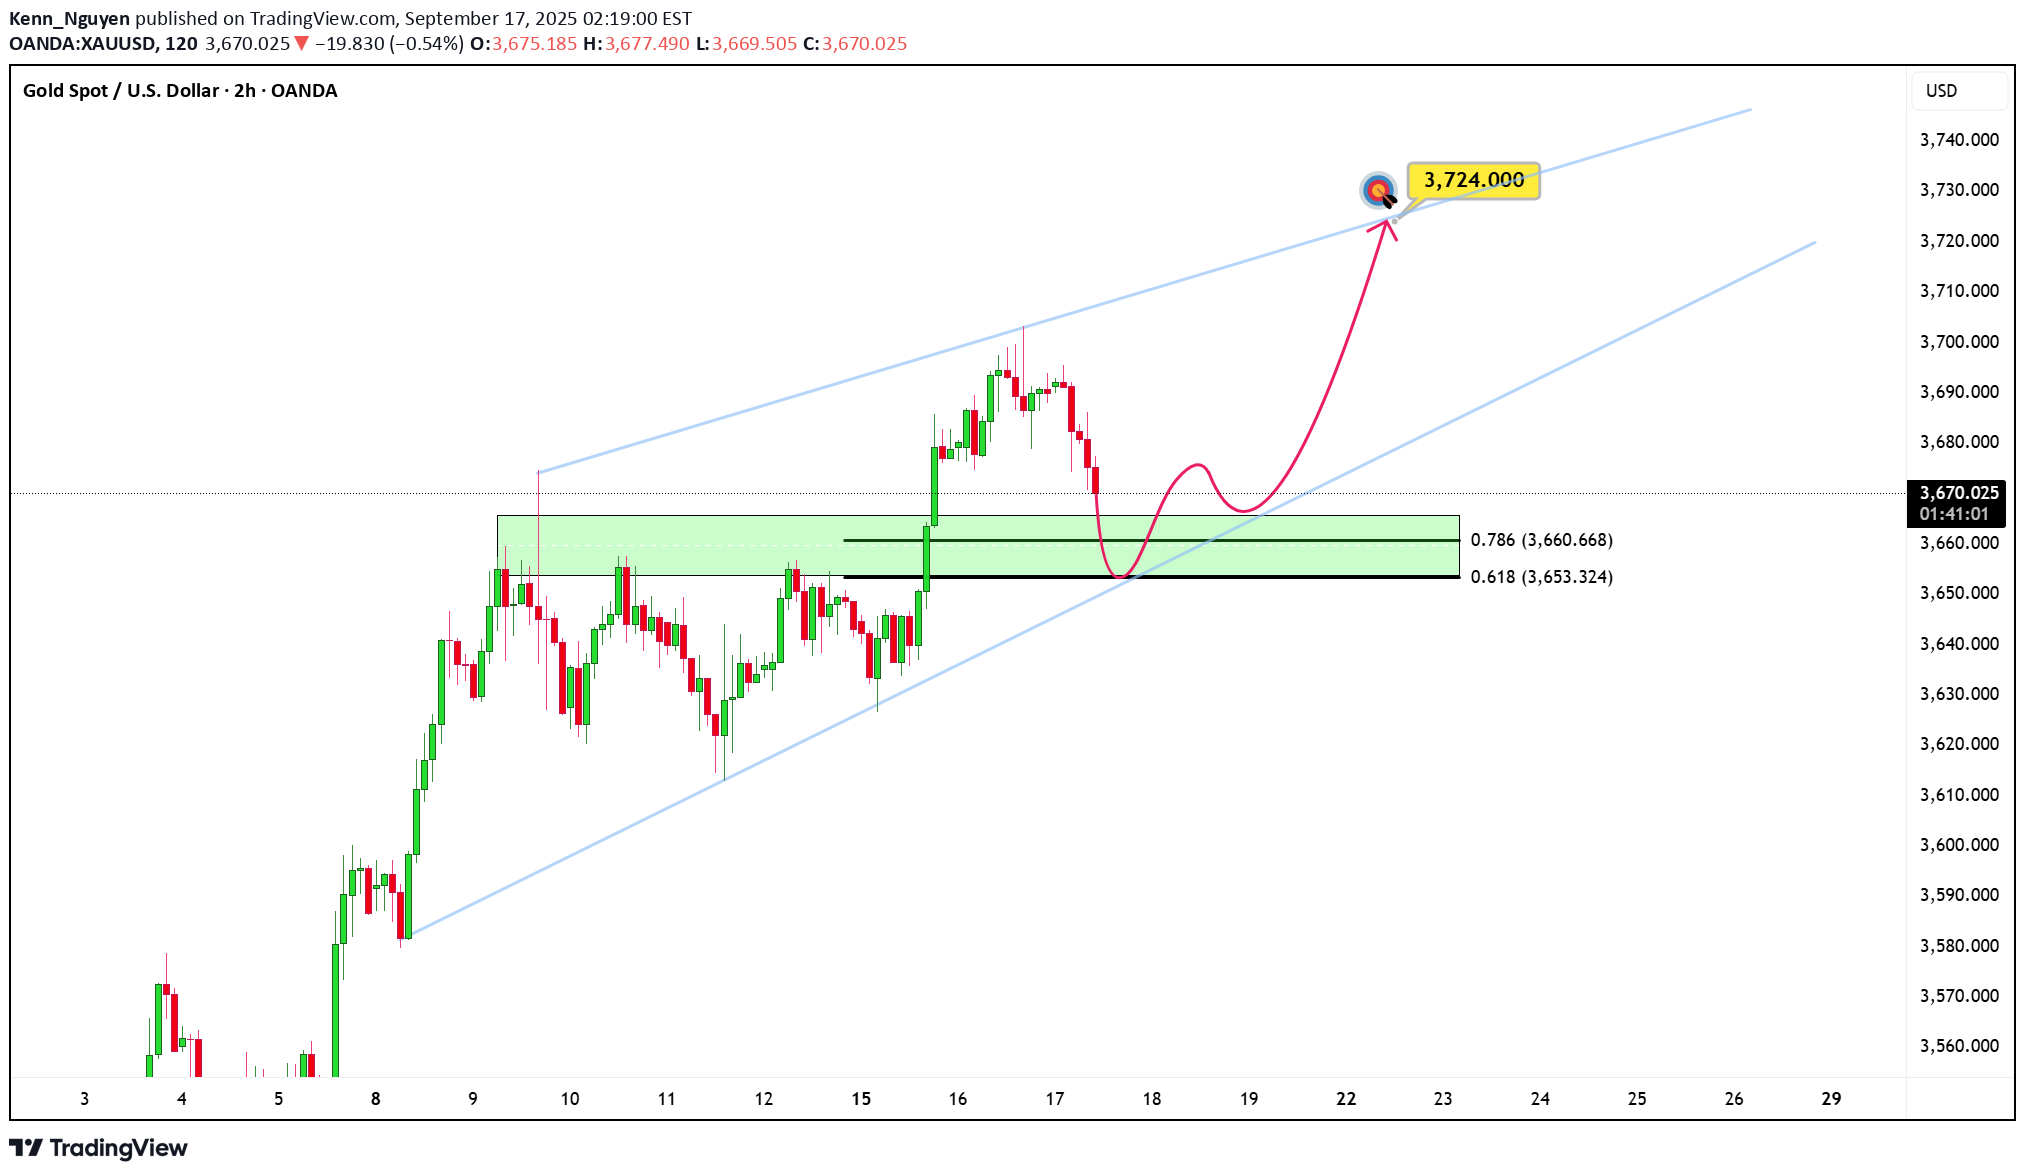
Hey everyone, Ken here! I'm keeping a close eye on XAUUSD, and right now, gold is approaching a very important support zone that I’ve shared before. This level is not only reinforced by strong buying pressure but also aligns with the trendline, making the potential for a bounce here very high. If price confirms support here through strong price action, such as long lower wicks or a bullish engulfing candle, I believe gold will reverse and target 3,724, a reasonable goal given the current market structure. However, if price breaks and holds below this support zone, the bullish trend will be invalidated, and we could see a sharp decline. This is my personal opinion, not financial advice. Always assess your setups and ensure proper risk management when trading! Good luck with your trades!
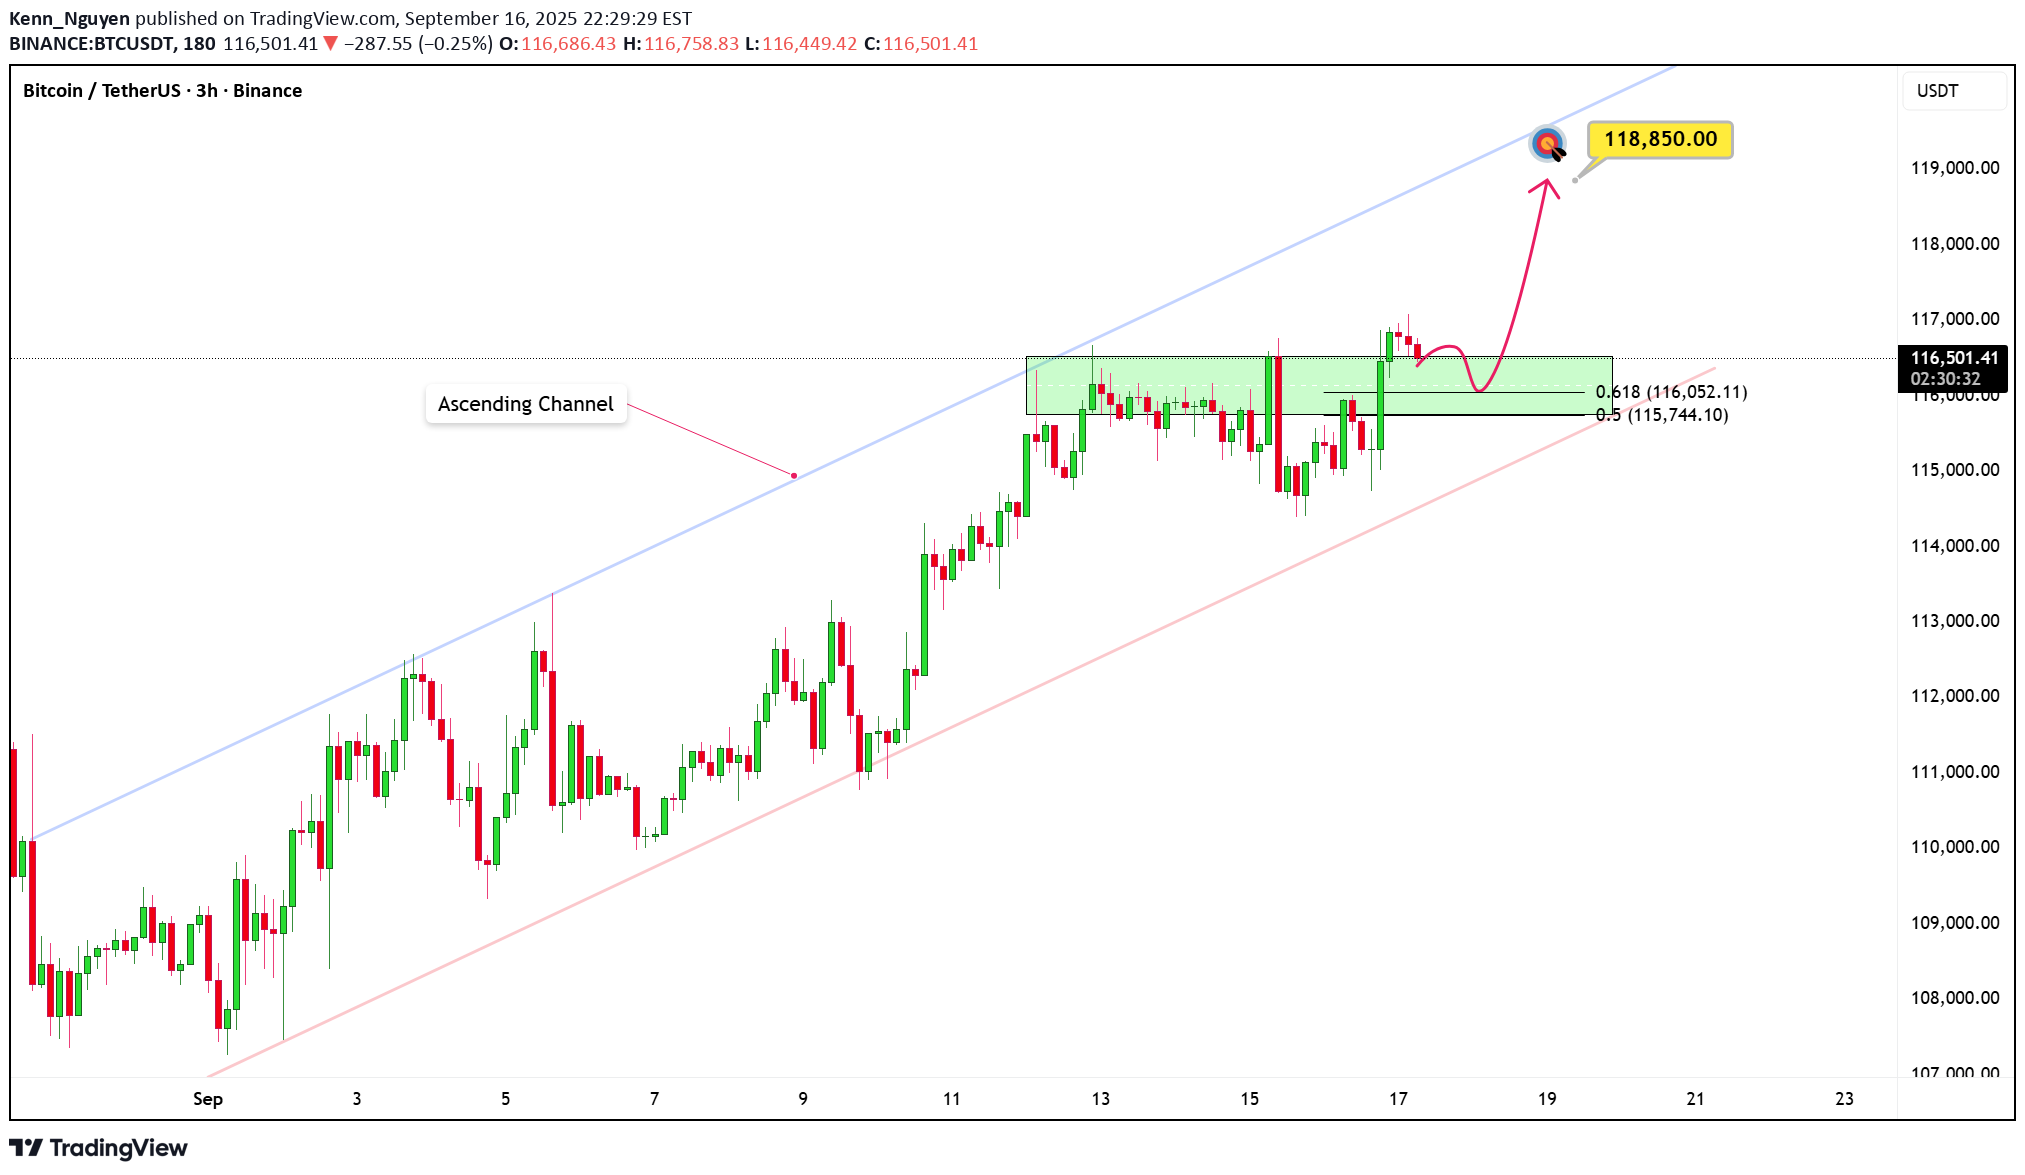
Hello everyone, Ken here! Let’s dive deeper into the current price action of Bitcoin. As you can see, price is moving within a clear upward channel, signaling strong bullish momentum. After a sharp rise, the price has slightly pulled back to retest the broken resistance. This is a classic break and retest setup within a larger channel, a popular trading pattern I often use. The key point here is that if this level holds as support, buyer confidence will be further solidified. And we’re already seeing that happen! With this momentum, I believe 118,850 USDT is the next target, where the price could reverse depending on market reactions at that point. Wishing you successful trades and a disciplined strategy!Bitcoin is rising
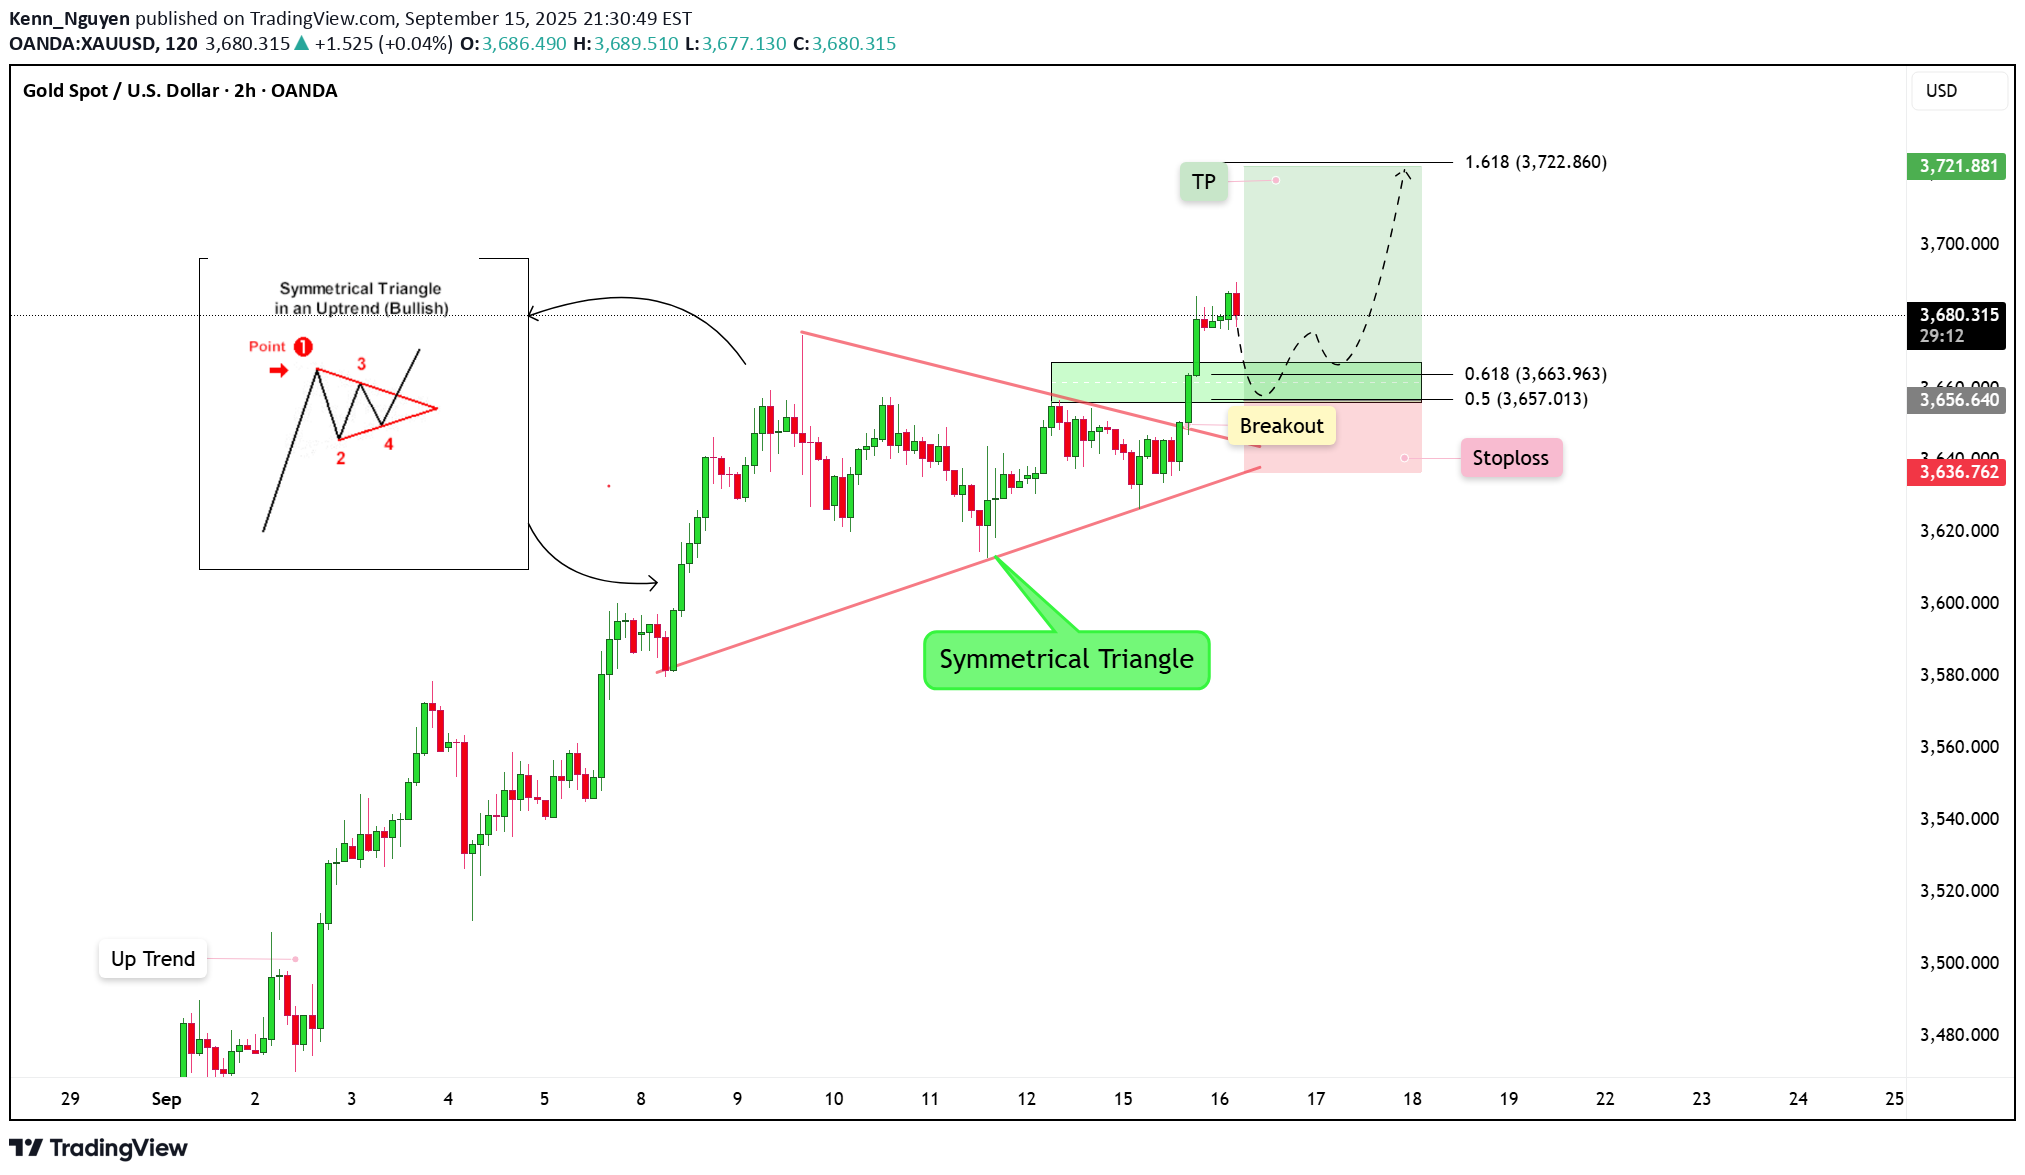
Over the past few sessions, I’ve observed gold consolidating within a Symmetrical Triangle after a strong bullish move. From my experience, this pattern often represents a “pause for breath” before the market resumes its primary trend. What caught my attention most is that price has just broken above the upper boundary of the triangle, signaling a clear breakout. That said, I won’t be rushing into a trade. I always prioritize safety, so I’ll wait for price to retest the breakout zone. If the former resistance holds as new support and shows strong rejection, that will be my ideal entry point. Based on my projection, the upside target for this setup is around 3,720 USD. For risk management, I would place the stoploss either below the lower boundary of the triangle or just under the breakout zone, depending on risk appetite. On the H2 timeframe, this Symmetrical Triangle setup looks highly reliable since it aligns with the broader bullish trend. If the breakout holds, I believe gold still has plenty of room to climb higher.
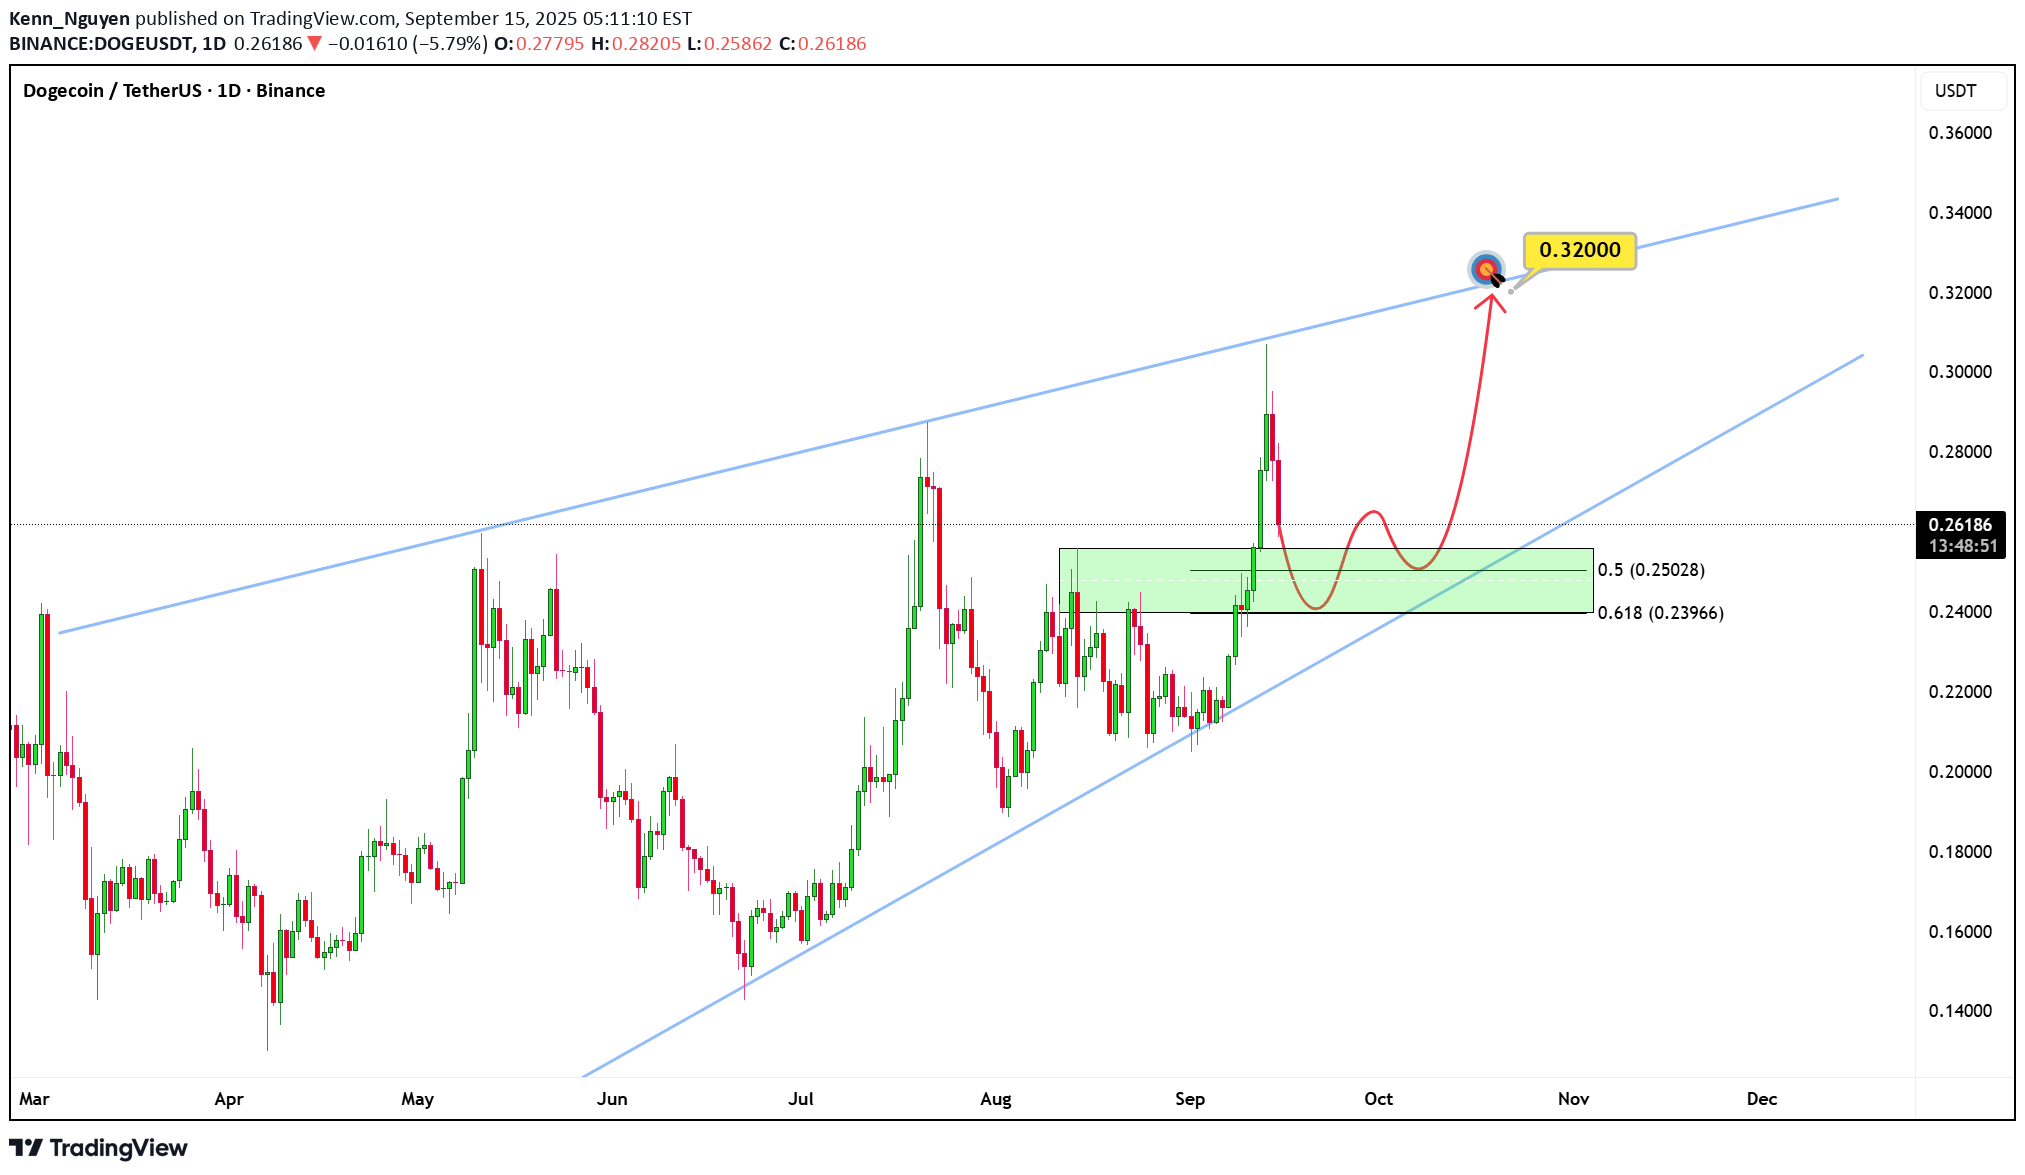
Hey everyone, Ken here! Right now, I'm closely watching DOGUSDT and it seems like it might be going through a correction phase as the price tests the lower boundary of the rising channel. This is a key level, and if the price bounces from here, I believe it could continue towards the next target around 0.3200. However, if the price breaks below this support, the bullish outlook would weaken, and we could see further declines. That’s why I always pay close attention to price action and trading volume to identify solid buying opportunities. Risk management is essential in trading, so I always make sure to carefully confirm setups and trade with caution. What do you think about the current situation? Feel free to share your thoughts in the comments!
Disclaimer
Any content and materials included in Sahmeto's website and official communication channels are a compilation of personal opinions and analyses and are not binding. They do not constitute any recommendation for buying, selling, entering or exiting the stock market and cryptocurrency market. Also, all news and analyses included in the website and channels are merely republished information from official and unofficial domestic and foreign sources, and it is obvious that users of the said content are responsible for following up and ensuring the authenticity and accuracy of the materials. Therefore, while disclaiming responsibility, it is declared that the responsibility for any decision-making, action, and potential profit and loss in the capital market and cryptocurrency market lies with the trader.