
Kene247
@t_Kene247

What symbols does the trader recommend buying?
Purchase History
پیام های تریدر
Filter
Kene247
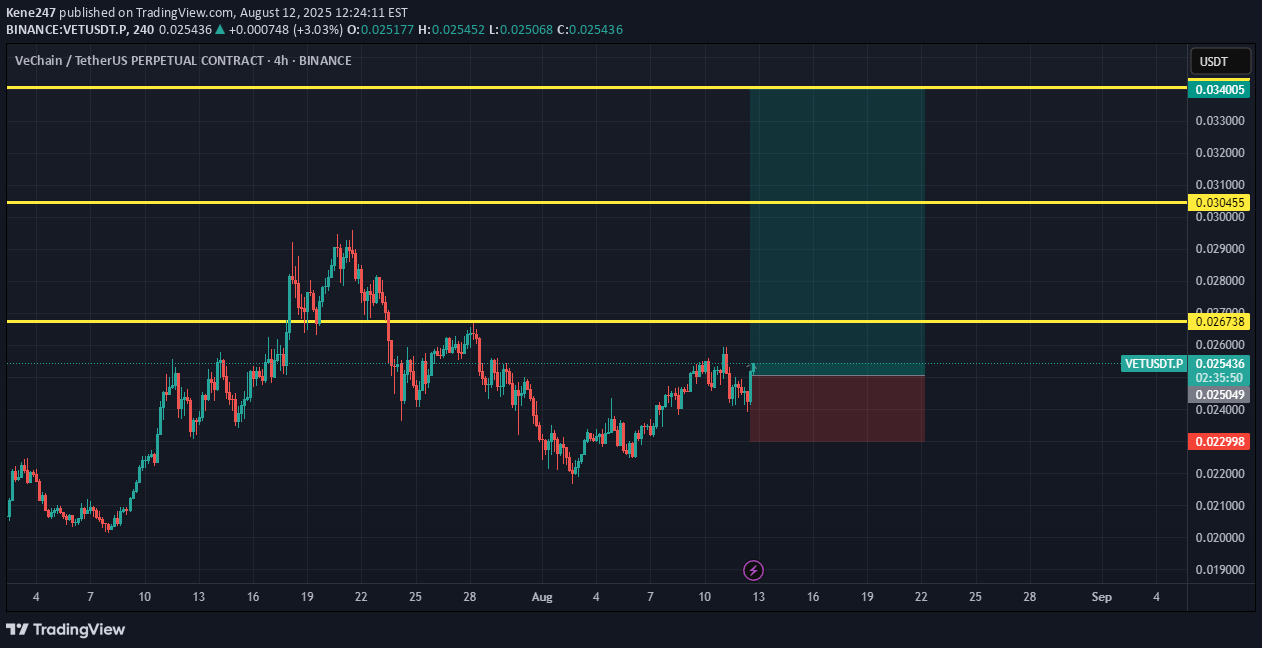
$VET ready to pump??
Kene247
$SOLUSDT about to make a new ATH!!
Kene247
$ETHUSDT finally ready to break out of weekly range and rally!!!
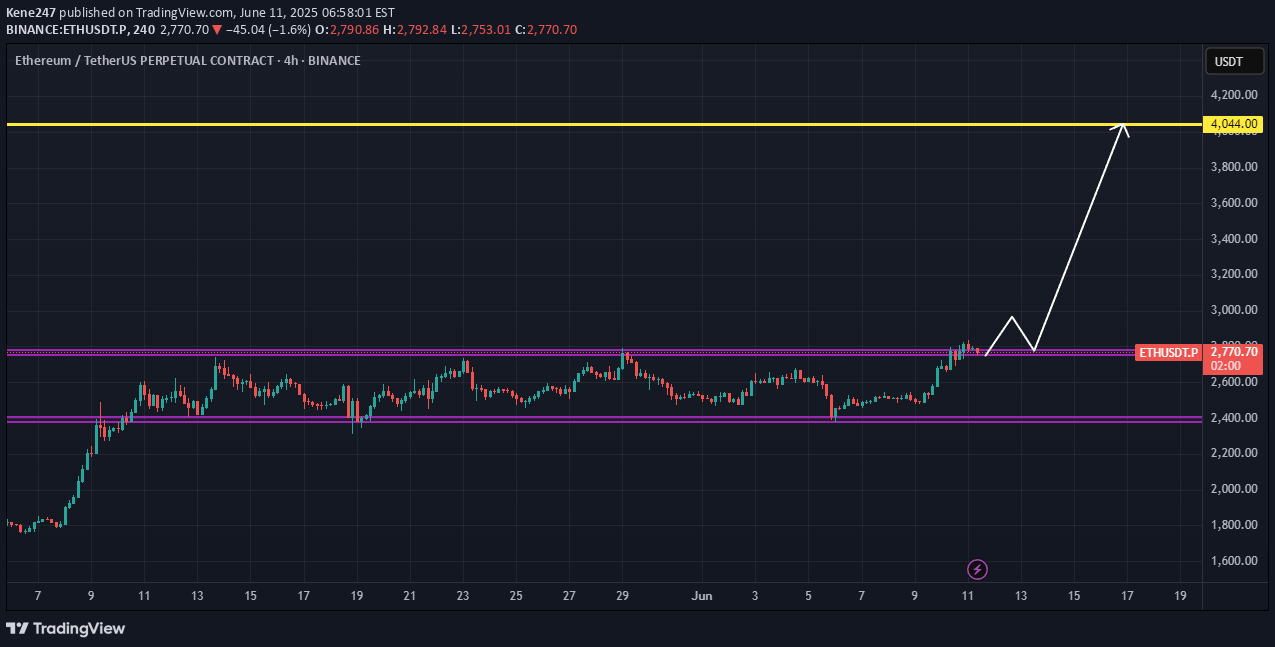
ETHUSDT seems to be ready to break out of its range that has lasted for over a month. So if it properly breaks out from this range and retests the resistance zone which tends to turn to support zone afterwards, it will likely head to the next resistance zone around $4000.Kindly support this post to help reach other people and do comment your thoughts about the setup.https://www.tradingview.com/x/Kchq0LTa/
Kene247
Will $BTC drop back to 91k??

BTCUSDT seems to be running out of steam after its bullish rally last month. A decent retracement is needed to enable gain some momentum for further bullish move.Having broken out of the bullish trendline and also a minor support zone, BTCUSDT has retested this zone, hence making it a resistance zone. It is expected to drop to 99k zone as the first target and if it does not hold, then a drop to 91k zone should be expected.Kindly support this analysis to enable it reach to other people, and do comment your thoughts.https://www.tradingview.com/x/t3jOVwGL/
Kene247
$WIFUSDT pushing towards $1.50

WIFUSDT shows a bullish breakout from a descending wedge pattern following a strong uptrend. This suggests a high probability of continued upward momentum, with the primary target being the resistance zone around $1.50 already marked out on the chart with a yellow line.TP1: $1.20TP2: $1.50Kindly support this analysis to enable it reach to other people, and do comment your thoughts.https://www.tradingview.com/x/hstcJe2l/
Kene247
Is $BTCUSDT going to 91k ??

This BTCUSDT chart reveals that Bitcoin has been trading within a clear ascending channel. This pattern typically suggests bullish momentum, with price making higher highs and higher lows. However, the most recent price action shows a decisive break down below the lower trendline of this channel. This breakdown suggests a potential shift in the short-term bias from bullish to bearish.The setup strongly suggests a short trading opportunity. The breakdown from the ascending channel, coupled with the potential supply zone above, provides a bearish setup.Entry: A potential entry point would be a retest of the broken lower trendline of the channel or within the highlighted red supply zone.Target 1: The immediate target is the horizontal purple support level around 96,000.Target 2: If the 96,000 support breaks, the next target would be the stronger horizontal yellow support level around 91,000.Kindly support this analysis to enable it reach to other people, and do comment your thoughts.
Kene247
$AUCTIONUSDT ready to pump after putting a bullish divergence

AUCTIONUSDT has been very bearish for weeks following a massive drop. it did put a double bottom and a bullish divergence, which are signs of market reversal i.e. a shift from bearish trend to bullish move. It broke the resistance zone which also serves as the neckline for the double bottom/bullish divergence formed. A retest of this resistance zone now turned to a support zone, gives a bullish setup as AUCTIONUSDT tends to continue its new found bullish move.Be on the look out and expect minor retracements while at it, as there are some support and resistance zones it can bounce off from. These zones are already marked out in the setup.Expected Targets:TP1: $17TP2: $20TP3: $24TP4: $28Kindly support this analysis to enable it reach to other people, and do comment your thoughts.https://www.tradingview.com/x/bpEee2IM/
Kene247
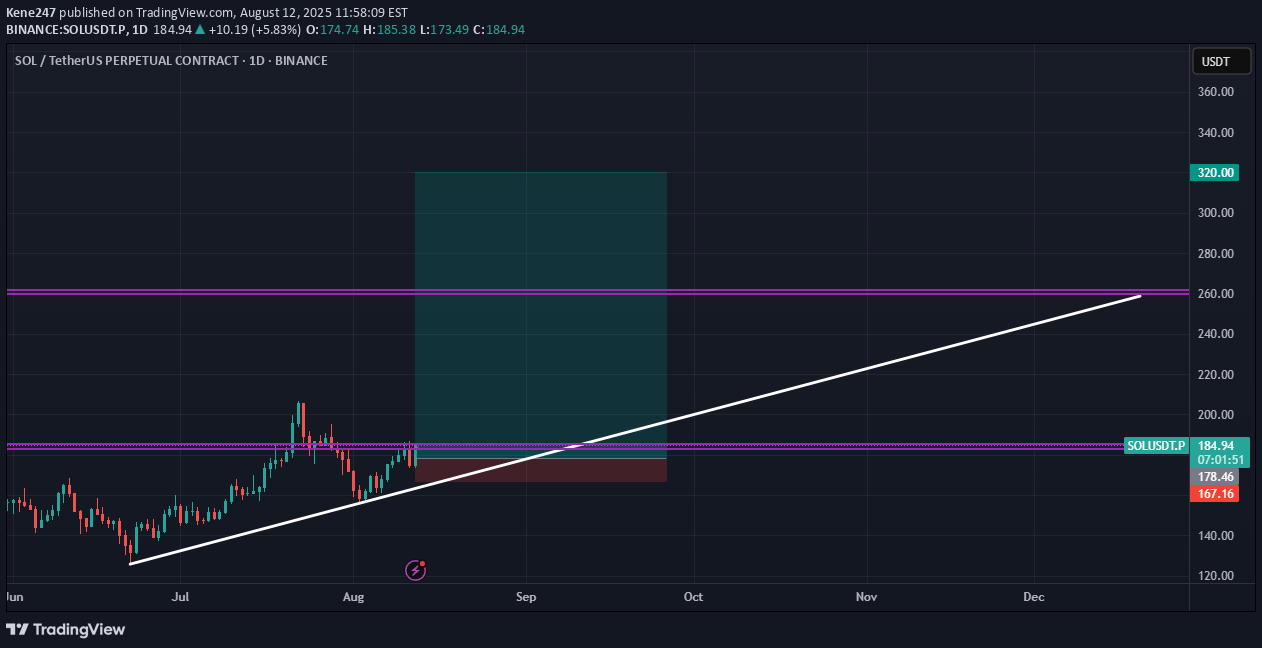
$SOLUSDT likely to retrace for a bigger bullish move!!!

SOLUSDT looks like it is running out of steam as it approaches a major resistance. In the coming weeks, SOLUSDT is expected to retrace back to a minor support and resistance zone (marked out in the chart) where it will gain reasonable momentum for a bigger pump to at least $260 and above. Be on the lookout.Kindly support this analysis to enable it reach to other people, and do comment your thoughts.https://www.tradingview.com/x/3Lp4fdfW/
Kene247
$BONKUSDT back to ATH!!!

Having broken a long term bearish trendline and a resistance zone as well. BONKUSDT has retested this resistance zone, turning it to support. It has turned bullish and fully ready to push back to its ATH and above. Be on the look out and expect minor retracements while at it, as there are some support and resistance zones it can bounce off from. These zones are already marked out in the setup.Kindly support this analysis to enable it reach to other people, and do comment your thoughts.https://www.tradingview.com/x/GqIt7Ao3/
Kene247
$PEPEUSDT about to make a huge bullish move

After a long bearish move, PEPEUSDT has finally broken out of its bearish trendline and also a resistance zone. It is about to retest the resistance zone which will turn to a support zone, and then kick-off a huge bullish rally to the previous ATH (All Time High), and possibly way above it.Be on the look out and expect minor retracements while at it as there are some support and resistance zones it can bounce off from. These zones are already marked out in the setup.Do comment your thoughts regarding the analysis, and boost it so it gets to others.
Disclaimer
Any content and materials included in Sahmeto's website and official communication channels are a compilation of personal opinions and analyses and are not binding. They do not constitute any recommendation for buying, selling, entering or exiting the stock market and cryptocurrency market. Also, all news and analyses included in the website and channels are merely republished information from official and unofficial domestic and foreign sources, and it is obvious that users of the said content are responsible for following up and ensuring the authenticity and accuracy of the materials. Therefore, while disclaiming responsibility, it is declared that the responsibility for any decision-making, action, and potential profit and loss in the capital market and cryptocurrency market lies with the trader.