
KeleabetsweMaseko
@t_KeleabetsweMaseko

What symbols does the trader recommend buying?
Purchase History
پیام های تریدر
Filter
KeleabetsweMaseko
XRP 1H Chart Analysis - Breakout Potential
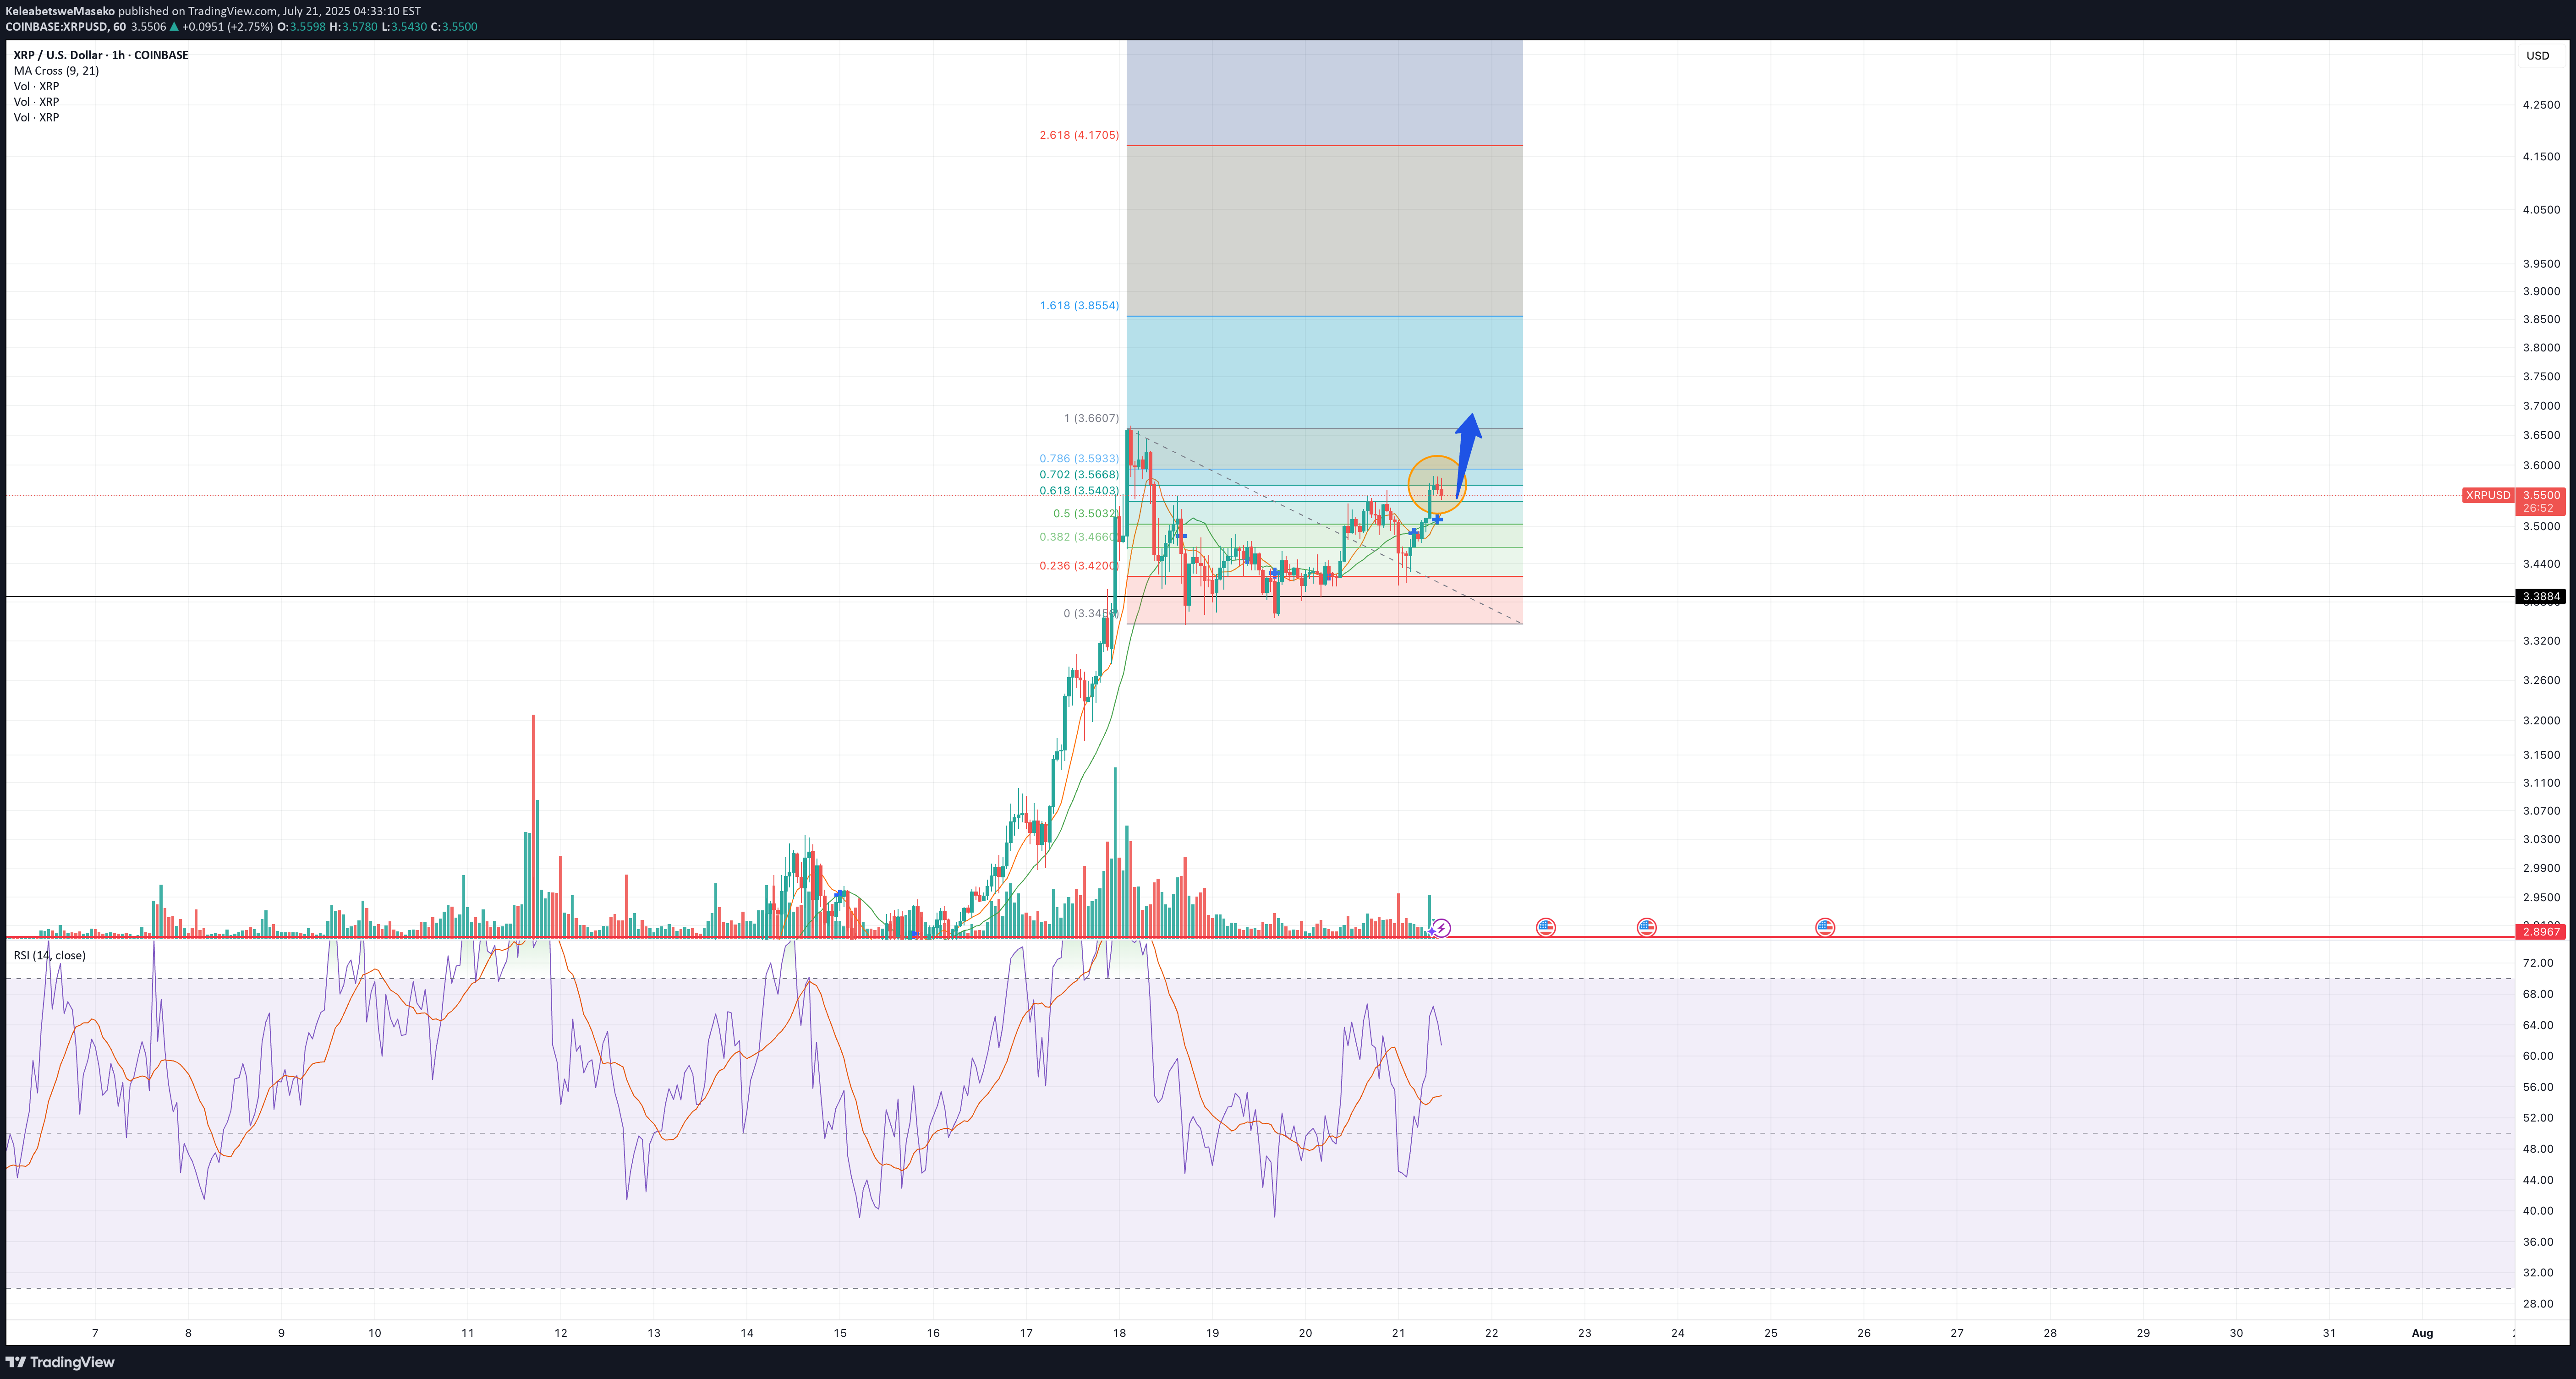
The price is currently testing the 0.702 resistance level on the 1H chart, a key zone with historical rejections. A decisive break above 0.702, confirmed by a strong bullish candle and higher volume, could target 1.363. If the price breaks above 1.000 with solid confirmation, XRP might enter price discovery, pushing toward uncharted highs. Key Levels: Resistance: 0.702 (current), 1.000 (major), 1.363 (next target) Support: 0.469, 0.382, 0.236 Strategy: Enter long on a confirmed break above 0.702, aiming for 1.363, with a stop-loss below 0.469 (1:2 risk-reward). For a 1.000 breakout, go long with a stop-loss below 0.702, using a trailing stop as prices extend. Watch for volume spikes to validate moves. Alerts: Set an alert at 0.702 for a 1% break above. Add an alert at 1.000 for a 1% break above to catch price discovery. Stay cautious of false breakouts and monitor real-time data for confirmation.
KeleabetsweMaseko
KeleabetsweMaseko
The Graph Getting Ready

While the market has be experience some volatility we now wait for GRT to make a break on the resistance, it nearly there and hopefully once it clears it we can enjoy the rise up before coming face to face with another resistance
KeleabetsweMaseko
XRP Long term bullish

_Current Market Conditions:_As of December 2, 2024, XRP is trading at approximately $2.44 USD, with a 24-hour trading volume of $10.2 billion USD. The cryptocurrency market is experiencing a period of high volatility._Technical Analysis:_XRP is nearing its all-time high (ATH) of $3.84 USD, set on January 4, 2018. A breakout above this resistance level could trigger a significant price increase, sending XRP into price discovery mode._Key Levels to Watch:_- Resistance: $3.84 USD (ATH)- Support: 0.618 Fibonacci retracement level (approximately $2.15 USD)- Price Discovery Targets: $7.00 USD, $13.00 USD, $21.00 USD_Market Sentiment:_The overall market sentiment for XRP is extremely bullish, with many traders and investors expecting a breakout above the ATH. A successful break could lead to a significant price increase, with targets in the $7.00 USD to $21.00 USD range._Trading Strategy:_- Long-term investors: Consider holding XRP, with a target price of $21.00 USD.- Short-term traders: Watch for a breakout above $3.84 USD. If successful, consider entering a long position with a target price of $7.00 USD._Risk Management:_- Set stop-loss orders below the 0.618 Fibonacci retracement level (approximately $2.15 USD) to limit potential losses.- Consider scaling into positions to manage risk and maximize potential gains.In conclusion, XRP is nearing a critical breakout level, and a successful breach of the ATH could trigger a significant price increase. Traders and investors should be prepared for a potential price discovery mode, with targets in the $7.00 USD to $21.00 USD range.
KeleabetsweMaseko
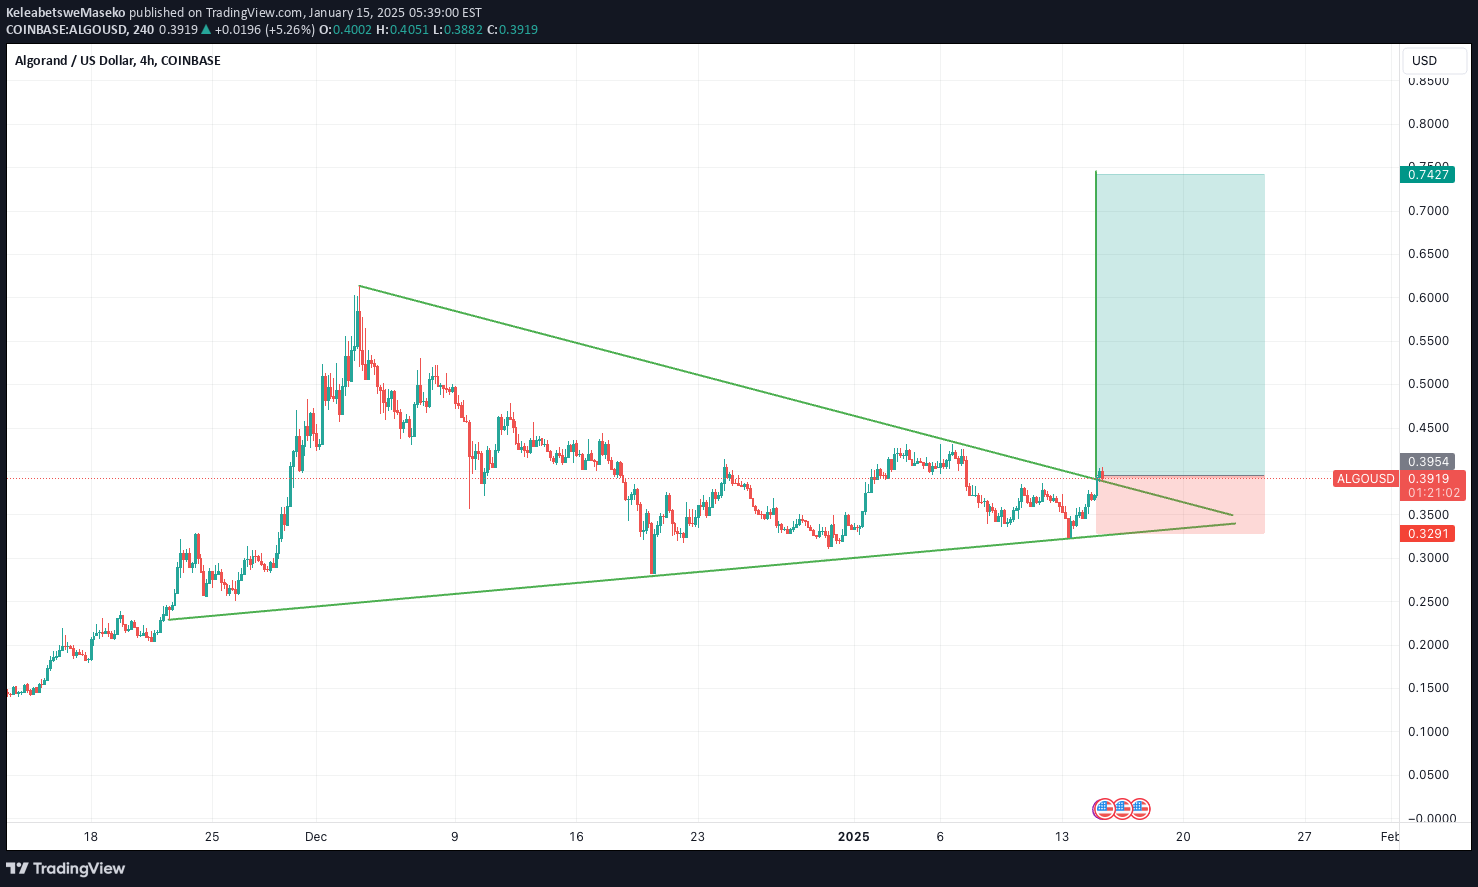
Algorand (ALGO) Market Analysis

Current Market ConditionsAs of December 2, 2024, Algorand (ALGO) is trading at approximately $0.48 USD, with a 24-hour trading volume of $1.96 billion USD. The cryptocurrency market is experiencing a period of moderate volatility.Technical Analysis:The ALGO/USDT chart is showing a potential breakout scenario. The price is currently consolidating below the 0.236 Fibonacci retracement level, which is acting as a resistance. A successful break above this level could trigger a significant price increase.Key Levels to Watch:- Resistance: 0.236 Fibonacci retracement level (approximately $0.53 USD)- Support: 0.382 Fibonacci retracement level (approximately $0.38 USD)- ATH: $3.28 USD (reached on June 21, 2019)Market Sentiment:The overall market sentiment for ALGO is bullish, with many traders and investors expecting a breakout above the 0.236 Fibonacci retracement level. A successful break could lead to a significant price increase, potentially reaching the ATH.Trading Strategy:- Long-term investors: Consider accumulating ALGO on dips, with a target price of $3.28 USD (ATH).- Short-term traders: Watch for a breakout above the 0.236 Fibonacci retracement level (approximately $0.53 USD). If successful, consider entering a long position with a target price of $1.50 USD.Risk Management- Set stop-loss orders below the 0.382 Fibonacci retracement level (approximately $0.38 USD) to limit potential losses.- Consider scaling into positions to manage risk and maximize potential gains.By closely monitoring the ALGO/USDT chart and watching for a breakout above the 0.236 Fibonacci retracement level, traders and investors can potentially capitalize on a significant price increase and reach the ATH.
KeleabetsweMaseko
Algorand Current Market Structure

Good Day Fellow TradersThe ALGO chart is currently exhibiting a short-term ABCD pattern, indicating a potential reversal or continuation. Throughout the last week, ALGO has demonstrated impressive gains, suggesting a robust bullish momentum.Support and Double Bottom ConfirmationALGO has found significant support at the $0.25 level, which is confirmed by a double bottom pattern. This support level serves as a crucial foundation for the potential bullish continuation.ABCD Pattern and Point D ProjectionThe ABCD pattern suggests that ALGO might be cooling off temporarily before resuming its upward trajectory. If the pattern plays out, we can expect ALGO to reach Point D, which could mark the beginning of another bullish leg.Bullish Continuation and Potential ATHUpon reaching Point D, ALGO may experience a bullish resurgence, potentially leading to new all-time highs (ATH). The double bottom confirmation and the ABCD pattern suggest that ALGO is poised for a continuation of its uptrend.ConclusionIn conclusion, the Algorand chart is exhibiting a short-term ABCD pattern, indicating a potential bullish continuation. The double bottom confirmation at $0.25 provides a solid support level, and reaching Point D could mark the beginning of another upward leg. As ALGO cools off temporarily, it may be preparing for a more significant bullish move, potentially leading to new all-time highs.
Disclaimer
Any content and materials included in Sahmeto's website and official communication channels are a compilation of personal opinions and analyses and are not binding. They do not constitute any recommendation for buying, selling, entering or exiting the stock market and cryptocurrency market. Also, all news and analyses included in the website and channels are merely republished information from official and unofficial domestic and foreign sources, and it is obvious that users of the said content are responsible for following up and ensuring the authenticity and accuracy of the materials. Therefore, while disclaiming responsibility, it is declared that the responsibility for any decision-making, action, and potential profit and loss in the capital market and cryptocurrency market lies with the trader.