
KeN-WeNzEl
@t_KeN-WeNzEl

What symbols does the trader recommend buying?
Purchase History
پیام های تریدر
Filter
KeN-WeNzEl
Trade Idea: Long XAUUSD (BUY STOP)
1️⃣ Multi-Timeframe Structure•1 Hour (Macro):•Trend: Bullish. 20 SMA is riding above the 50 SMA .•Price has broken above the prior resistance at 3374.50 and is now retesting it as support.•15 Minute (Tactical):•After a clear push down into 3340.37, price rallied back above 3374.50.•SMAs have flipped back bullish, and volume during the retest shows absorption of selling pressure.•3 Minute (Entry Precision):•Micro-green candle wicks show a small scratch of buyers stepping in just above 3374.50.•Momentum is picking up to the upside, but we want confirmation of strength before committing.⸻2️⃣ Trade Execution▶️ Entry: Buy Stop at 3379.50•Wait for a clean 3 m/15 m push above the short-term swing high (~3379) to confirm buyers are in control.✂️ Stop Loss: 3374.50•Just below the broken resistance-turned-support level.•True structural invalidation of this bullish thesis.🎯 Take Profit: 3394.50•Targets the next logical resistance cluster (round number area and prior swing highs) for ~15 pt gain.Risk-Reward ≈ 1:3 (SL = 5 pts, TP = 15 pts)⸻3️⃣ Invalidation & Expiry❌ Cancel the pending Buy Stop at 3379.50 if either:1.A full 15 m candle closes below 3374.50 before entry.2.It’s not triggered by 8:30 AM PST.
KeN-WeNzEl
Trade Idea: XAUUSD Long (SELL LIMIT)
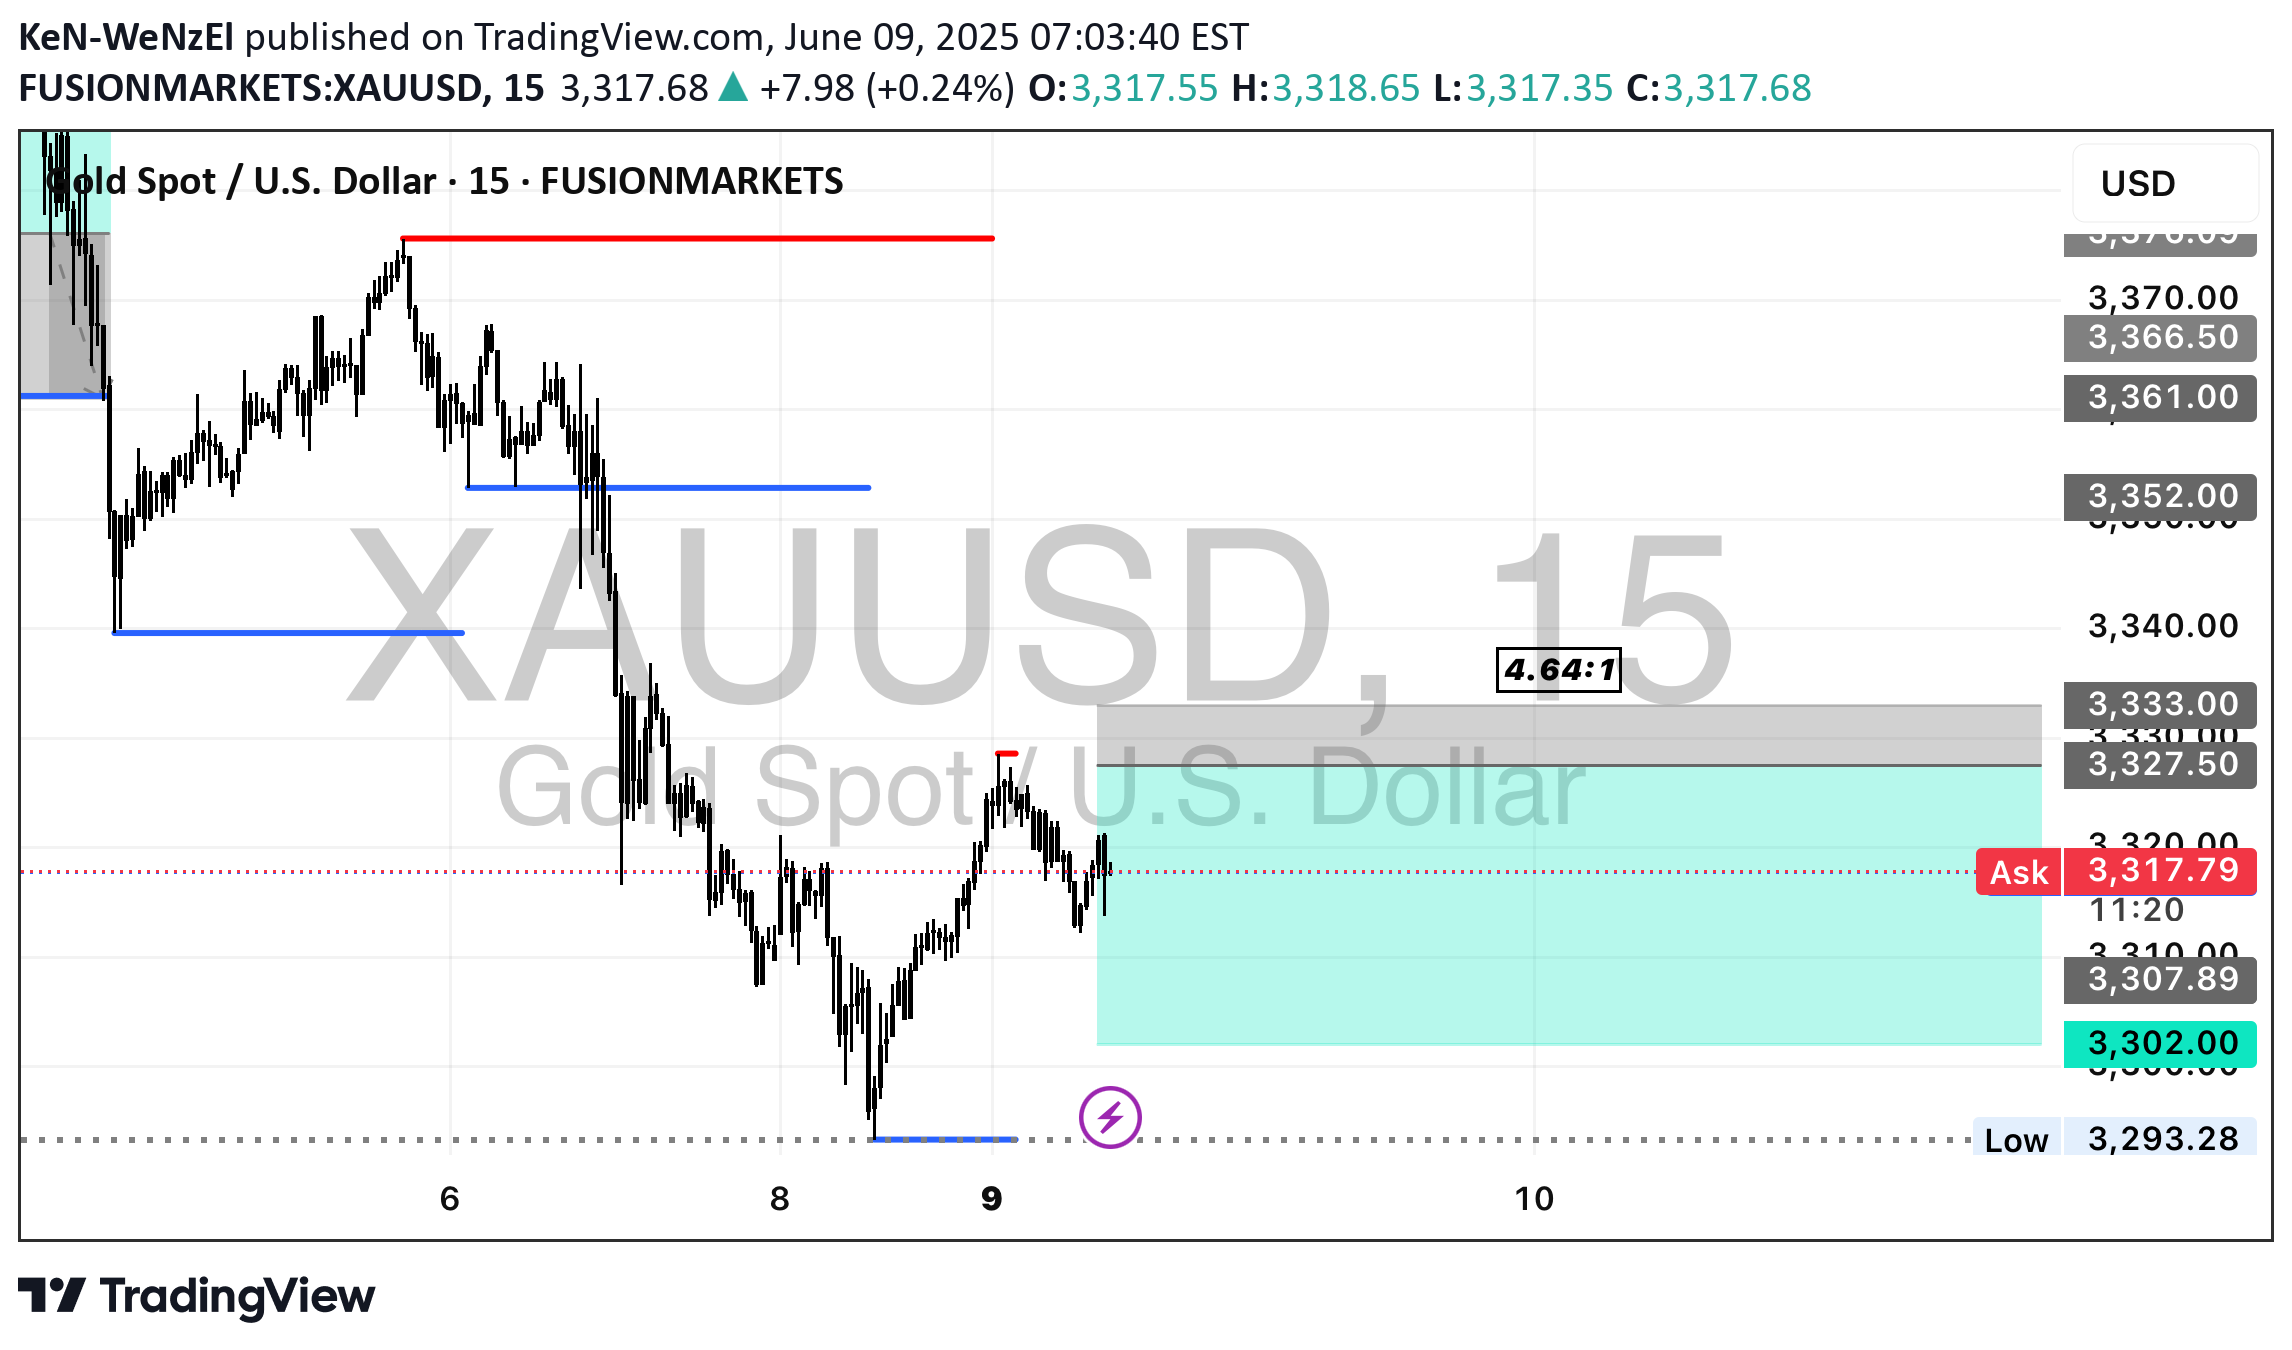
🔍 Technical Breakdown:H1 (Primary Trend Context):•Strong downtrend: clean lower lows and lower highs•Price broke below previous day’s low (yellow line)—now acting as resistance•20 SMA below 50 SMA, both sloping downward•Volume increased during selloff = strong participation•Price currently retracing into prior broken support, now potential supplyM15 (Entry Zone Confluence):•Micro bullish structure pushing into:•Prior M15 demand turned supply•Dynamic resistance (20/50 SMAs)•Thin volume / inefficiency area•Retrace remains within context of a bearish flag/pullbackM3 (Entry Precision):•Price approaching clean M3 supply zone between 3326.0 – 3329.0•Minor FVG and untested supply at 3327.50•Good stop placement just above 3332 (above M3/M15 structure)⸻📌 Trade Setup Details (Revised for 3319 Context)•Sell Limit Entry: 3327.50•Stop Loss: 3333.00 (5.5 pts)•Take Profit: 3302.00•Risk-to-Reward: ~4.63R ⸻🔁 SL to Breakeven CriteriaMove SL to breakeven only after:1.A 15-minute candle fully closes below 3312.00, breaking current bullish microstructure2.Price either:•Bases under 3312 or•Retests 3312–3314 as fresh resistanceThen you can move SL to 3327.50. XAUUSD
KeN-WeNzEl
Trade Idea: XAUUSD Long (BUY LIMIT)

Entry Type: Buy LimitTimeframe Alignment: H4 bullish continuation → M15 demand zone retest → M3 structure forming base at supportSession Timing: Aligned with London–New York overlap (between 4:30 AM and 6:30 AM PST)⸻🔹 Trade Setup•Entry: 3376.10 (Buy Limit)•Stop Loss: 3361.00 •Take Profit: 3412.00⸻🔹 Trade Logic •Price is pulling back into a clear M15 demand zone around 3376, which aligns with prior consolidation and breakout zone.•Trend remains bullish on the H4 and M15 with higher lows and sustained closes above the 50 EMA.•3376 area also marks a low-volume imbalance fill on lower timeframes (M3), suggesting institutions may defend this level.•TP is just below prior H4 swing highs (~3415)⸻🚫 Invalidation Window•cancel the trade entirely if not activated by 6:30 AM PST to maintain session alignment and volatility edge. XAUUSD
KeN-WeNzEl
Trade Idea: XAUUSD Long (BUY STOP)

Direction: LongOrder Type: Buy StopEntry: 3366.50 (above recent local resistance and reclaiming structure)Stop Loss: 3352.00 (below M15/M3 structure and recent low)Take Profit: 3402.00 (previous swing high zone and just under H4 resistance)Risk-Reward Ratio: ~2.57R⸻🧠 Trade RationaleH4•Price bounced from a higher low around 3320–3330, still respecting the long-term uptrend.•Price is now reclaiming the 20/50 SMA cluster, which could act as dynamic support.•Momentum is neutral-to-positive with MACD poised for a bullish crossover.M15•Price reclaimed 20 SMA and is now curling back above the 50 SMA.•Clean bullish engulfing structure forming, indicating buyer re-entry.•RSI is mid-50s with room to expand upward.M3•Strong, steady micro uptrend forming higher lows and consolidating under resistance near 3366.•Increasing volume on upward moves, suggesting healthy interest from buyers.⸻🛡️ Risk Management & Execution•Entry confirmation: Only enter if price breaks above 3366.50 on strength — avoid premature triggers.•Invalidation Window: Trade becomes invalid if price closes below 3350 on a 15-minute candle. This would break both M3 and M15 structure.•SL to BE: Move SL to break-even after price reaches 3377 and forms a micro higher low on M3 or support-resistance flip. XAUUSD
KeN-WeNzEl
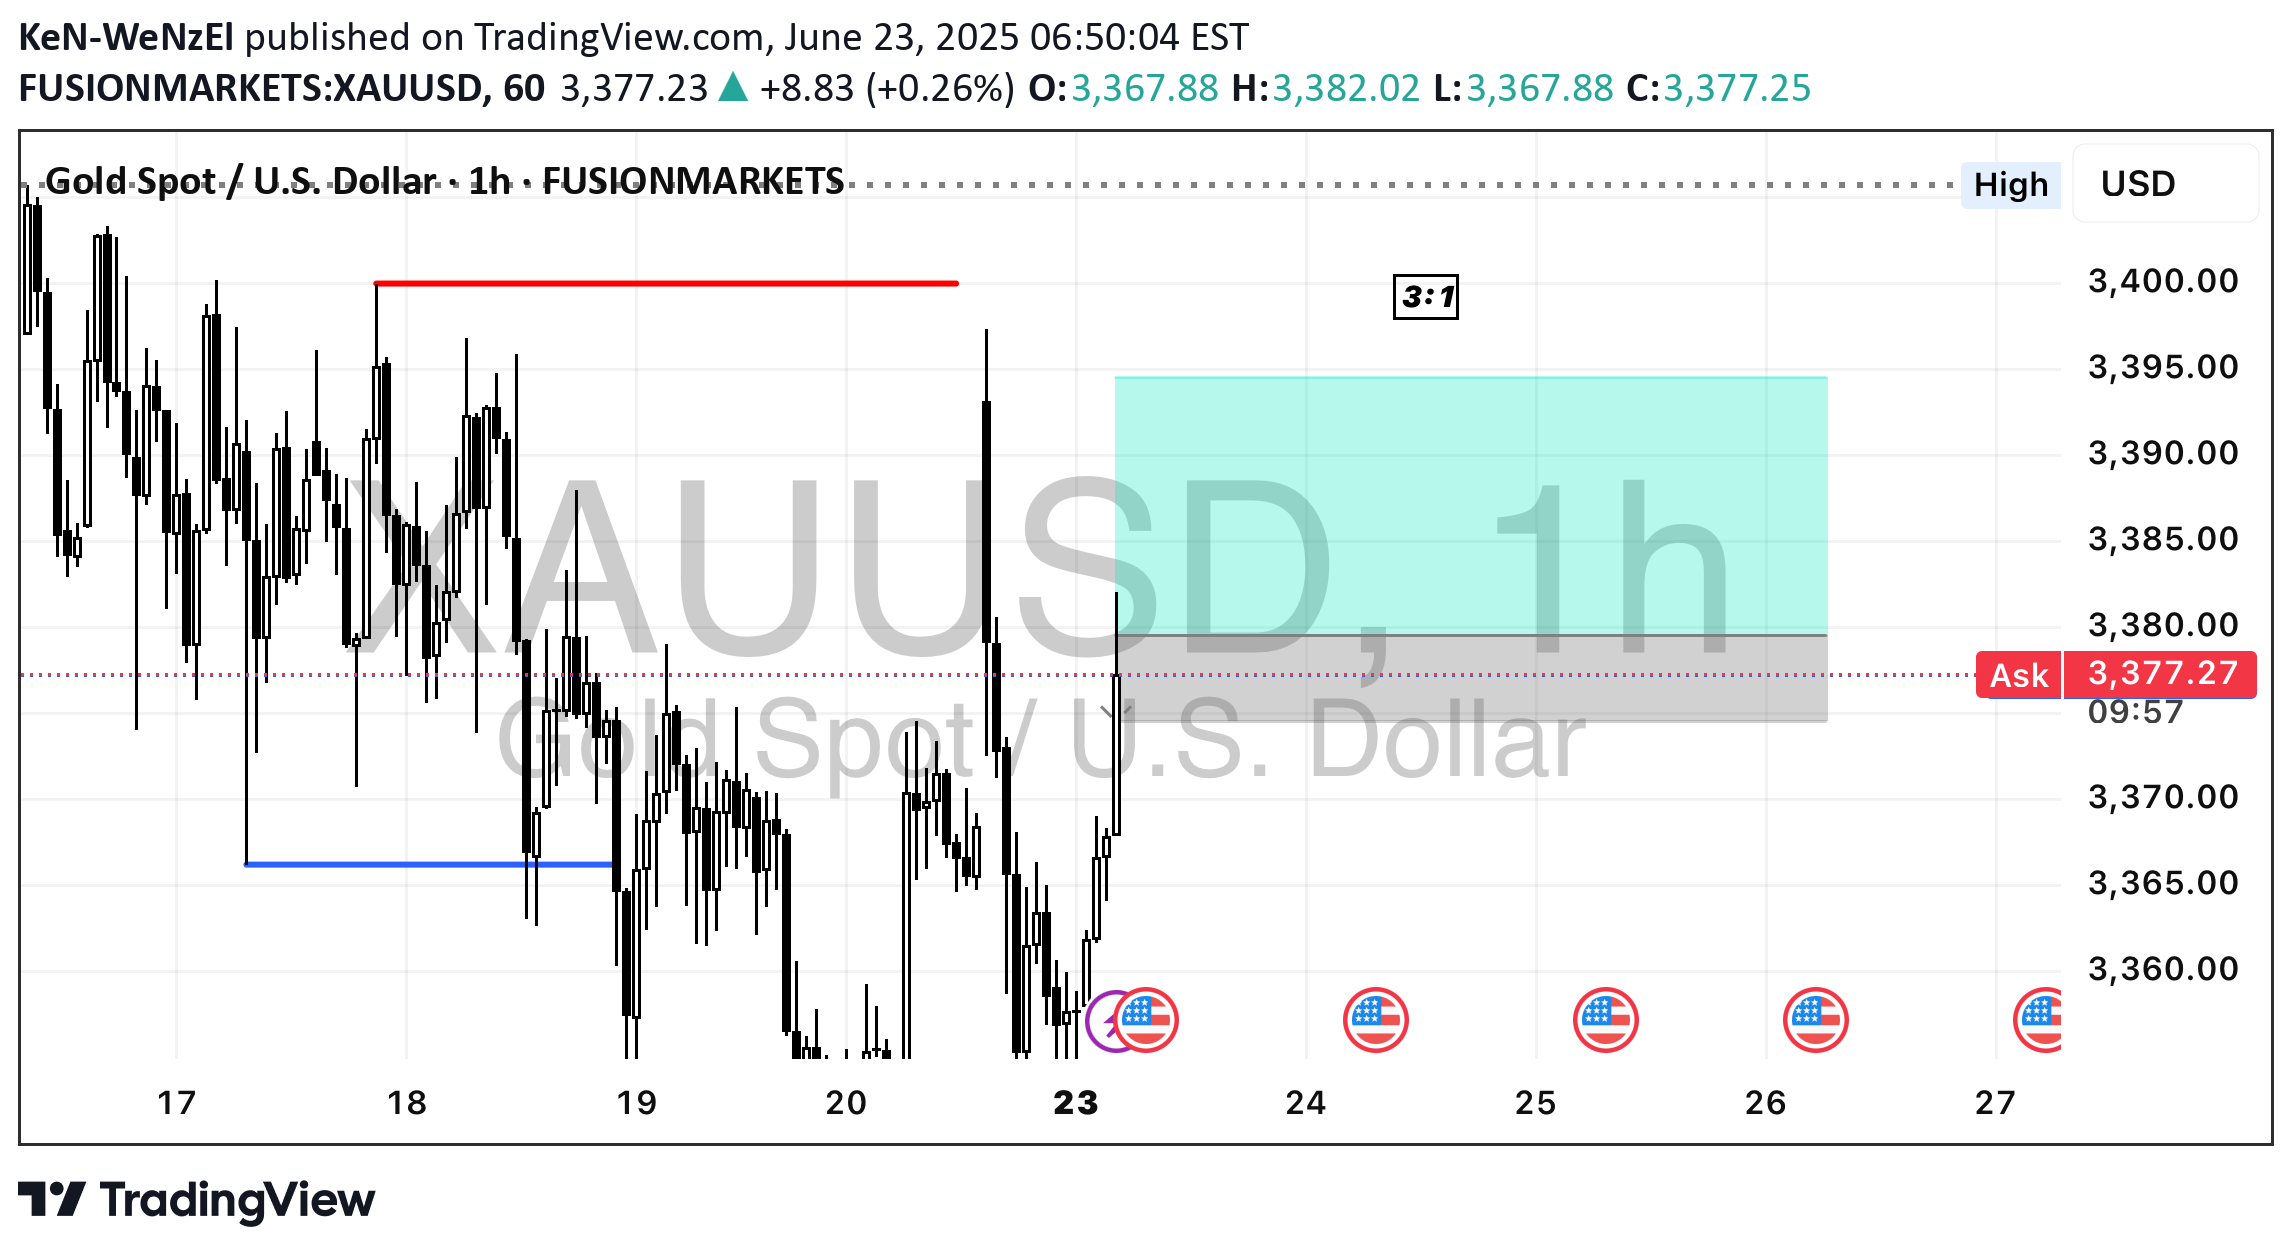
Trade Idea: Long XAUUSD (BUY STOP)

Bias: LongOrder Type: Buy StopEntry: 3392.60 (above current swing high & clean momentum continuation)Stop Loss: 3379.00 (below local support & M15 20/50 SMA)Take Profit: 3430.00Risk-Reward: ~2.7R⸻📈 Multi-Timeframe Breakdown:H4:•Structure remains bullish.•Price is breaking out of a range with a clean reclaim of both SMAs.•Momentum increasing, MACD histogram turning up, signaling trend continuation.M15:•Strong impulsive rally from ~3290s to ~3390.•Higher highs and higher lows cleanly respected.•Price consolidating at the highs—ideal for breakout continuation setups.M3:•Momentum is persistent with shallow pullbacks.•Small flag forming near 3390 = ideal for a stop entry just above.•RSI cooling off but still in bullish structure—no divergence yet.⸻🧠 Trade Logic:This is a momentum continuation play after a clean intraday impulse. The market has shown strong upside commitment across all timeframes and is now pausing in a flag/pennant above the breakout zone. A buy stop avoids chasing and only gets triggered if the market confirms with new demand.⸻🛡️ Risk Management & Execution:•Invalidation Window (SL-to-BE Zone):Move SL to breakeven once price closes above 3401 on M3 with bullish structure.→ This marks a clear micro higher high and exit from the current consolidation range.•SL Placement Justification:3379 is just below the M15 demand zone and SMA confluence—if price breaks below, momentum has failed.•Entry Execution:If the flag structure gets invalidated before entry (e.g., price dips sharply), cancel the buy stop. XAUUSDTRADE HAS PUSHED PASSED SUPPORT AT 3265 WITH A CLOSED 15MIN CANDLE SUGGESTING BULLS HAVE LOST THAT ZONE. THIS LIKLEY INDICATES A STRUCTURAL SHIFT WHICH INVALIDATES THIS BULLISH SET UP.
KeN-WeNzEl
Trade Idea:XAUUSD SHORT ( SELL STOP )

🔍 Multi-Timeframe Analysis📉 H4:•Price is compressing below the 20 and 50 SMAs.•Recent attempts to break higher failed to sustain; MACD is slightly bearish, hinting momentum is fading.•Consolidation after the big push suggests potential for another leg down if support breaks.🕒 M15:•Strong bounce into resistance, now stalling at the underside of the previous structure (~3315–3320).•20 SMA is curling down and converging with the 50 SMA, signaling a potential momentum shift.🕒 M3:•Price just lost short-term bullish structure after failing to break 3318.•Flattening and slight downward curl in the 20 SMA.•Volume shows a slowdown on the bounce and heavier selling earlier in the day — signs of weakness.⸻✅ Trade IdeaType: Sell StopEntry: 3308Stop Loss: 3322Take Profit: 3273———🧠 Why This Setup Works•This is a momentum breakdown trade: placing a sell stop just below short-term support (3308) to catch the shift in momentum if price breaks lower.•Price already rejected the high around 3318; if it pushes below 3308, it confirms that sellers have taken back control.•There’s clean room down to 3273 — a previous reaction zone and recent demand level — offering a good risk-to-reward.⸻🛡️ Risk Management & Execution•SL to BE Rule: Move stop loss to break-even once price reaches 3293 (15 points in your favor, 1R). That’s the halfway point to target and right above a small reaction zone that could cause a pullback.•Invalidation Window: If price moves above 3325 before activating entry, cancel the trade idea. That would invalidate the lower-high structure and suggest momentum has shifted bullish again.⸻⏱️ Session Timing & Considerations•NY session opens at 6:30 AM Pacific (PT).•Ideally, this trade should activate and move by pre-New York to early NY session. If price stalls or consolidates near the entry level for too long into the session (after 9:30–10:00 AM PT), consider canceling or reassessing. XAUUSDOVERALL A GOOD TRADE, PRICE MOVED IN THE DIRECTION I THOUGHT IT WOULD AND A 15M CANDLE CLOSED BELOW 3295 LEADING ME TO MOVE SL TO BE. PRICE HAD TROUBLE PUSHING PAST THAT POINT AND EVENTUALLY CAME BACK UP AND WICKING ME OUT. PRICE THEN PRECEEDED TO DROP AND HIT TP.GOOD TRADE AND PRICE ACTION JUST UNLUCKY.
KeN-WeNzEl
Trade Idea:XAUUSD Short ( SELL LIMIT )

📉 Multi-Timeframe Breakdown 🔹 H4 Chart (Macro Bias)•Trend Context: Price is still broadly in an uptrend on the H4, but it’s testing the 50 SMA from above.•MACD: Bearish crossover below the signal line suggests waning bullish momentum.•Volume: Slight uptick in bearish volume as price pulls back from the recent highs.•Bias: Neutral to Bearish Short-Term (H4 trend remains up, but weakening).🔹 M15 Chart (Setup Zone)•Structure: A sharp selloff broke both the 20 SMA and 50 SMA.•Momentum: RSI ~16, oversold—but that can persist in strong trends.•Volume: Large spike on the breakdown candle = strong bearish interest.•ATR: 7.97 = elevated volatility.•Bias: Bearish momentum, potential pullback retest opportunity.🔹 M3 Chart (Execution Focus)•Price Action: Freefall with clean rejections at the 20 SMA.•Volume Spike: Bears in control, RSI also confirms momentum exhaustion but no reversal confirmation yet.•Bias: Bearish with potential for bounce/pullback retest entry.⸻✅ Primary Trade SetupType: 🟥 Sell LimitRationale: Let price retrace into resistance before fading it, using structure for confirmation.Entry Zone: 3270–3276 area (prior support becomes resistance near 20 SMA on M15 and 50 SMA on M3).Stop Loss: Above structure high → 3283Take Profit: Next key support zone ~3245–3250 (measured move + demand zone on M15/M3).📌 Sell Limit Order•Sell Limit @ 3273•SL @ 3283 •TP @ 3248 XAUUSDIF TRADE IS NOT ACTIVATED BY 2 HOURS AFTER NY OPENS, CANCEL TRADE MANUALLYTRADE PLAYED OUT JUST AS ANTICIPATED AND PROCEEDED TO RETRACE TOWARDS ENTRY. UNFORTUNITLEY PRICE REJECTED JUST BELOW ENTRY AND PROCEEDED TO HIT TP.THE MOVE HAPPENED BUT DIDNT COME UP HIGH ENOUGH TO TAG US IN
KeN-WeNzEl
Trade Idea: XAUUSD Long ( BUY LIMIT )

✅ Bias: Long (Buy)Rationale:•4H Chart shows price reclaiming the 20/50 SMA zone after the recent pullback — a bullish reset after a shallow correction.•15M Chart confirms trend resumption — clean higher highs and higher lows, with strong price support above the 20/50 SMA crossover.•3M Chart shows a breakout with higher volume and sustained move above recent consolidation. White 20 SMA is holding price well.⸻🎯 Trade Setup: Buy XAUUSD•Entry: 3345.00 (wait for a small pullback or price base just above current level for better RR)•Stop-Loss: 3332.00 (below last intraday swing low and the SMA base)•Take-Profit: 3371.00 (near previous resistance zone)Risk-Reward Ratio: ≈ 2:1⸻📍 Move SL to Breakeven When:Price reaches 3358.00 (midway point = 1:1 RR) and:•3M chart shows no strong bearish engulfing or reversal candle.•Volume on the move is rising or stable (not collapsing).This protects capital without choking the trade.⸻🧠 Confluence Summary:•Trend Alignment across all timeframes.•20/50 SMA bullish stack on 15M and 4H.•Volume Expansion on breakout leg.•RSI (15M) near 67 — strong but not overbought yet (room to run).⸻⚠️ Fundamental Notes:•Gold has been rising with Fed pivot expectations and equity uncertainty — momentum is on the bulls’ side unless sharp risk-on news appears.•Caution near major US data releases tomorrow or speeches from Fed members. XAUUSD
KeN-WeNzEl
Trade Idea : XAUUSD LONG (BUY LIMIT)

✅ Trade Bias: Long (Buy)⸻🔍 Technical Analysis Summary📈 Daily Chart•Trend: Strong uptrend with recent consolidation after an extended move higher.•MACD: Bullish momentum cooling but still positive — histogram declining slightly.•RSI: Neutral zone at 55.90, indicating room to the upside before overbought levels.⏱ 15-Minute Chart•Trend: Pullback followed by a strong bullish continuation. Price is making higher highs and higher lows.•MACD: Strong bullish crossover; histogram expanding upward.•RSI: 62.34 — not yet overbought, signaling continuation potential.⏱ 3-Minute Chart•Price Action: Bullish structure holding above short-term moving average.•MACD: Bullish crossover in early stages with histogram turning positive.•RSI: 66.22 — nearing overbought but not signaling immediate reversal.⸻🌐 Fundamental Context•Gold is supported by:•Persisting inflation concerns.•Geopolitical risk premium.•Expectations of rate cuts by the Fed in the coming quarters.There are no immediate bearish catalysts. The macro backdrop favors gold strength, especially as the USD shows some weakness.⸻🎯 Trade Setup: Long XAU/USD•Entry (Buy): 3320.00•Slight pullback toward previous resistance-turned-support and short-term MA confluence.•Stop Loss (SL): 3295.00•Below recent intraday swing low and support zone; protects against false breakout.•Take Profit (TP): 3370.00•Previous high extension zone, aligning with momentum continuation projection. XAUUSDMOVED SL TO BE @ 1:1, TRIGGERED
KeN-WeNzEl
Trade Idea: BTCUSD (SELL STOP)

BTCUSD Trade Setup Analysis BTCUSD 1. Trend Analysis - Price Action: BTC is in a strong uptrend, with recent highs near **105,819.00**. - RSI (14): 72.88** (approaching overbought, but no divergence yet). - MACD: Bullish but showing potential slowing momentum (histogram decreasing). - **Key Levels:** - Support: 82,447.57 (previous resistance turned support). - Resistance: 105,819.00 (current high). 2. Entry Precision - Price Action: Recent rejection from **108,104.70** (lower high) with a drop to **104,834.80**. - RSI (14): 58.39 (neutral, slight bearish bias). - MACD: Bearish crossover (249.955 → 241.911). - **Key Levels:** - Resistance:108,104.70 (recent high). - Support: 104,834.80 (immediate level). 3. Confluence - Price Action: Downtrend in shorter timeframe, with price below **106,237.30**. - RSI (14): 50.6 (neutral, leaning bearish). - MACD: Positive but weakening (41.156). - **Key Levels**: - Resistance: 106,237.30 (recent high). - Support: 102,928.15 (next key level). --- **Trade Idea: Short-Term Bearish Pullback** Entry:- Short near 105,820.00 (daily resistance confluence with 15M rejection). Stop Loss (SL): - 106,300.00 (above recent 3M high) Take Profit (TP): - TP1: 104,834.80 (15M support, 1:2 RRR). - TP2: 102,928.15 (3M support, 1:4 RRR). (IDEAL)
Disclaimer
Any content and materials included in Sahmeto's website and official communication channels are a compilation of personal opinions and analyses and are not binding. They do not constitute any recommendation for buying, selling, entering or exiting the stock market and cryptocurrency market. Also, all news and analyses included in the website and channels are merely republished information from official and unofficial domestic and foreign sources, and it is obvious that users of the said content are responsible for following up and ensuring the authenticity and accuracy of the materials. Therefore, while disclaiming responsibility, it is declared that the responsibility for any decision-making, action, and potential profit and loss in the capital market and cryptocurrency market lies with the trader.