
KarimMohsen
@t_KarimMohsen

What symbols does the trader recommend buying?
Purchase History
پیام های تریدر
Filter
اتریوم به کف قیمتی رسید؛ آیا شانه نهایی قبل از جهش تا ۲۱۰۰۰ دلار شکل میگیرد؟
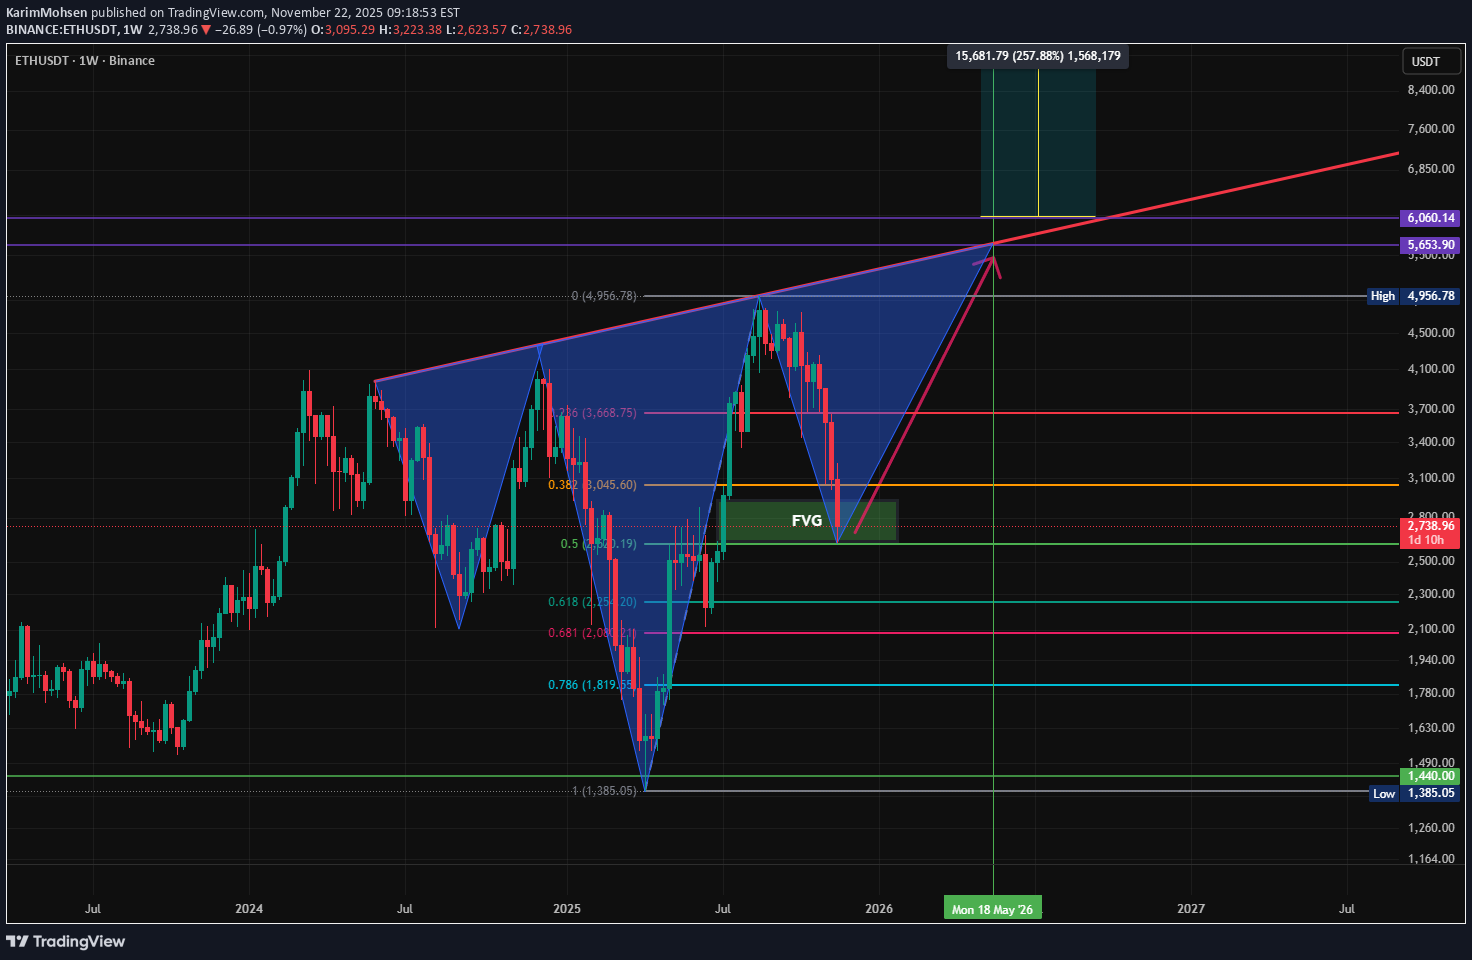
On the ETH/USDT weekly chart, price has just tapped and respected the Fair Value Gap (FVG) demand zone around the 2.6–2.8K area, filling it almost perfectly. This zone lines up with key Fibonacci retracements of the previous impulse and could be forming the right shoulder of a large inverse Head & Shoulders pattern: Left shoulder: ~3.6–3.7K Head: ~1.3–1.4K Potential right shoulder: current 2.6–2.8K region (FVG fill) Neckline: ~4.9–5.0K If bulls defend this weekly FVG and ETH manages a sustained move back above 3K, the next logical step would be a test of the 5K neckline. A clean weekly breakout and close above the neckline would confirm the pattern and open the door for a much larger measured move – which points toward the 20–21K region in the long term. Invalidation / risk: A weekly close back below the FVG and mid-range (~2.4–2.5K) would weaken the right-shoulder idea. A deeper breakdown below 2K would put the entire structure at risk. Watching how price reacts inside this FVG zone over the next few weeks. Is this just another bounce, or the birth of the final shoulder before a parabolic phase? 🤔 Not financial advice – just a chart idea, do your own research and manage your risk.Still valid
The amazing BTC and the secret of 152 & 52 weeks.🤔
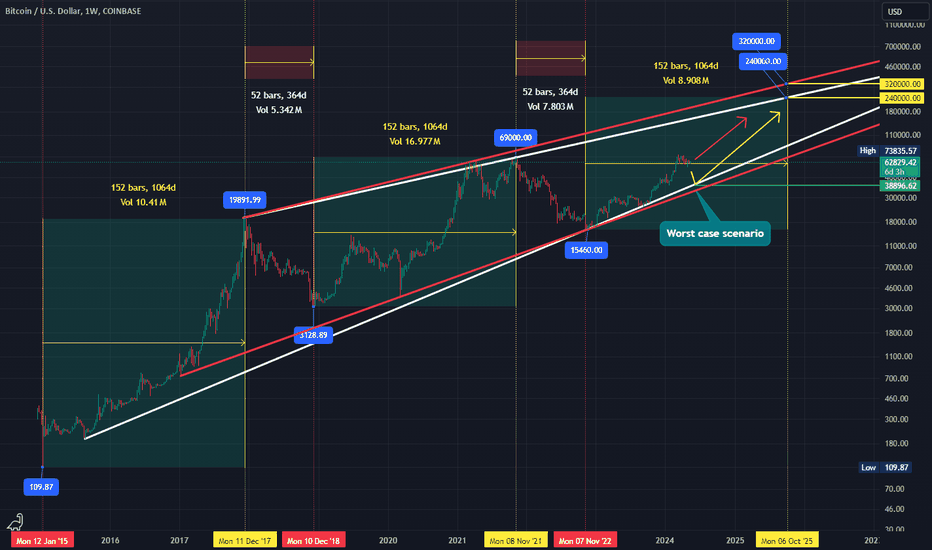
Here's an intriguing take on BTC and the potential significance of the 152 (Bulls) & 52 (Bears) week cycles: 🔑 BTC: Unlocking the Secrets of the 152 (Bulls) & 52 (Bears) Weeks 🗝️ Throughout BTC's history, a fascinating pattern has emerged – the alternation between 152-week bull cycles and 52-week bear cycles. 📈📉 This cyclical behavior has been observed multiple times, leading to the tantalizing question: Will history repeat itself once again? 🔄 My answer: Yes, I think the stars are aligning for another cosmic dance between the bulls and bears. 🐂🐻 If this pattern holds true, we are potentially witnessing a new 152-week bull run started in 7 Nov 2022 till the top around 6 October 2025, followed by a 52-week bear hibernation, and the cycle continues. ∞ However, as with all things crypto, nothing is set in stone, and the market is known for its unpredictability. 📊🔮 Nonetheless, for those who believe in the power of historical cycles, the 152 (Bulls) & 52 (Bears) weeks could serve as a fascinating guide, offering insights into potential market movements. 🧭 It is not a financial idea. PLZ DYOR. Good Luck.The yellow Scenario has been activated.Same vision ..Different pattern152-week bull run started in 7 Nov 2022 till the top around 6 October 2025 has been finished..
🚀 TLM: Ready for Liftoff! 🌕

TLM has been in an accumulation phase 💹 since May 2022. This means the price has been trading within a range for a long period. I believe TLM is now ready for a nice upward move soon! 🆙 My most realistic target price for TLM is the red level 🎯 on the chart, which is about 8 times higher 🚀 than the current price. If TLM can break through that red resistance level 💥, then the green target levels 🥇 become potential future goals, which are even higher prices. However, please DYOR 🔎 and analysis carefully before investing. DCA 💰 could be a wise strategy to manage risk.
Spell's Update
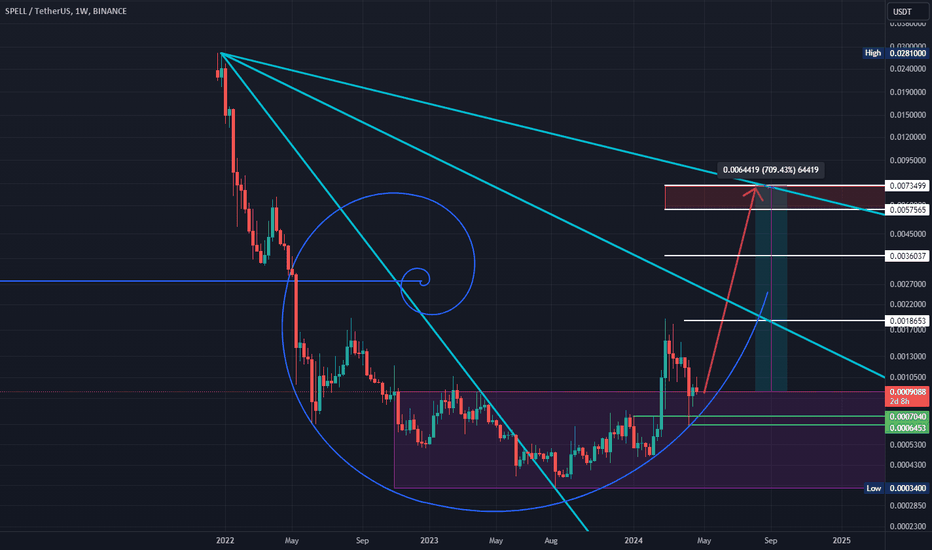
Chart is clear. Not valid only if it delisted but i don't think so. DYOR & DCA. Good Luck.
BTC Before Halving 2024
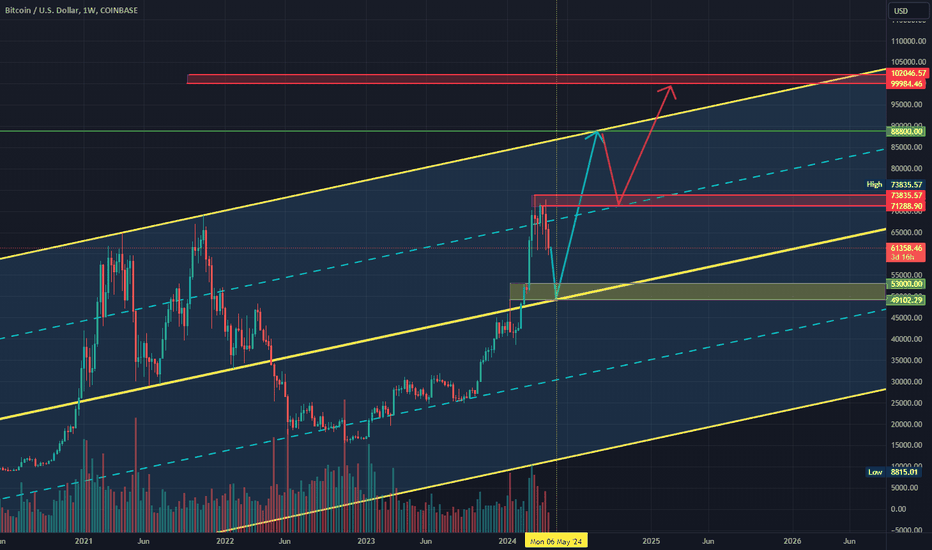
My Thoughts for BTC before BTC's Halving 2024. It is just an idea and not a financial idea.We are in a Bottom or very Near of it. I am buying from those levels DCA.Finally touched... valid unless we didn't close under the yellow rectangle.Target 1 is done ....80% profitsAfter reaching 49000 ➡️➡️88800 Target reached 🤑🤑 Now what is the next move ?🤔 🟢Maybe we can touch 90k which meet the top of the channel. 🔴Red scenarios valid only if we didn't break up this level and the upper channel..🤷♂️
OGN

I believe that OGN can touch red levels at least ... trade it only if u know what is DCA 🧐 ... it can pump directly(Blue scenario) or do the white scenario first.
🏆 BETA: The Sleeping Crypto Giant Awakening for Massive Gains

🧘♂️ BETA has been patiently accumulating since May 9th, 2022, and the stage is set for an epic upside move. Two potential scenarios could unfold: Scenario 1: 🏞️ One Last Dip Before the Rip BETA may revisit the green level for a final shake-out before igniting its rockets toward the blue target of $0.33 - $0.35. Scenario 2: 🐳 Whale-Powered Breakout 💥 If the whales decide to flex their buying muscles, BETA could blast off directly from the current accumulation rectangle. 🎯 Regardless of the path, the end result promises to be a massive upside move that could make you dance with joy! 💃 🔴 Our potential targets include the red lines and white trendlines on the chart, offering multiple opportunities to take profits. 🚨 But wait, there's more! If BETA manages to close any weekly candle above the last white trendline, our final target could soar above the elusive $2 level! 🤯 💸 To maximize your gains, a dollar-cost averaging (DCA) strategy is highly recommended. Those who embrace DCA patiently will be rewarded handsomely. 💰 🔍 Furthermore, the BETA/BTC chart showcases a wide bullish divergence on the weekly timeframe, which is an incredibly bullish signal. (Stay tuned for updates!) Get ready for a wild ride, crypto enthusiasts! BETA is gearing up to make its grand debut on the main stage, and you won't want to miss this stellar performance. 🚀✨ ⚠️ Disclaimer: This is not financial advice. As always, do your own research (DYOR) and invest responsibly. 💯BETA/BTC Bullish Divergence.. 🤌🤌🤌🤌Scenario No.1 has been activatedPerfect till now 👌
🚀FXS: A Potential Skyrocket Waiting to Launch 🌕

📈 FXS has been in an accumulation phase since June 2022, consolidating within a green rectangle range. With a tiny circulating supply of just 78,825,942 FXS, this crypto could be primed for a massive upside move. 💣 Once FXS breaks out from this accumulation range, it could potentially explode to new heights, with targets of $22-$24 in sight. However, the timing of this breakout remains uncertain, so patience is key. ⏳ 🚀🚀 Red Lines and White trends are our targets.🚀🚀 ✨ While the upside potential is enticing, it's crucial to do your own research (DYOR) and manage your risk accordingly. Dollar-cost averaging (DCA) into FXS could be a wise strategy for those willing to hold through the volatility. 🎰 Good luck to those who decide to take a chance on this potential crypto gem! May the odds be ever in your favor. 🍀 In summary, FXS presents an exciting opportunity for patient investors willing to weather the accumulation phase. With its tiny supply and potential for a massive breakout, FXS could be a rocket ship waiting for liftoff. 🚀 DYOR, DCA, and buckle up for a thrilling ride!2 Bullish divergences on FXS/BTC Daily frame
Bake Targets

Hello Guys Targets on chart Dyor & DCA Good luckI know entry wasn't good for short term, but most of my charts are weekly charts for big targets so I don't care about down 10 % or 20% from my entry while my targets between 100 - 300 % . Anyway Bake in very good position now.
MLN - A Low-Cap Crypto with Massive Upside Potential 💎

🔎 MLN is a small hidden gem on Binance and other major exchanges like Coinbase, Gate.io, and Kraken. With a tiny circulating supply of 2,665,562 MLN and a fully diluted market cap of just $53,424,254, this crypto could be a 💎 in the rough. 📈 MLN appears to be in an accumulation phase, trading within a purple rectangle range since May 2022. The white trendline has acted as a solid support so far, but it remains to be seen if it will continue to hold or if a breakdown might occur. 💰 Dollar-cost averaging (DCA) into MLN at these green levels could be a smart strategy. Aim to buy around the green zones and take profits in the red zones, especially between $42 - $49. ⏳ However, keep in mind that this is a weekly chart, so patience and a long-term perspective are necessary. 🚨 As always, do your own research (DYOR) and never invest more than you can afford to lose. In summary, MLN presents an intriguing opportunity as a low-cap gem with a potentially bright future. 🌟 DCA into the green zones, hold through the accumulation range, and consider taking profits around the red resistance levels. But remember, DYOR and manage your risk wisely! 💯2 days 84% profits isn't bad , right ?
Disclaimer
Any content and materials included in Sahmeto's website and official communication channels are a compilation of personal opinions and analyses and are not binding. They do not constitute any recommendation for buying, selling, entering or exiting the stock market and cryptocurrency market. Also, all news and analyses included in the website and channels are merely republished information from official and unofficial domestic and foreign sources, and it is obvious that users of the said content are responsible for following up and ensuring the authenticity and accuracy of the materials. Therefore, while disclaiming responsibility, it is declared that the responsibility for any decision-making, action, and potential profit and loss in the capital market and cryptocurrency market lies with the trader.