
JustinNorok
@t_JustinNorok

What symbols does the trader recommend buying?
Purchase History
پیام های تریدر
Filter
Signal Type

Gold has been trading inside a rising wedge pattern after breaking out of a consolidation phase. Price is now testing the resistance zone near $3,490 – $3,507, where sellers may step in. ✅ Key Points Rising wedge pattern forming → often signals weakening momentum. Strong resistance at $3,490 – $3,507. If sellers hold the level, a breakdown could push price toward supports: $3,454 $3,429 $3,404 (major support zone Invalidation If price breaks and sustains above $3,507, the bearish wedge idea is invalid, and bulls may look for continuation higher Conclusion Gold is at a critical decision point. Watch price action near the resistance zone for confirmation. A rejection could trigger a pullback, while a breakout above $3,507 would favor further bullish momentum.

Bitcoin has broken down from the ascending trendline and is now trading below the 110,230 resistance zone. This confirms weakness in the bullish momentum and gives sellers an edge in the short to medium term. Current Market Structure Price failed to sustain above the key resistance zone. Clear bearish momentum after the breakdown. Lower highs forming → Indicating strong selling pressure. Key Levels to Watch Resistance: 110,230 (major barrier for bulls) Support Zones 106,380 → first short-term target 102,899 → mid-term support 99,650 → major support zone & potential reversal area Trading Setup As long as BTC stays below 110,230, bias remains bearish. Expect possible retest of resistance before continuation lower. Short positions favored on rejection signals near resistance. Bulls need a strong break & close above 110,230 to flip the structure bullish again. Strategy Notes Watch for pullbacks into resistance for better entries. Scale profits around each support zone. Maintain proper risk management—market remains volatile.

Litecoin is showing a clear technical breakdown structure after losing its ascending trendline support. The price has tested the 115.07 resistance zone multiple times but failed to break above, confirming strong supply in that region Currently, the market is consolidating below the broken trendline, which has now turned into resistance. This indicates a possible distribution phase before another downside continuation. Bearish Scenario If price fails to reclaim the 115 level, we can expect further downside pressure. The next major supports are 104.54 Minor demand zone. 98.23 Key psychological & technical level. 91.57 Major support zone where a potential bounce may occur. Setup Expectation Price may attempt a short-term retest towards resistance (near 113–115), but if rejection occurs, sellers are likely to take control, pushing the price lower step by step until support zones are tested. This setup remains valid unless LTC closes a strong 4H candle above 115.07, which would invalidate the bearish structure and may trigger a new bullish leg. Conclusion Trendline break confirms bearish bias. Any rejection near resistance could accelerate momentum towards 98–91 support area. Caution for long entries until the market confirms reversal signals.

Gold has shown a powerful breakout from the descending trendline after a long period of sideways consolidation, confirming that buyers are gaining strong control over the market. The breakout has shifted momentum toward the upside, with 3375 acting as the most important support level. As long as gold remains above this zone, the structure stays bullish and favors continuation toward higher targets. The first resistance is 3406, followed by 3435 and then the major supply area around 3466 which will be the decisive zone for further extension. If the market pulls back toward 3375–3380, that area should be closely watched because a successful retest would give buyers another chance to step in and resume the bullish trend. Dips into support are currently considered buying opportunities, as the overall flow remains upward. However, if price fails to hold 3375 and closes back below, the bullish scenario will weaken and gold may re-enter a consolidation phase. Until that happens, the chart favors bulls and suggests holding a buy-side bias with eyes on the upper resistance zones as potential targets.2nd Target Hitt GuysTarget Successfully Guys Enjoy your Profit

Bitcoin has been trading inside a descending channel, consistently rejecting the upper boundary while protecting the 111,600 support zone. This level has become a key pivot for the market, and as long as price remains above it, the structure favors bullish continuation. Currently, BTC is testing the channel resistance and showing signs of a possible breakout. If buyers hold control above 111,600, the path opens for upside targets at 114,500, 117,200, 120,100, and finally the major resistance zone near 123,100. A confirmed breakout with retest would strengthen the bullish momentum and bring higher confidence in continuation toward these targets. On the other hand, if BTC fails to sustain above 111,600, the price may fall back into consolidation, keeping the market inside the channel with limited upside potential. Traders should closely monitor the support and the breakout structure, as this level will decide whether BTC accelerates into a new bullish leg or continues sideways. At this stage, the market outlook leans bullish, but confirmation is required before aggressive long positions.

Gold (XAUUSD) is currently trading within a symmetrical triangle pattern on the 1-hour timeframe. Price has tested the upper and lower trendlines multiple times, showing strong respect for these levels. Support Zone: $3,333 – $3,340 Resistance Zone: $3,377 – $3,399 A potential breakout setup is forming: 1. If the price retests the support trendline and holds, we could see a bounce toward the $3,377 resistance. 2. A clear breakout above $3,399 could trigger further bullish momentum. 3. On the other hand, a breakdown below $3,333 could open the way toward lower support areas. Trading Idea: Watch for a retest of the lower triangle boundary near $3,333–$3,340. A bullish confirmation (candle close above trendline with volume) could signal a strong move upward. Manage risk with proper stop-loss below $3,320 if going long. Key Levels to Monitor: Support: $3,333 – $3,340 Resistance: $3,377 – $3,399 Disclaimer: This is not financial advice. Always do your own research and apply proper risk management.1st Target Hit Guys
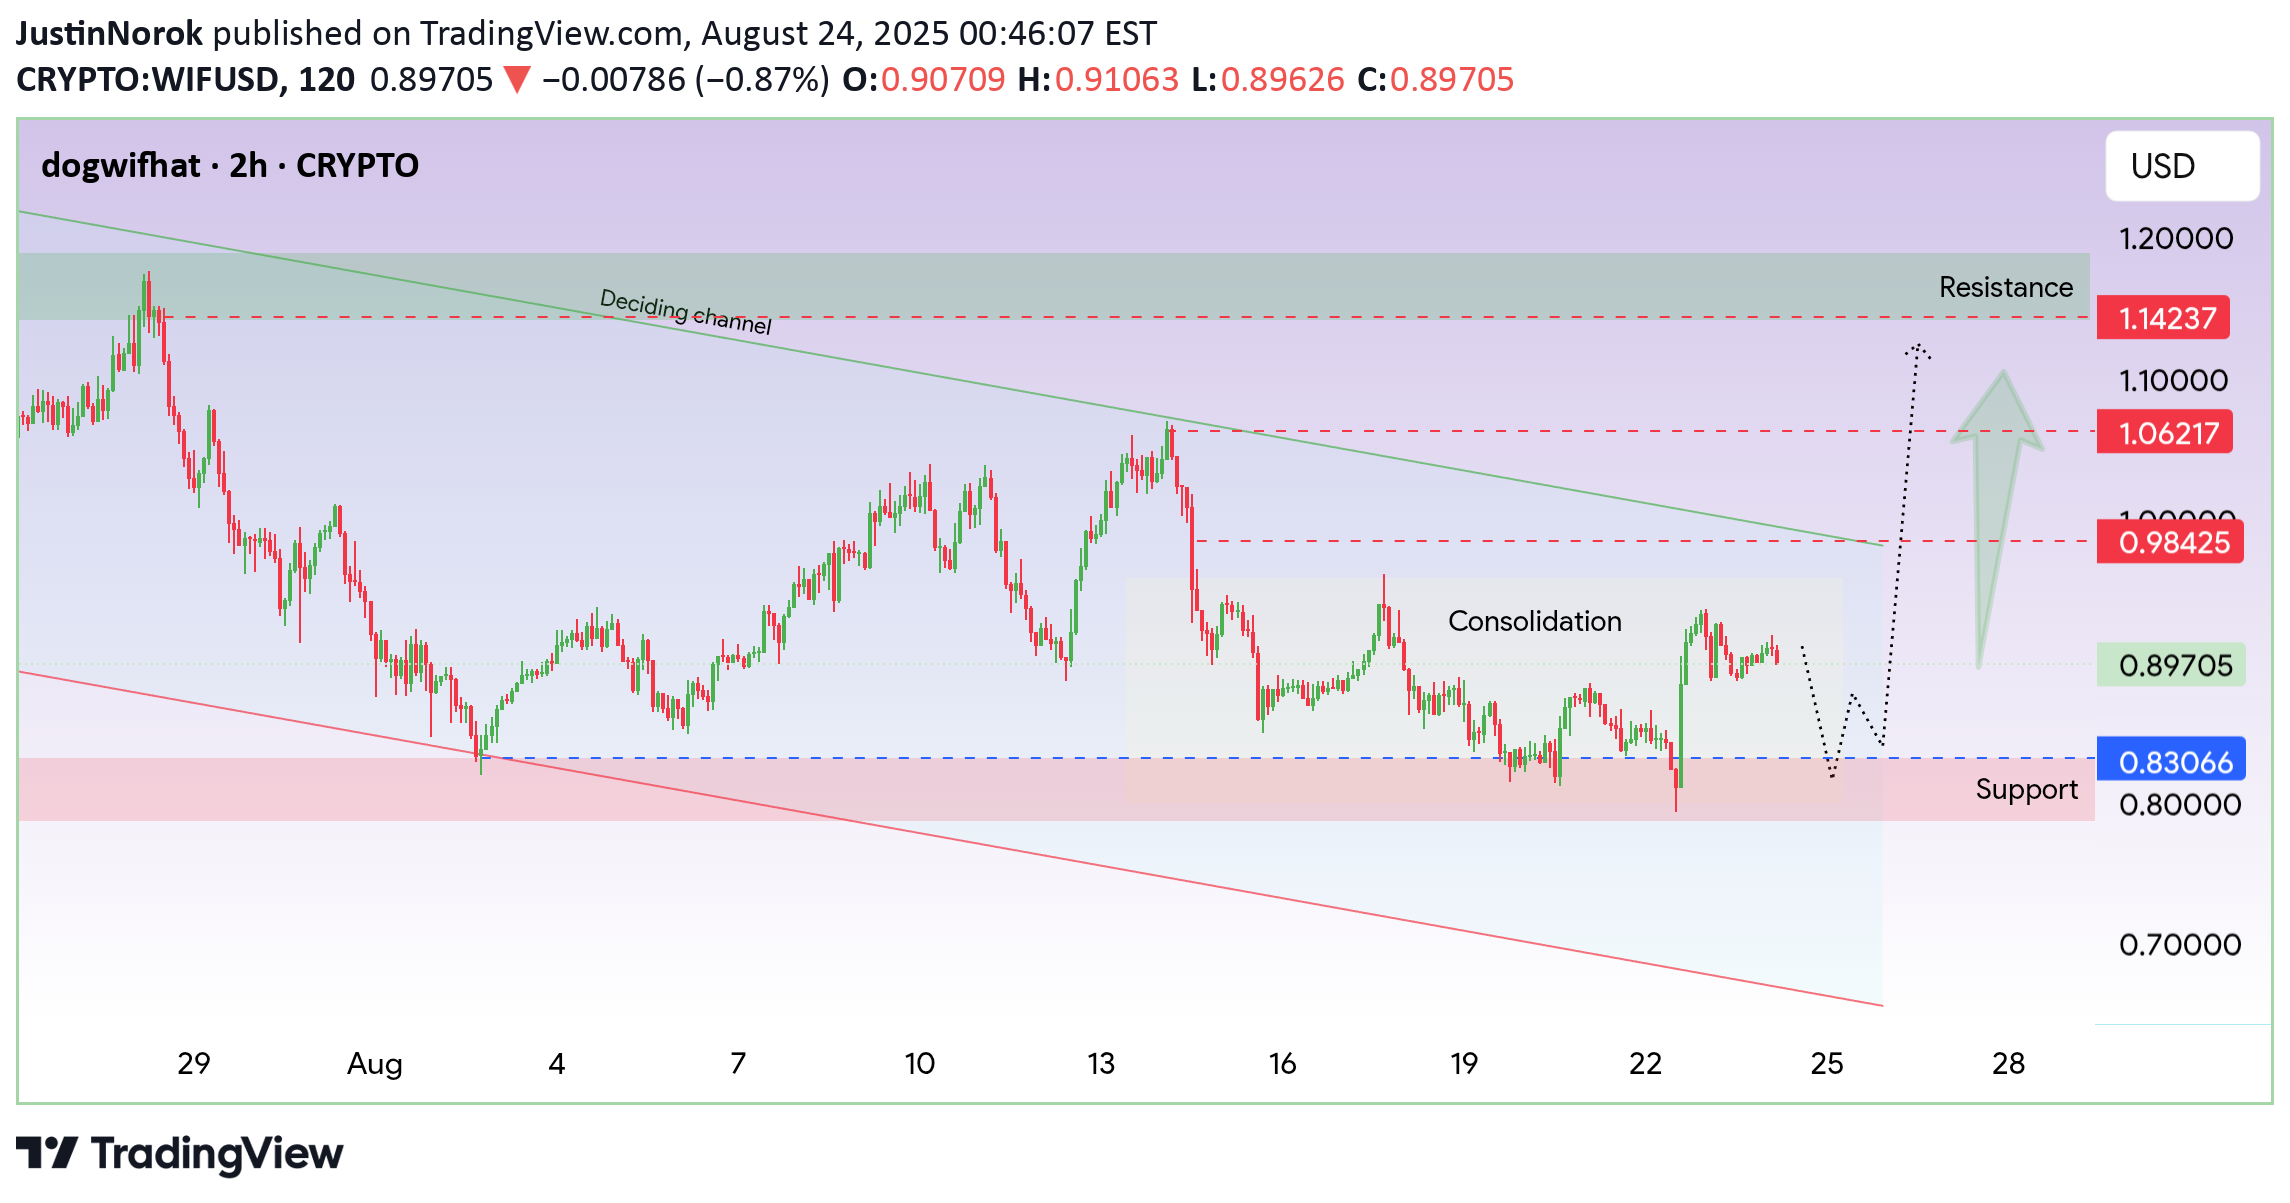
WIF/USD is currently consolidating near $0.89, trading within a key range between support at $0.83 and resistance near $0.98–$1.06. Key Observations: Support Zone: $0.83 – $0.80 has held multiple times, showing strong buying interest. Deciding Channel: Price remains within a downward-sloping channel; a breakout above it could trigger bullish momentum. Consolidation: Price action suggests accumulation; watch for a potential breakout above $0.98–$1.06 for continuation. Resistance Levels: $0.98 → $1.06 → $1.14 are the next zones to monitor if bullish breakout occurs. Possible Scenarios: 1. Bullish: A bounce from $0.83 or breakout above $0.98 could send price toward $1.06–$1.14. 2. Bearish: If $0.83 fails, we may see further downside toward $0.80 or even $0.70. Conclusion: WIF/USD is at a critical decision point. Traders should watch for breakout confirmation with volume and manage risk accordingly.

Bitcoin is currently trading around $115,600 after bouncing from the support zone near $115,000. Price action shows strong reactions around key levels, which may guide the next move. ✅ Key Observations : Price recently retested the support zone ($115,000 – $115,100) and is holding above. If buyers maintain momentum, we could see a move toward higher resistance levels. Important upside levels to watch : $118,150 $120,250 $123,300 – $124,000 (major resistance) Invalidation: A sustained break below $115,000 support may open the way for deeper correction toward $114,000 or lower. Conclusion: BTC remains in a short-term bullish structure as long as it holds above $115,000 support. Watching for confirmation before targeting higher resistances.Trade Active Guys
Disclaimer
Any content and materials included in Sahmeto's website and official communication channels are a compilation of personal opinions and analyses and are not binding. They do not constitute any recommendation for buying, selling, entering or exiting the stock market and cryptocurrency market. Also, all news and analyses included in the website and channels are merely republished information from official and unofficial domestic and foreign sources, and it is obvious that users of the said content are responsible for following up and ensuring the authenticity and accuracy of the materials. Therefore, while disclaiming responsibility, it is declared that the responsibility for any decision-making, action, and potential profit and loss in the capital market and cryptocurrency market lies with the trader.