
Jonalius
@t_Jonalius

What symbols does the trader recommend buying?
Purchase History
پیام های تریدر
Filter
Jonalius
آیا بیت کوین به کف ۸۰ هزار دلاری رسید؟ تحلیل نمودار و پیشبینی آینده
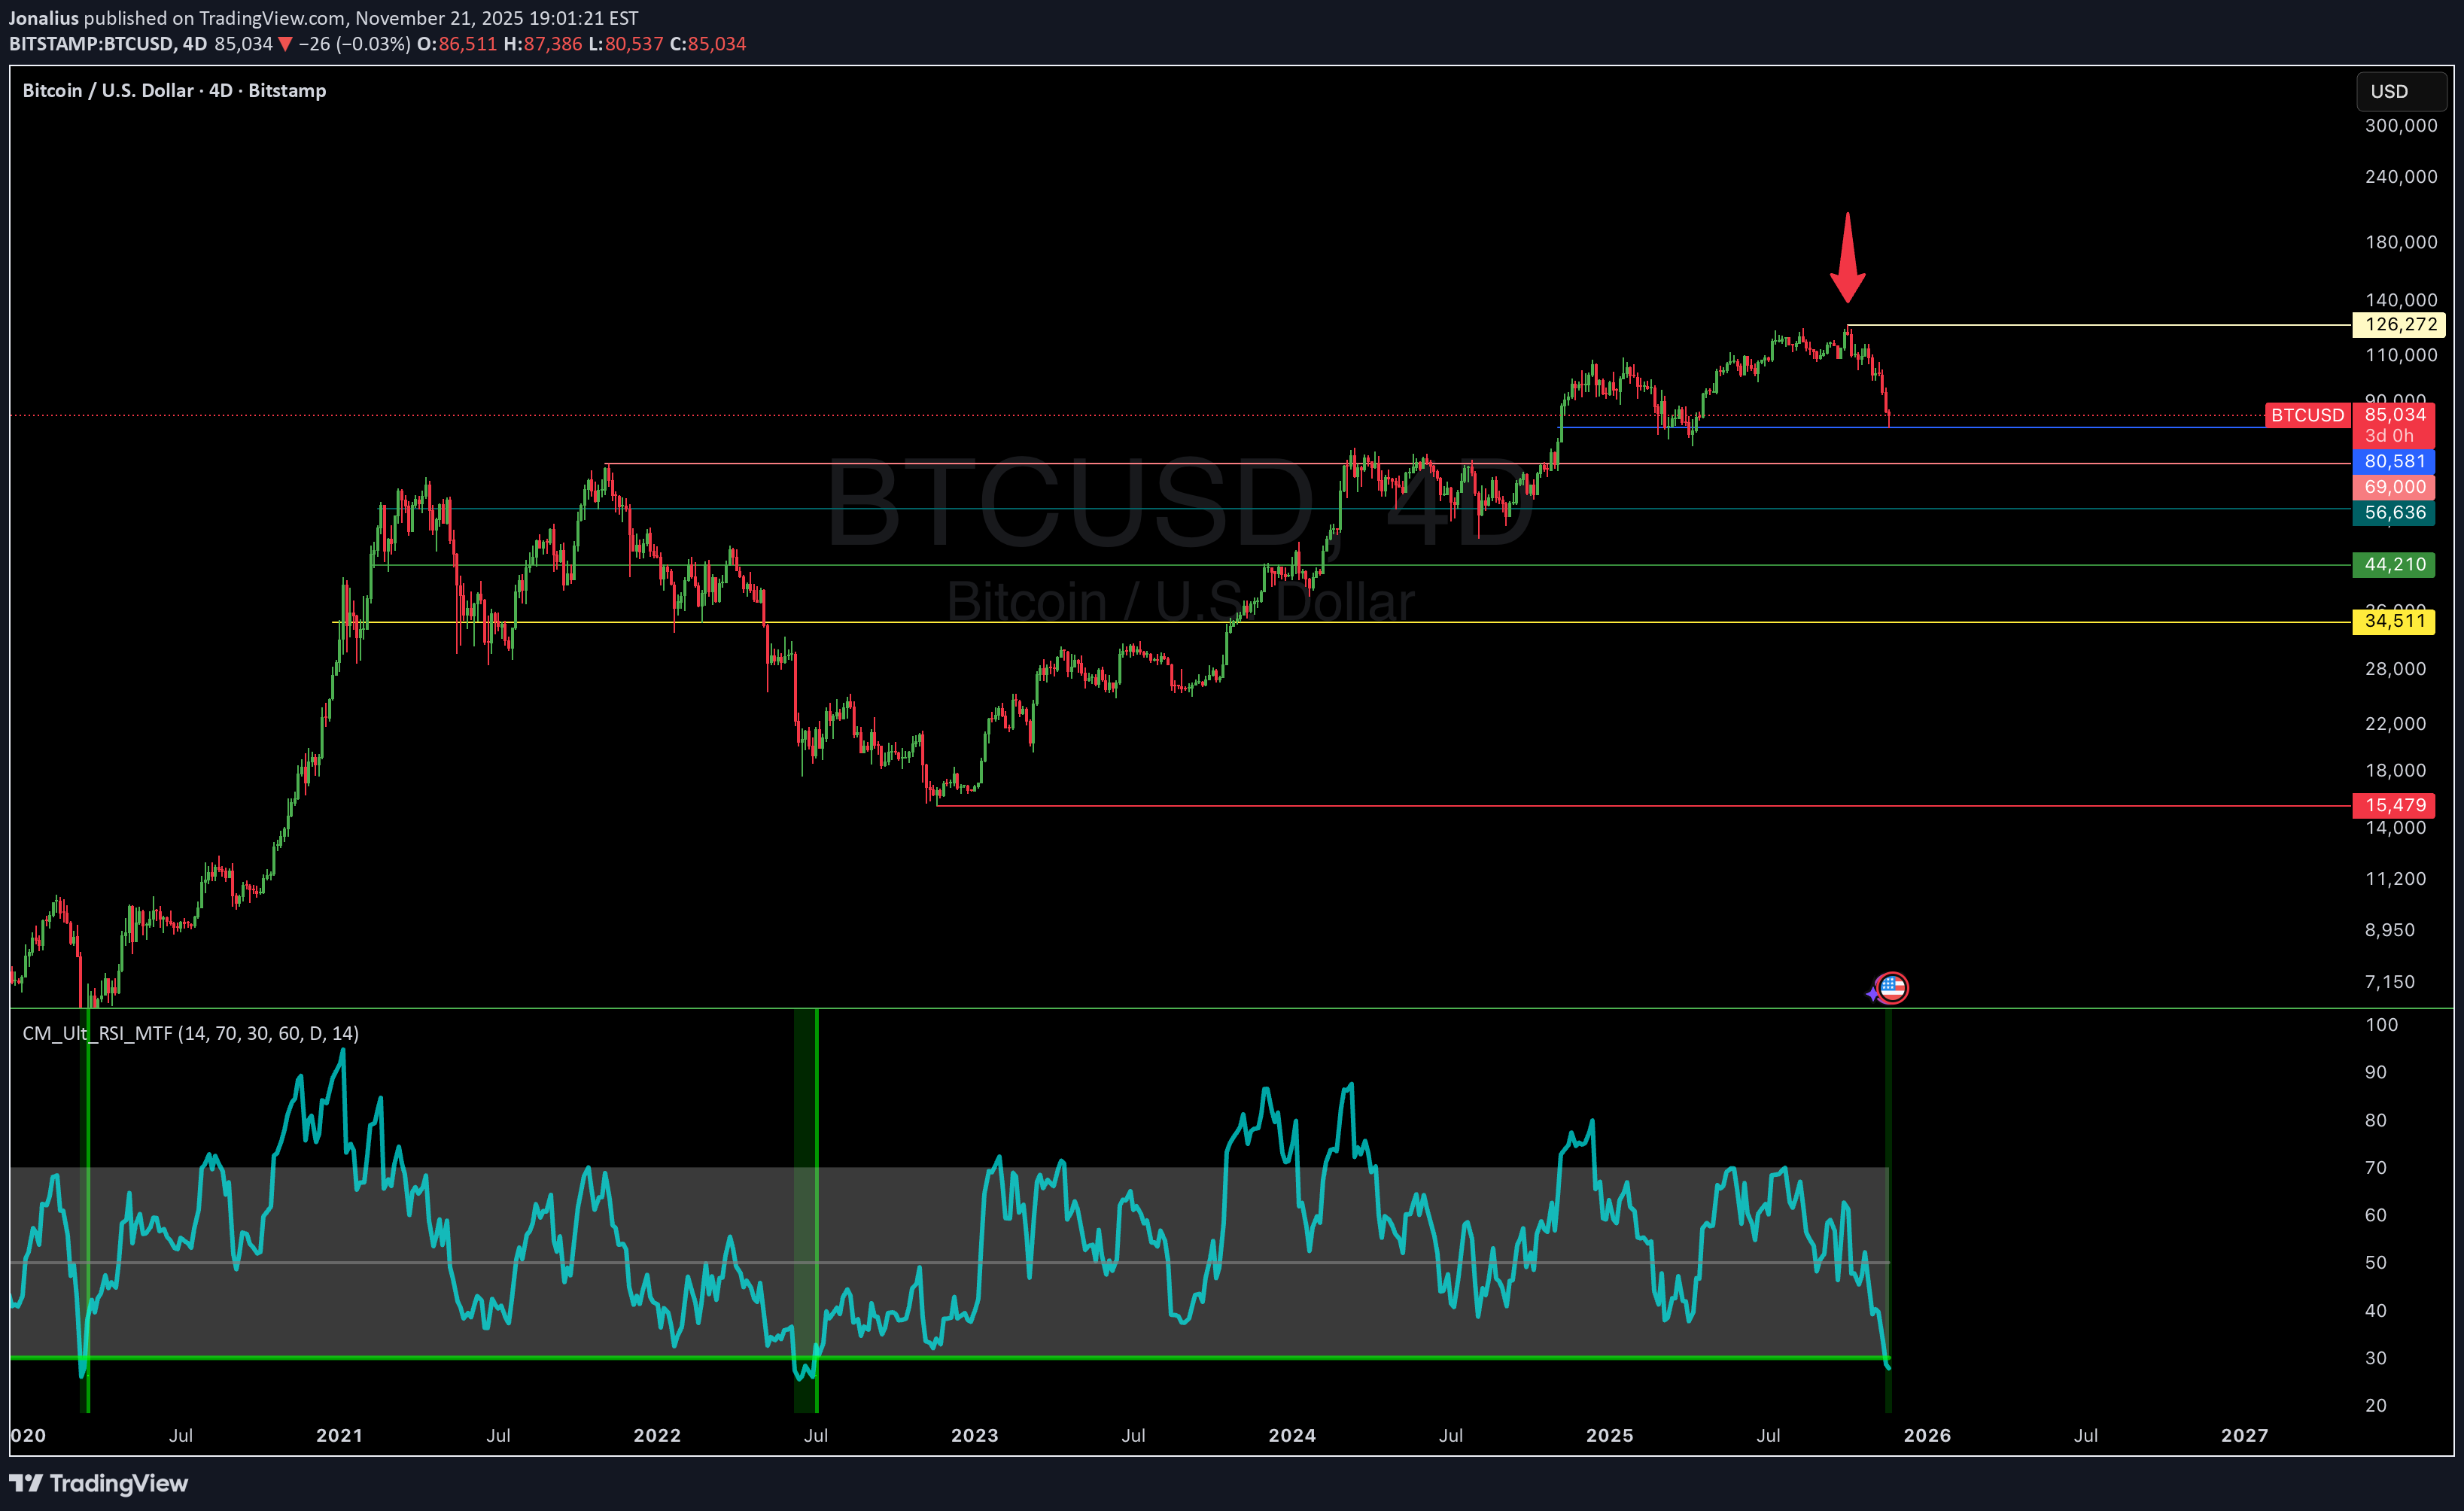
Following this recent correction on Bitcoin, we look into the charts to determine if further downside is ahead or if a rally back to new all-time highs is coming
Jonalius
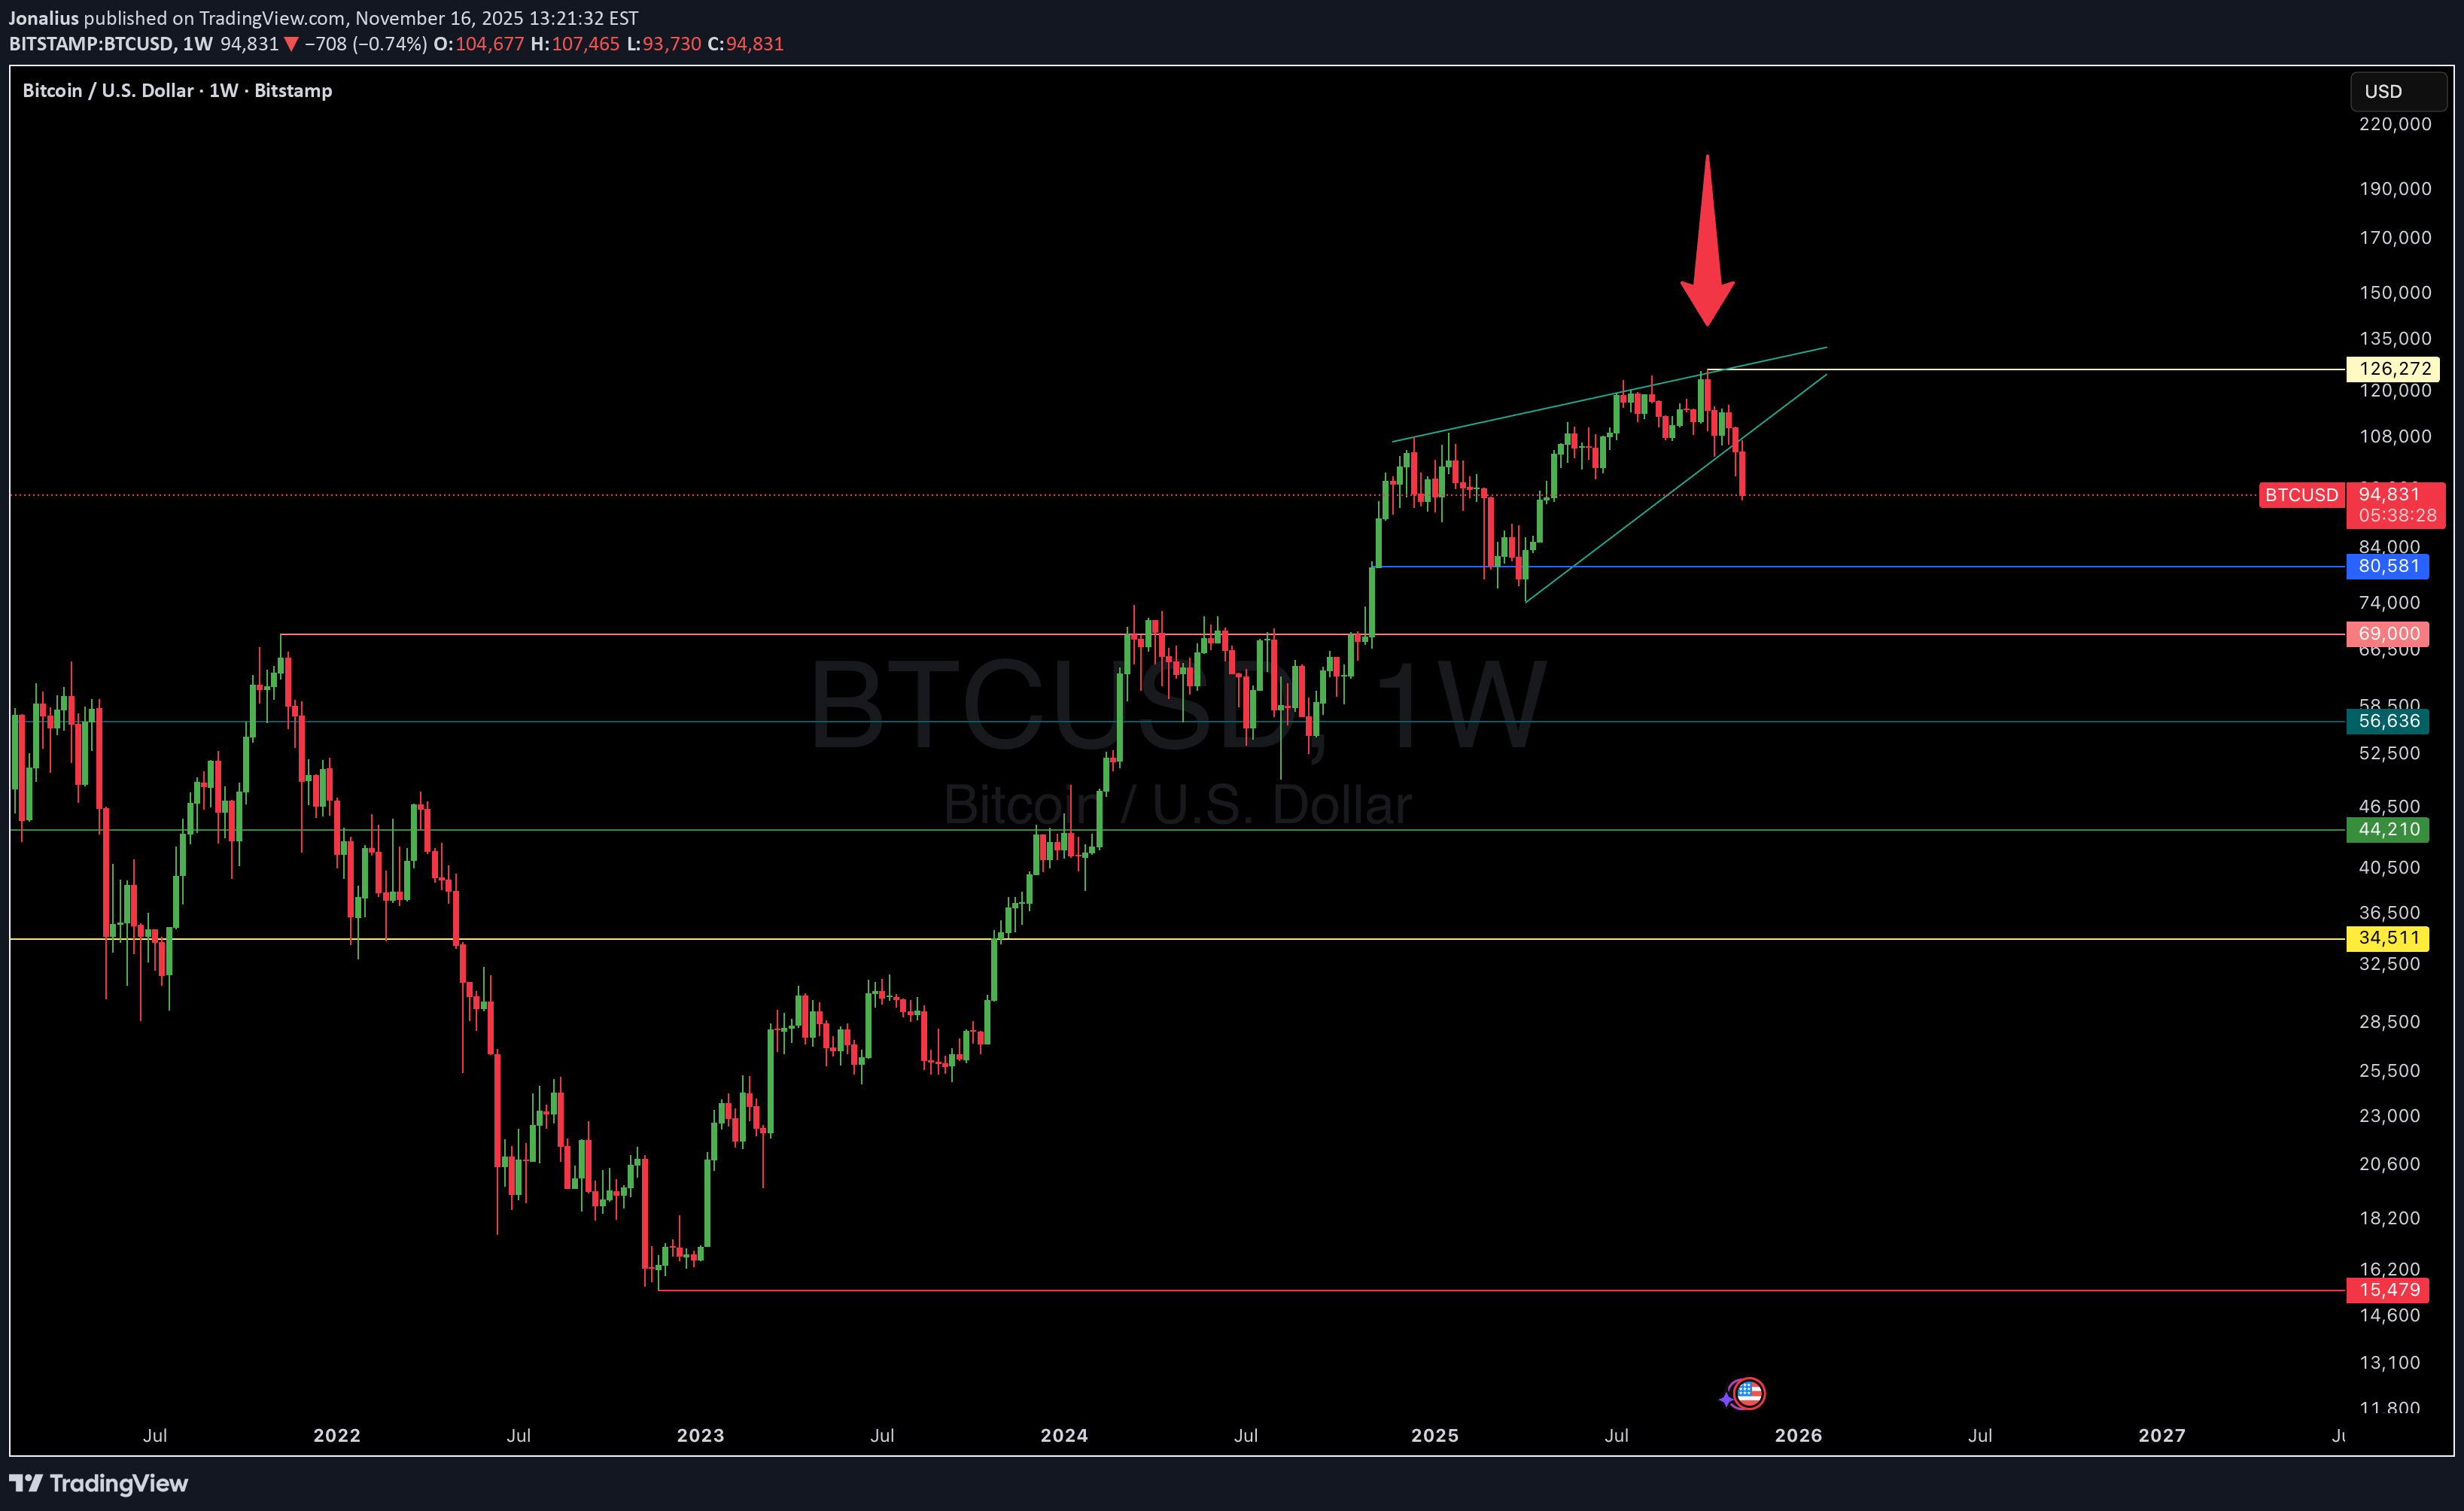
بیت کوین سقف زد؟ تحلیل شوکهکننده نمودارها و آینده طلایی 2027 و 2028!
Jonalius
پیشبینی هفتگی بازار: سهام داغ این هفته و برنامههای خرید AMD و انویدیا!
In this video going over my watchlist of individual stock names Also forgot to mention in addition to buying Shopify this week, I may be looking at small buys for AMD & potentially NVDA in the coming weeks ahead
Jonalius
تسلا در آستانه شکستن ۵۰۰ دلار: تحلیل صعودی امروز و دلایل حرکت سهم!
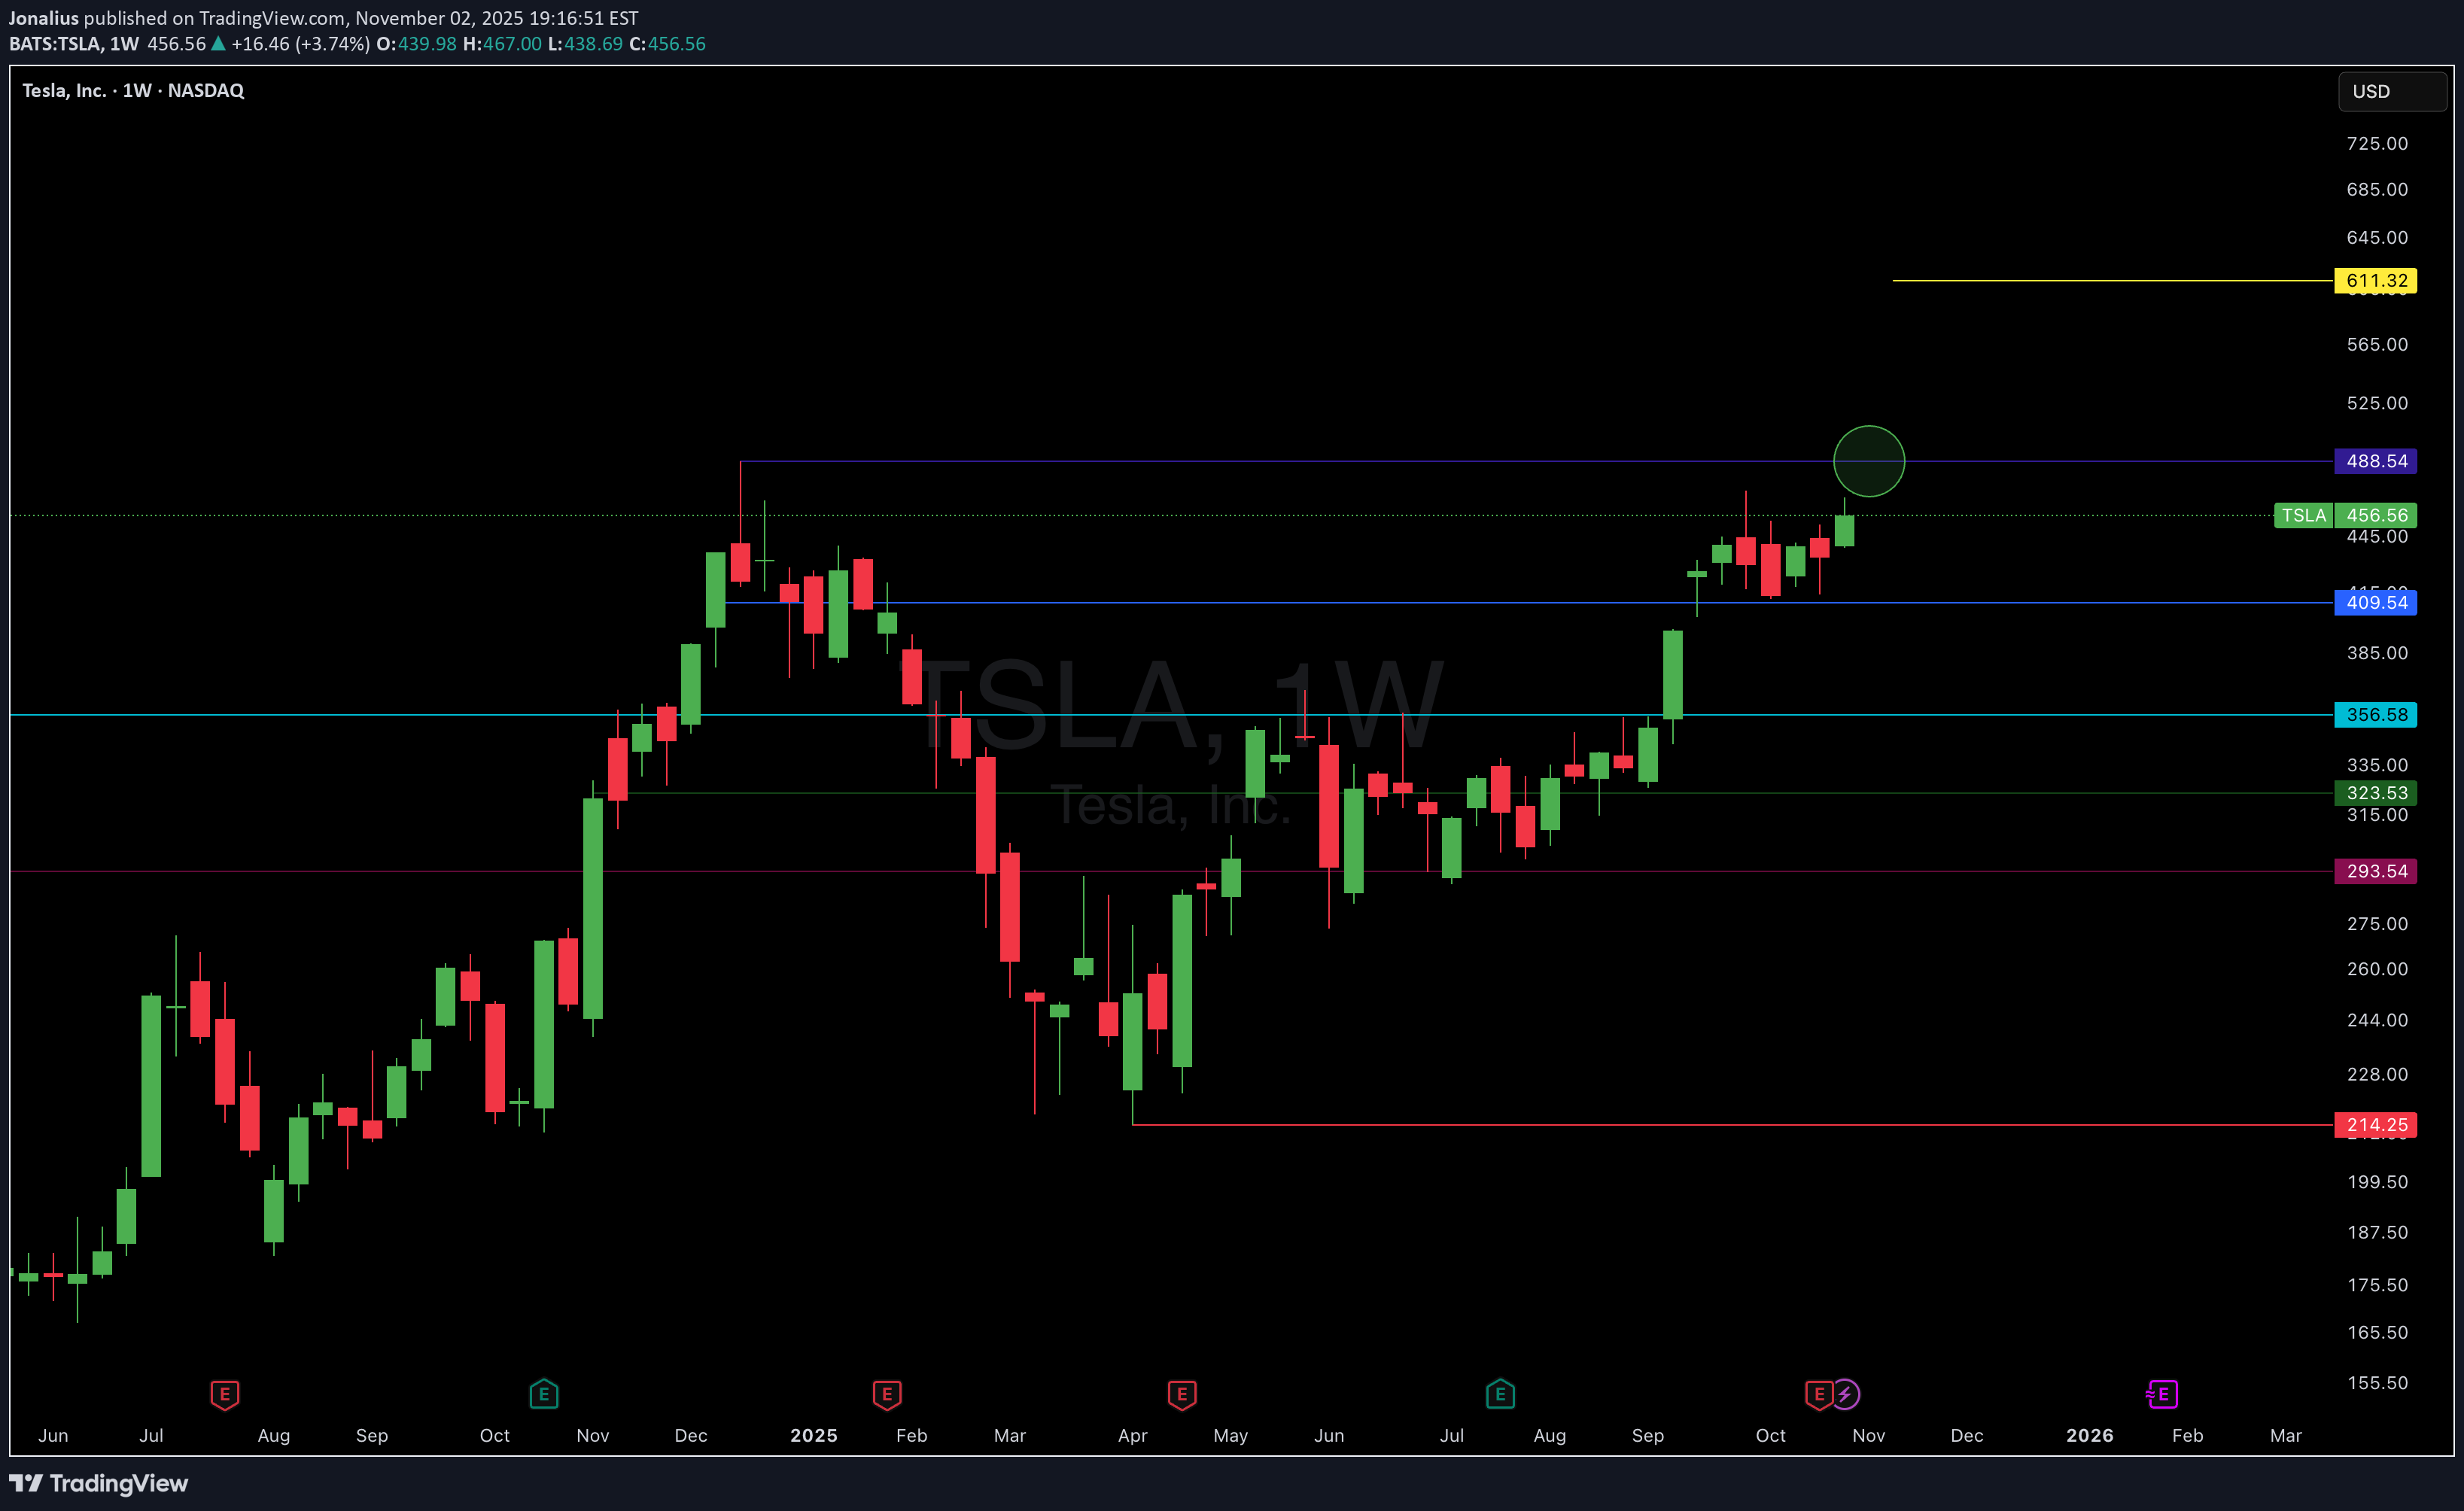
In this video, we look at the current setup on Tesla and I give my reasoning on why we are bullish
Jonalius
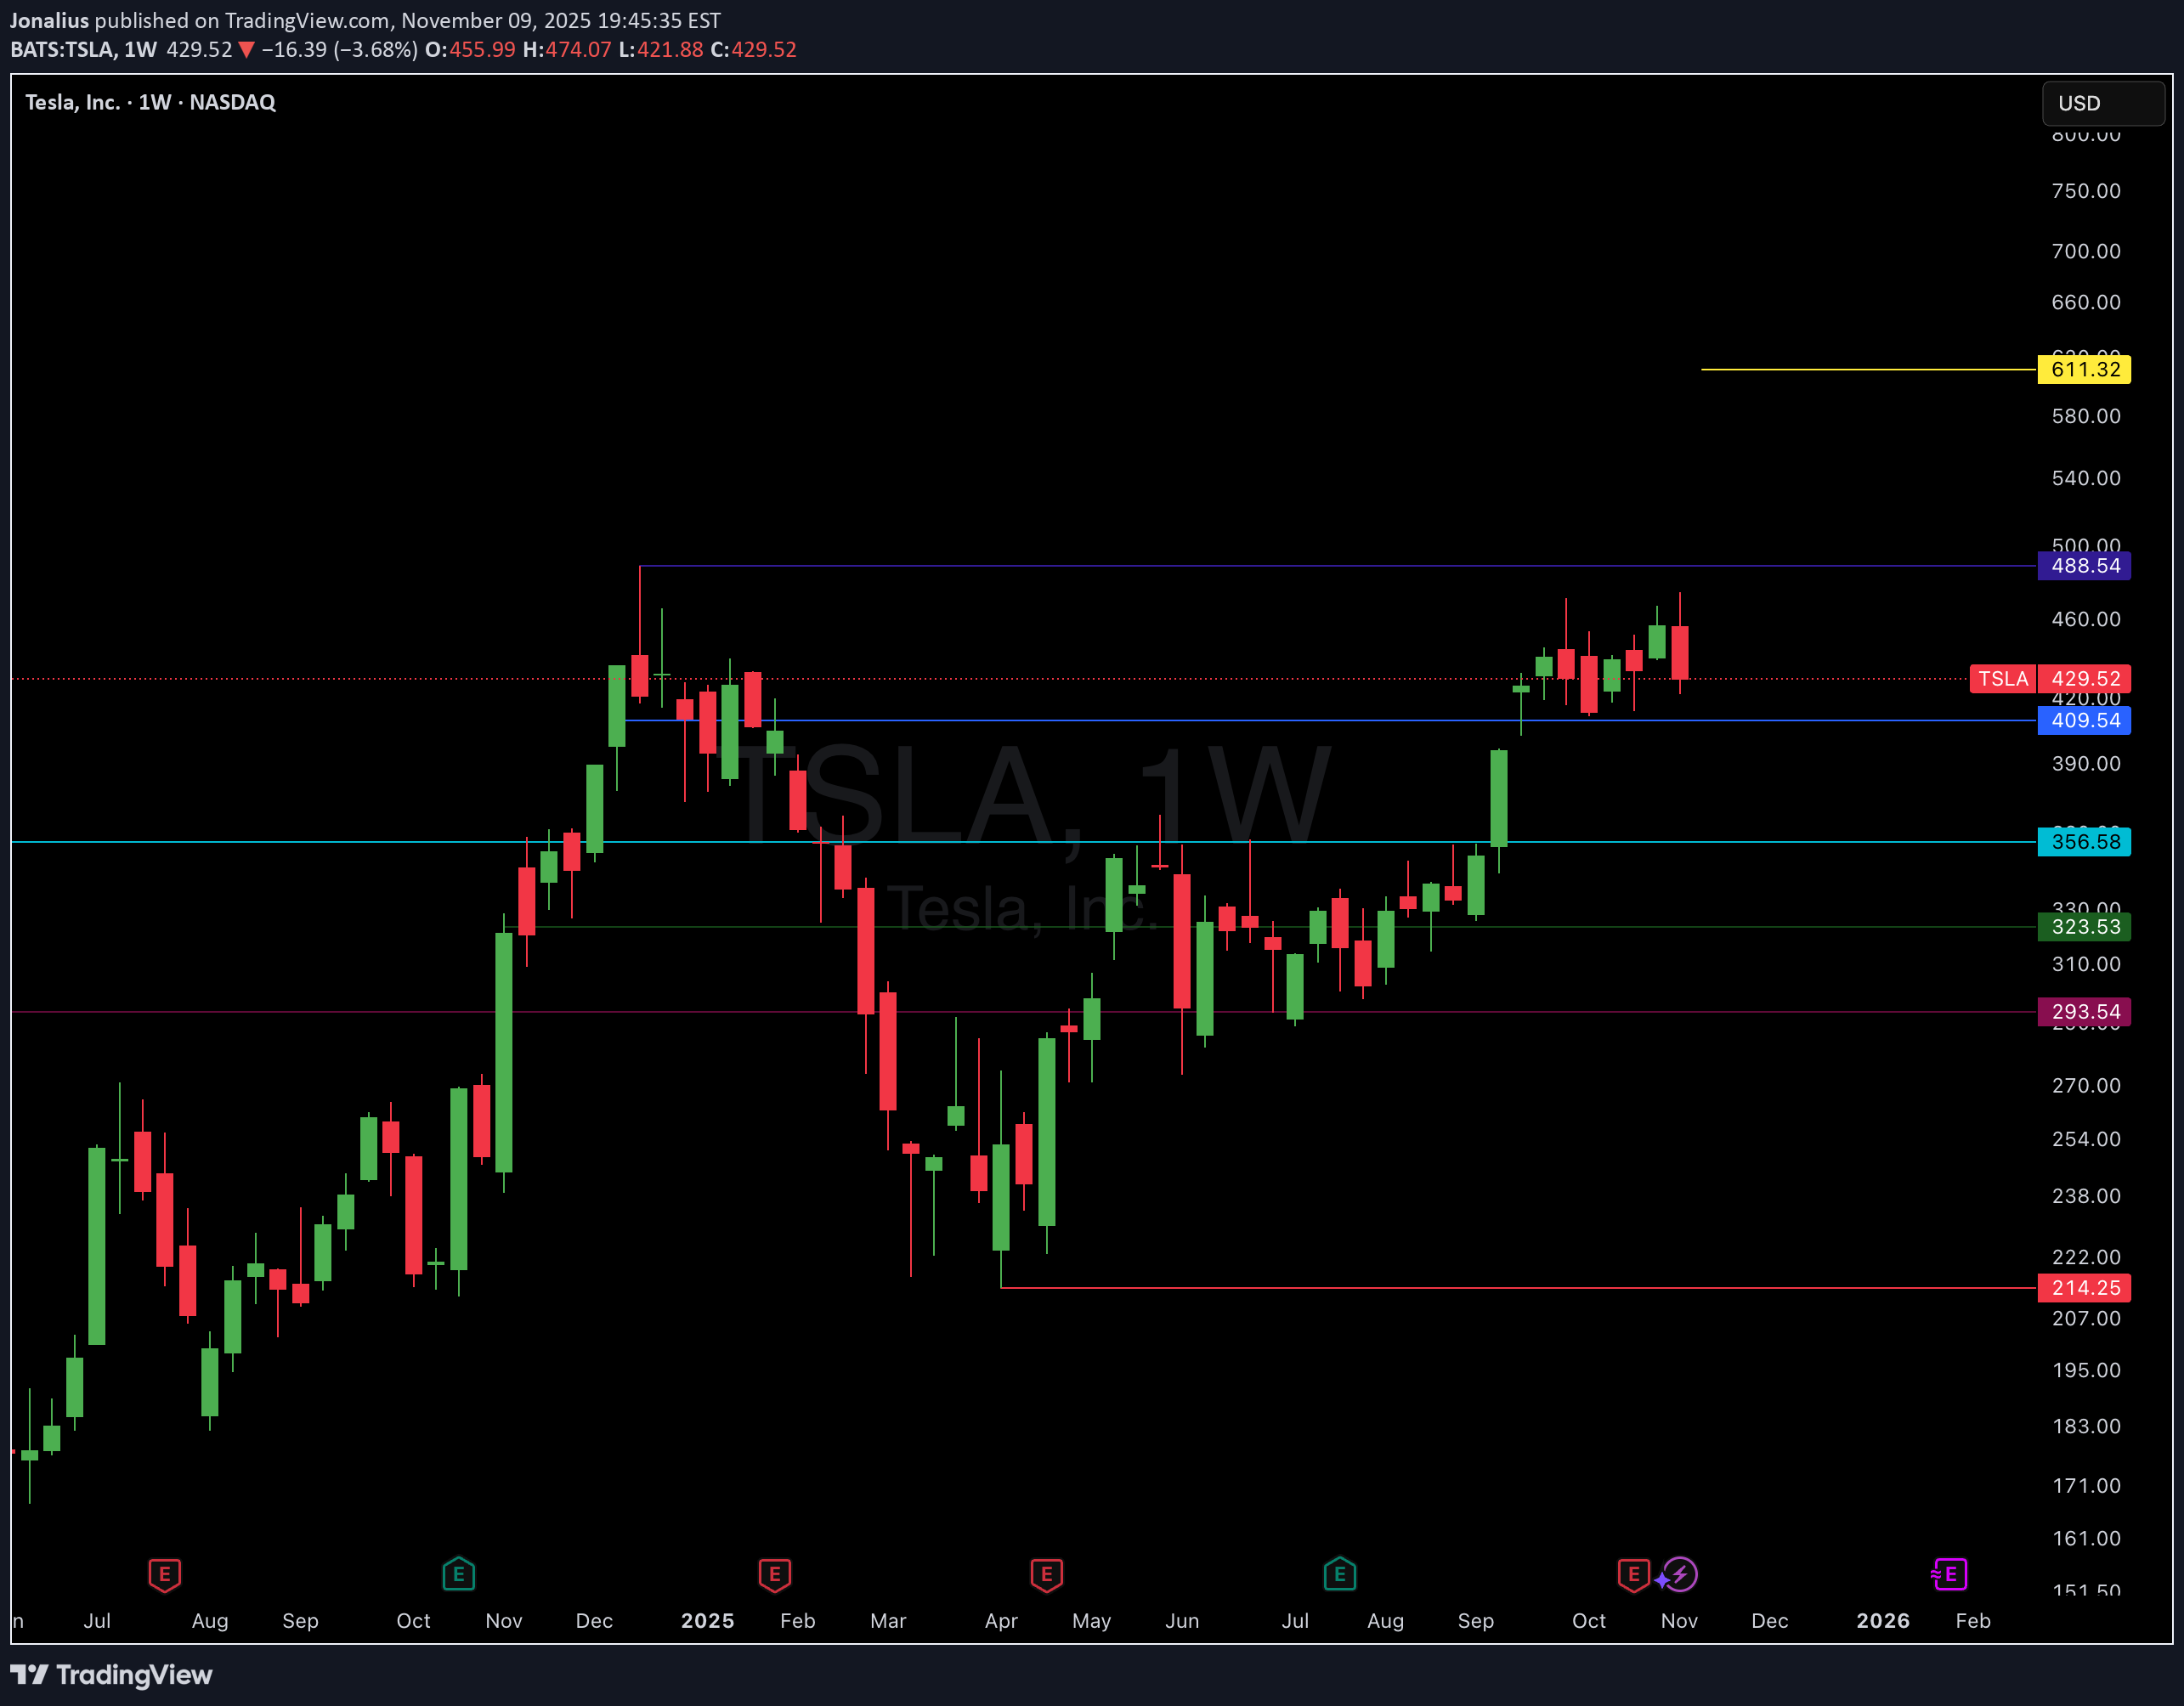
فشار خرید انفجاری تسلا (TSLA) در راه است؟ سیگنالهای بزرگ Q4 2025
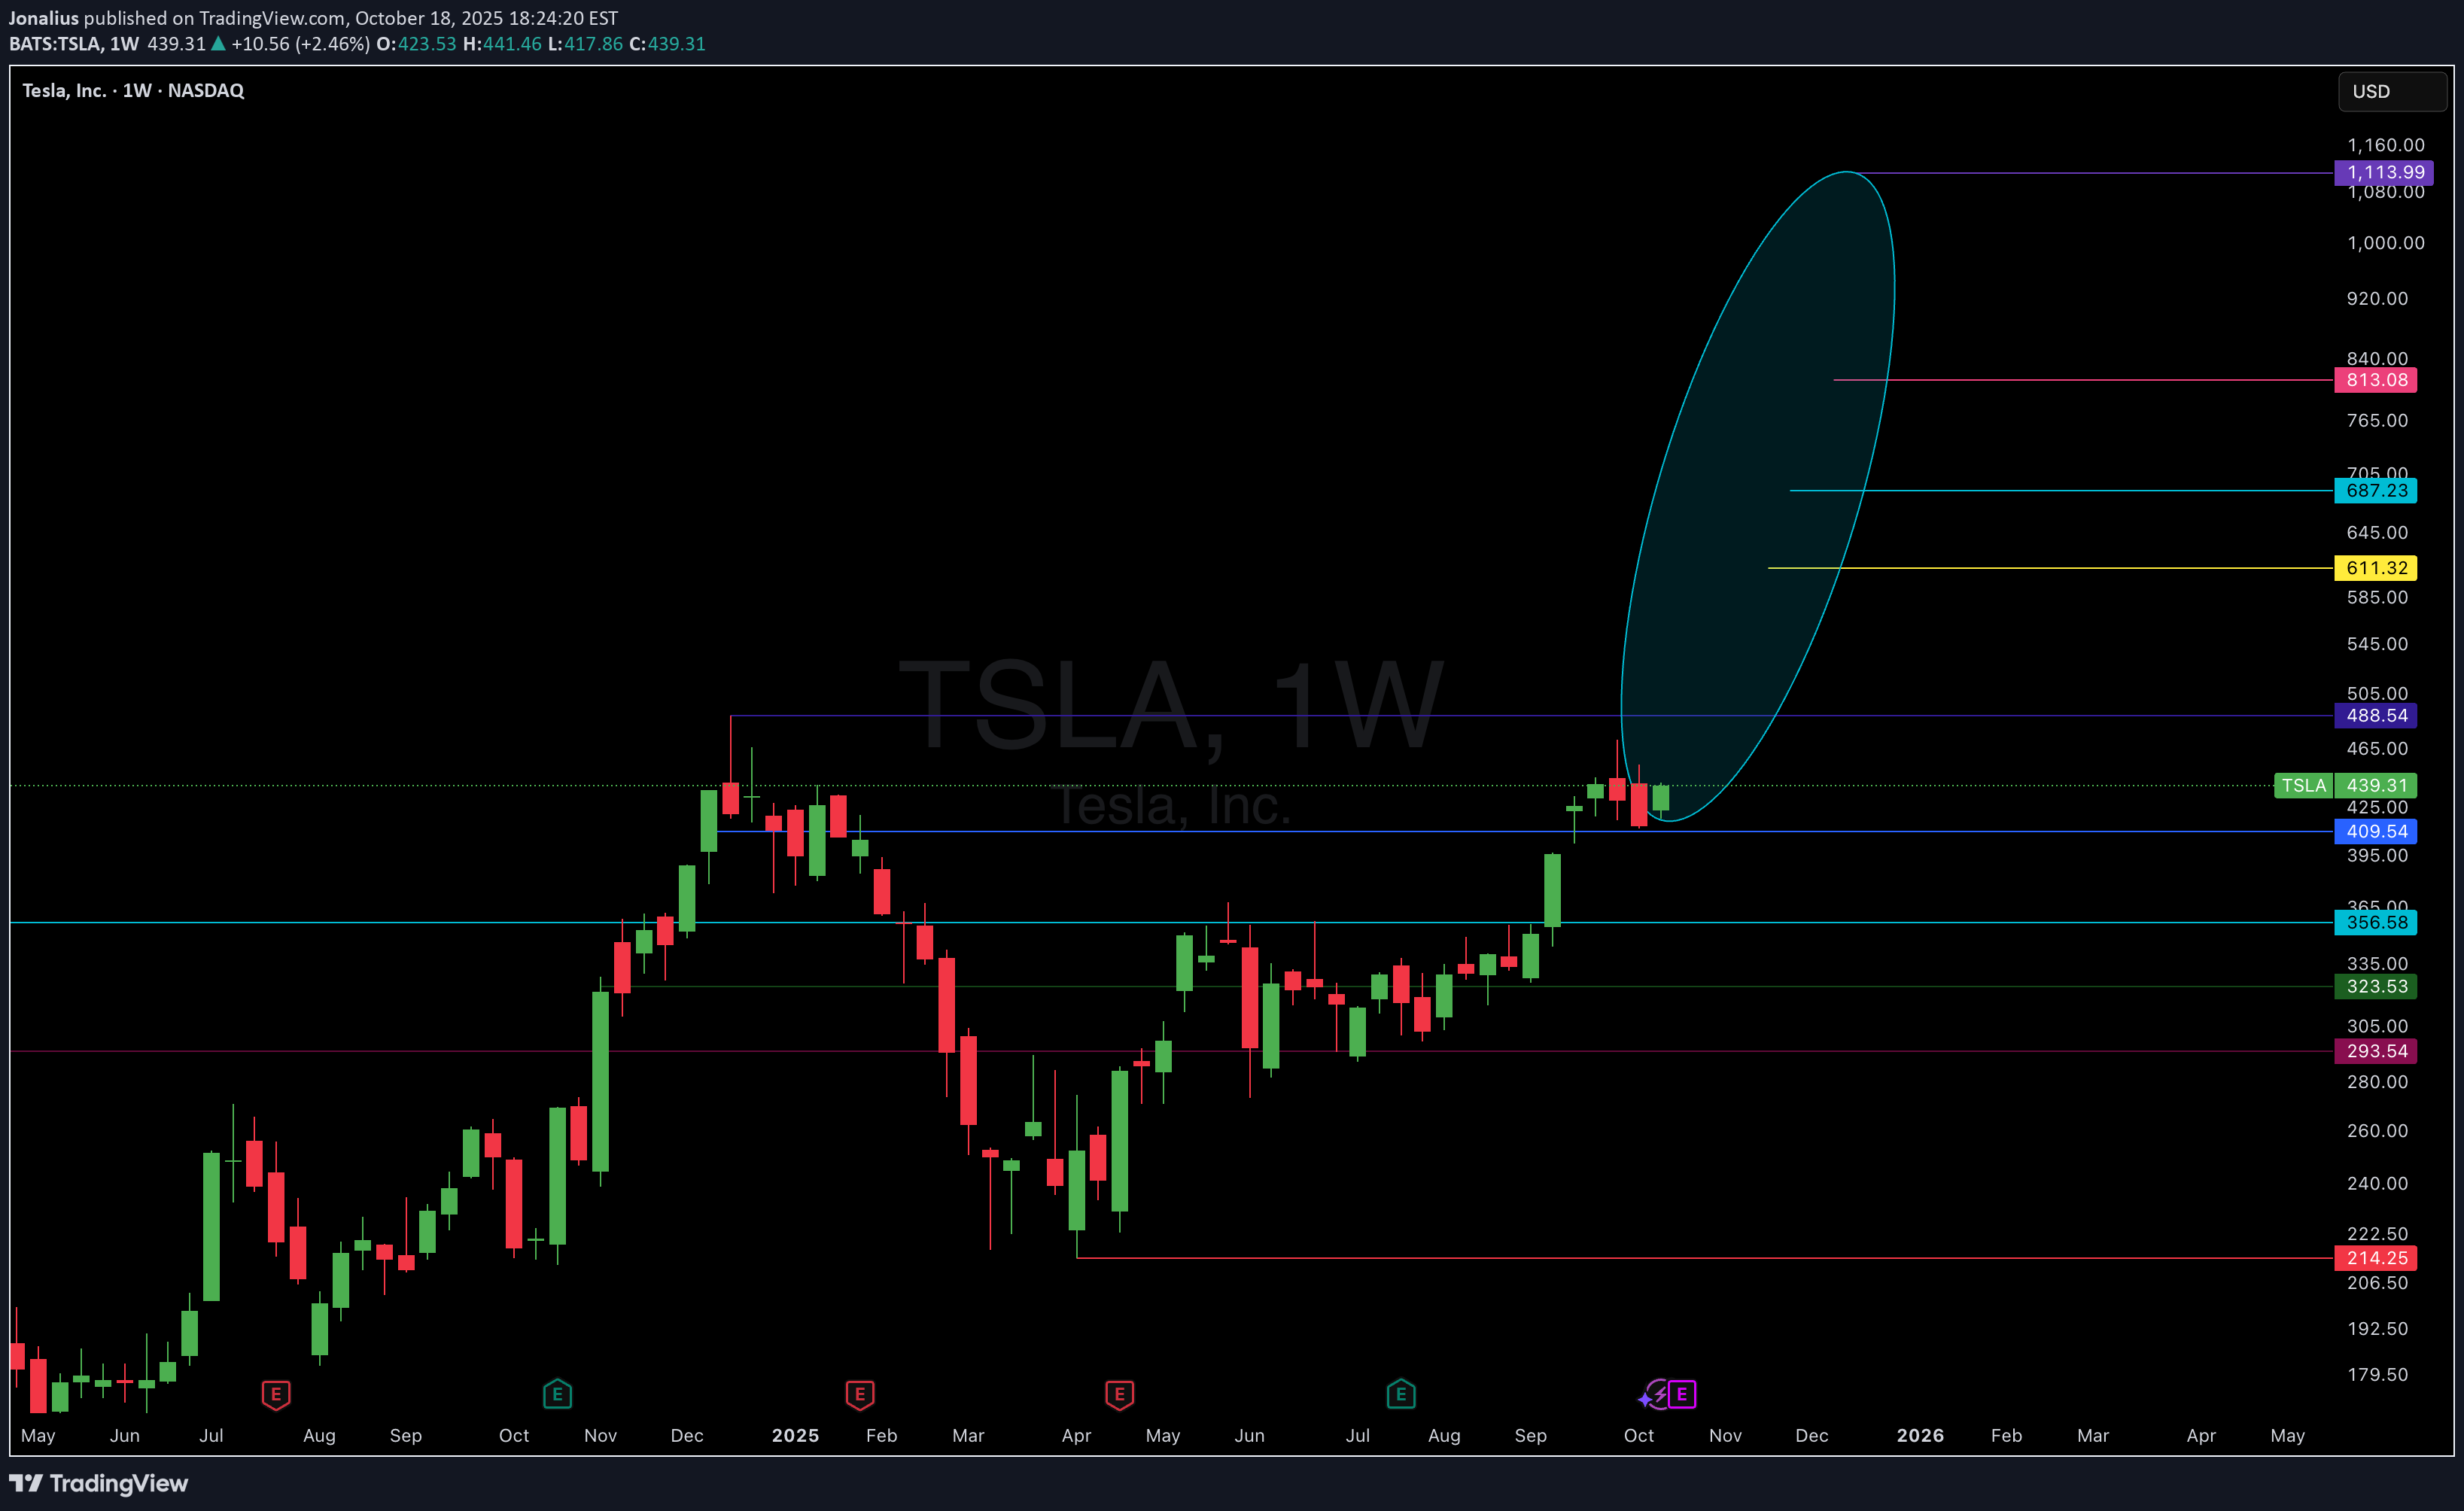
Tesla is showing us some very interesting signals on the daily, weekly and even the 3H chart that are worth covering in this video as it could have massive implications for what Q4 2025 may be looking like for Tesla stock TSLA
Jonalius
سیگنال تاریخی S&P 500: اولین بار از سال ۱۹۹۳ چه هشداری میآید؟
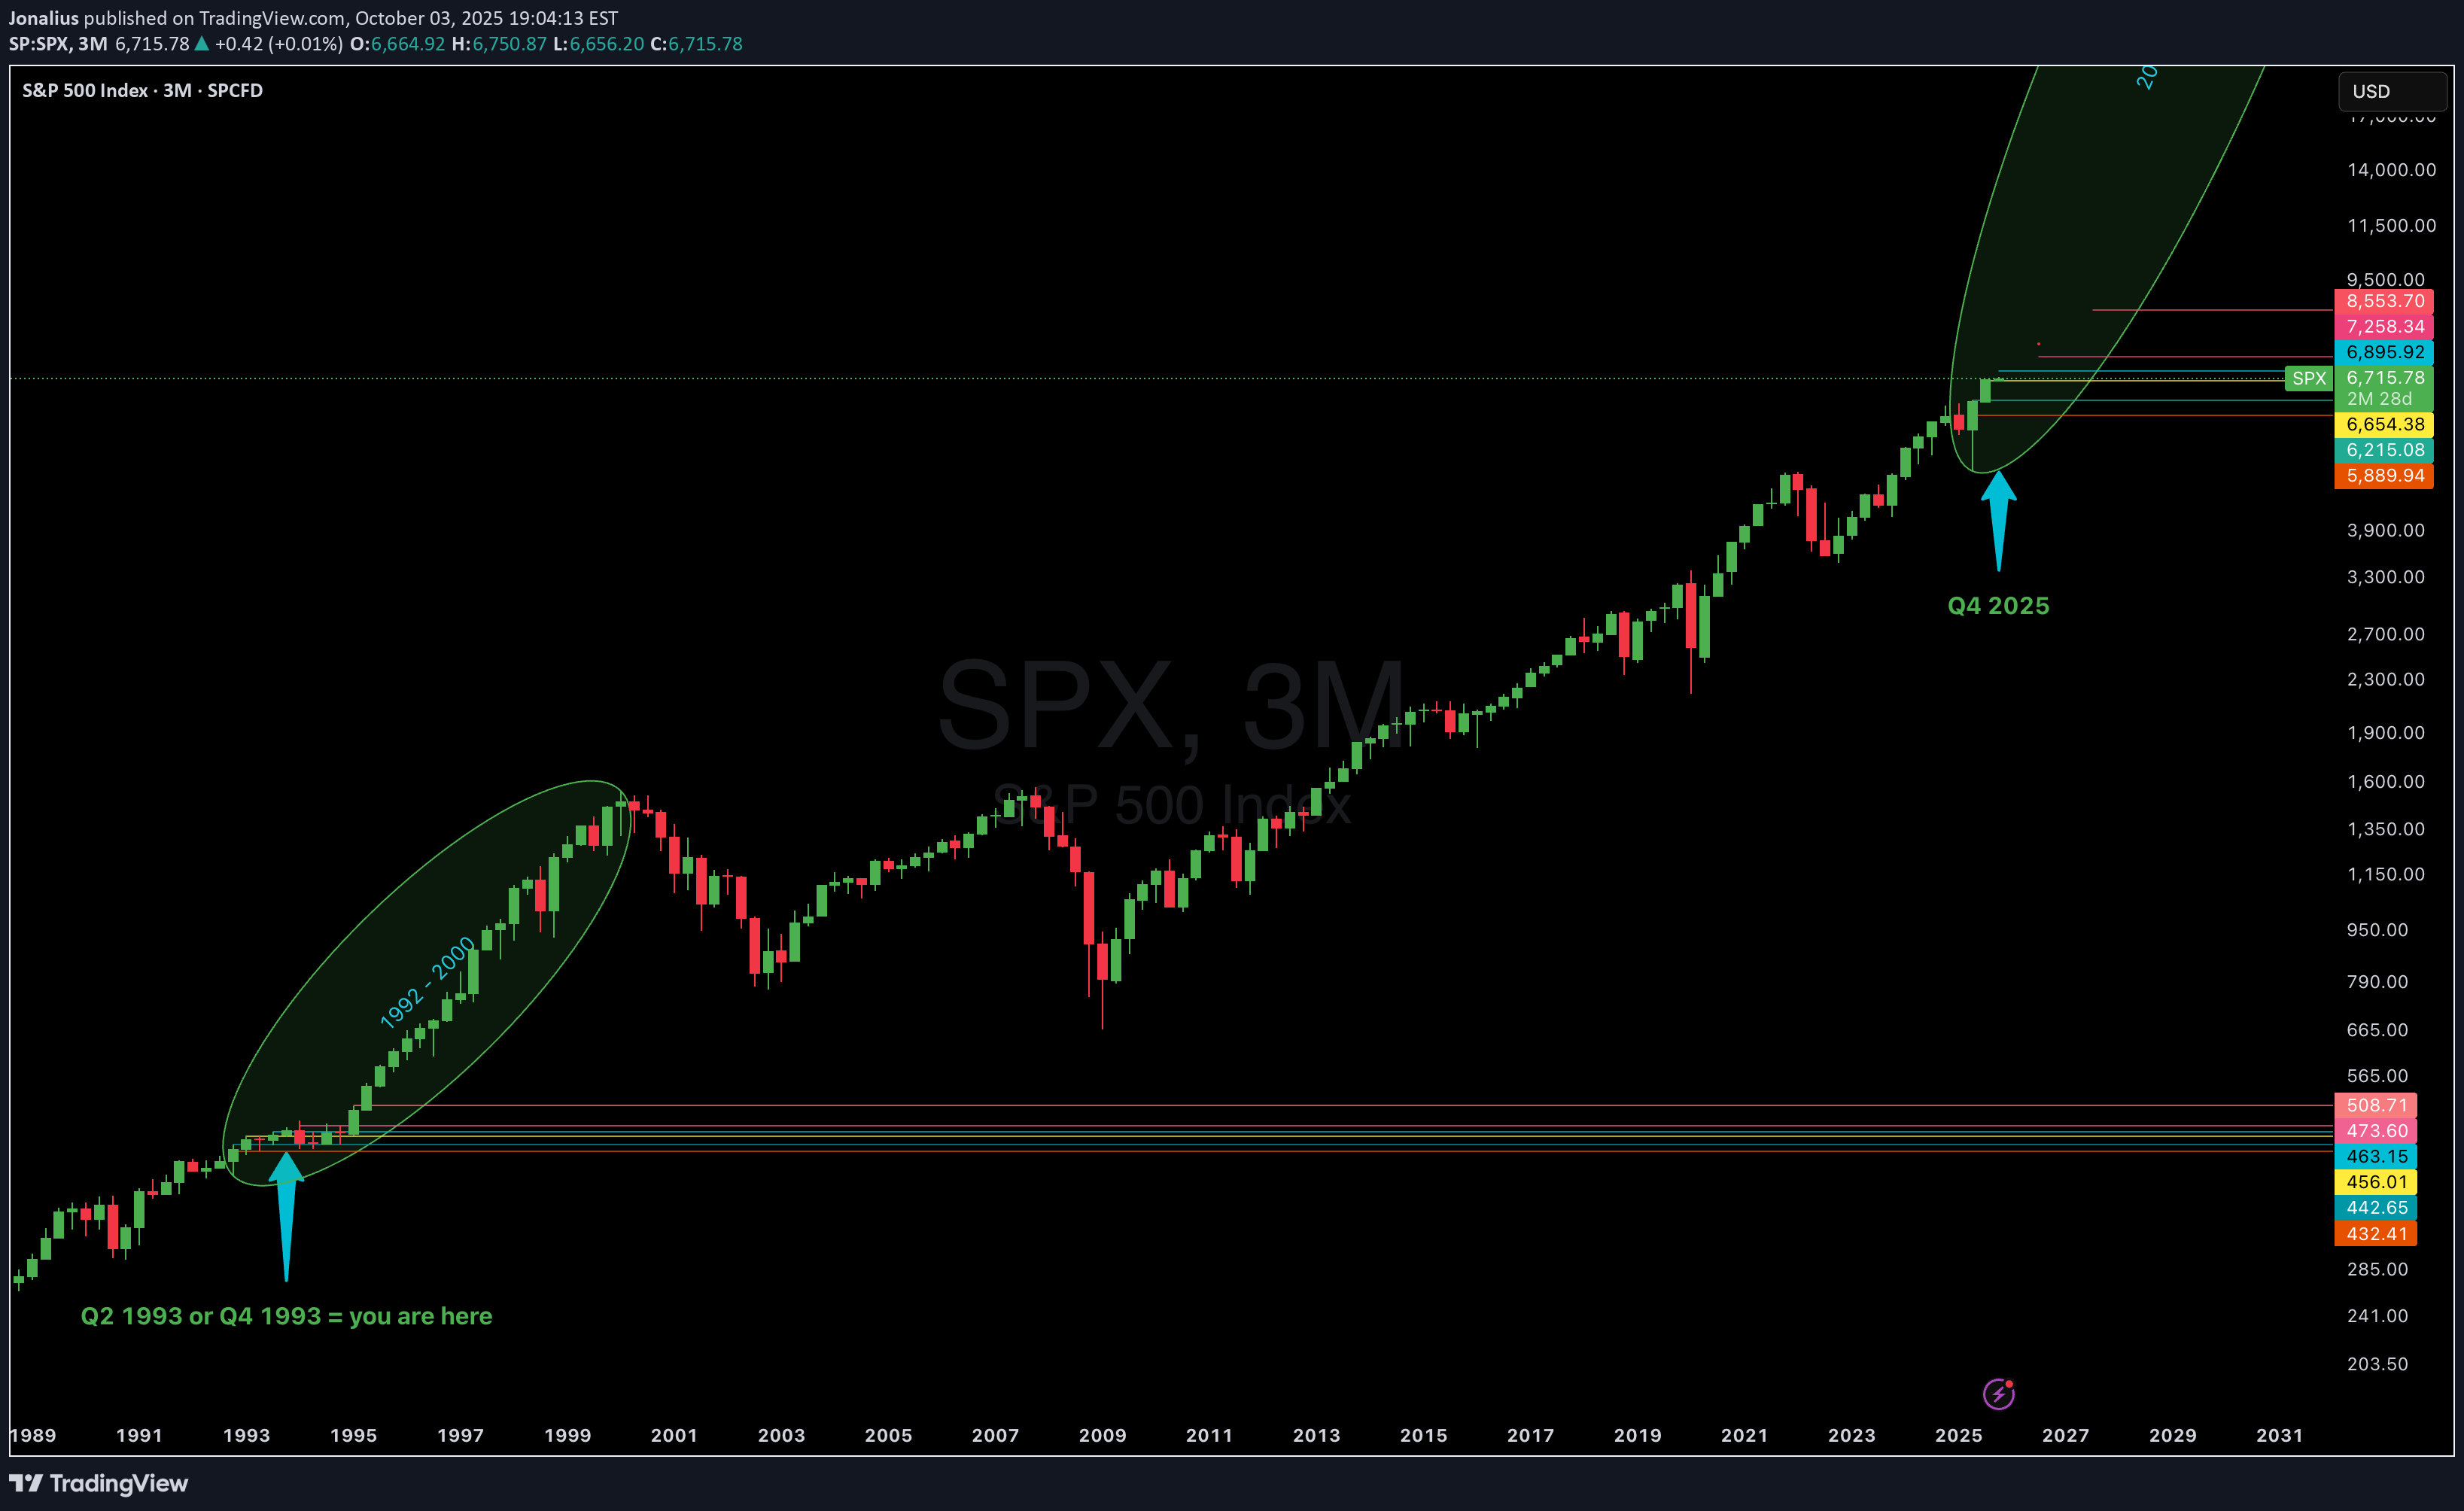
In this video, we're back on the three month chart of the S&P 500 and the data that just came through in this chart tells us a lot about what we could see in 2026 as far as a market correction and what to expect in the next bull market cycle!!!
Jonalius
آیا تسلا در آستانه انفجار قیمت (Short Squeeze) است؟ زمان آن فرا رسیده!
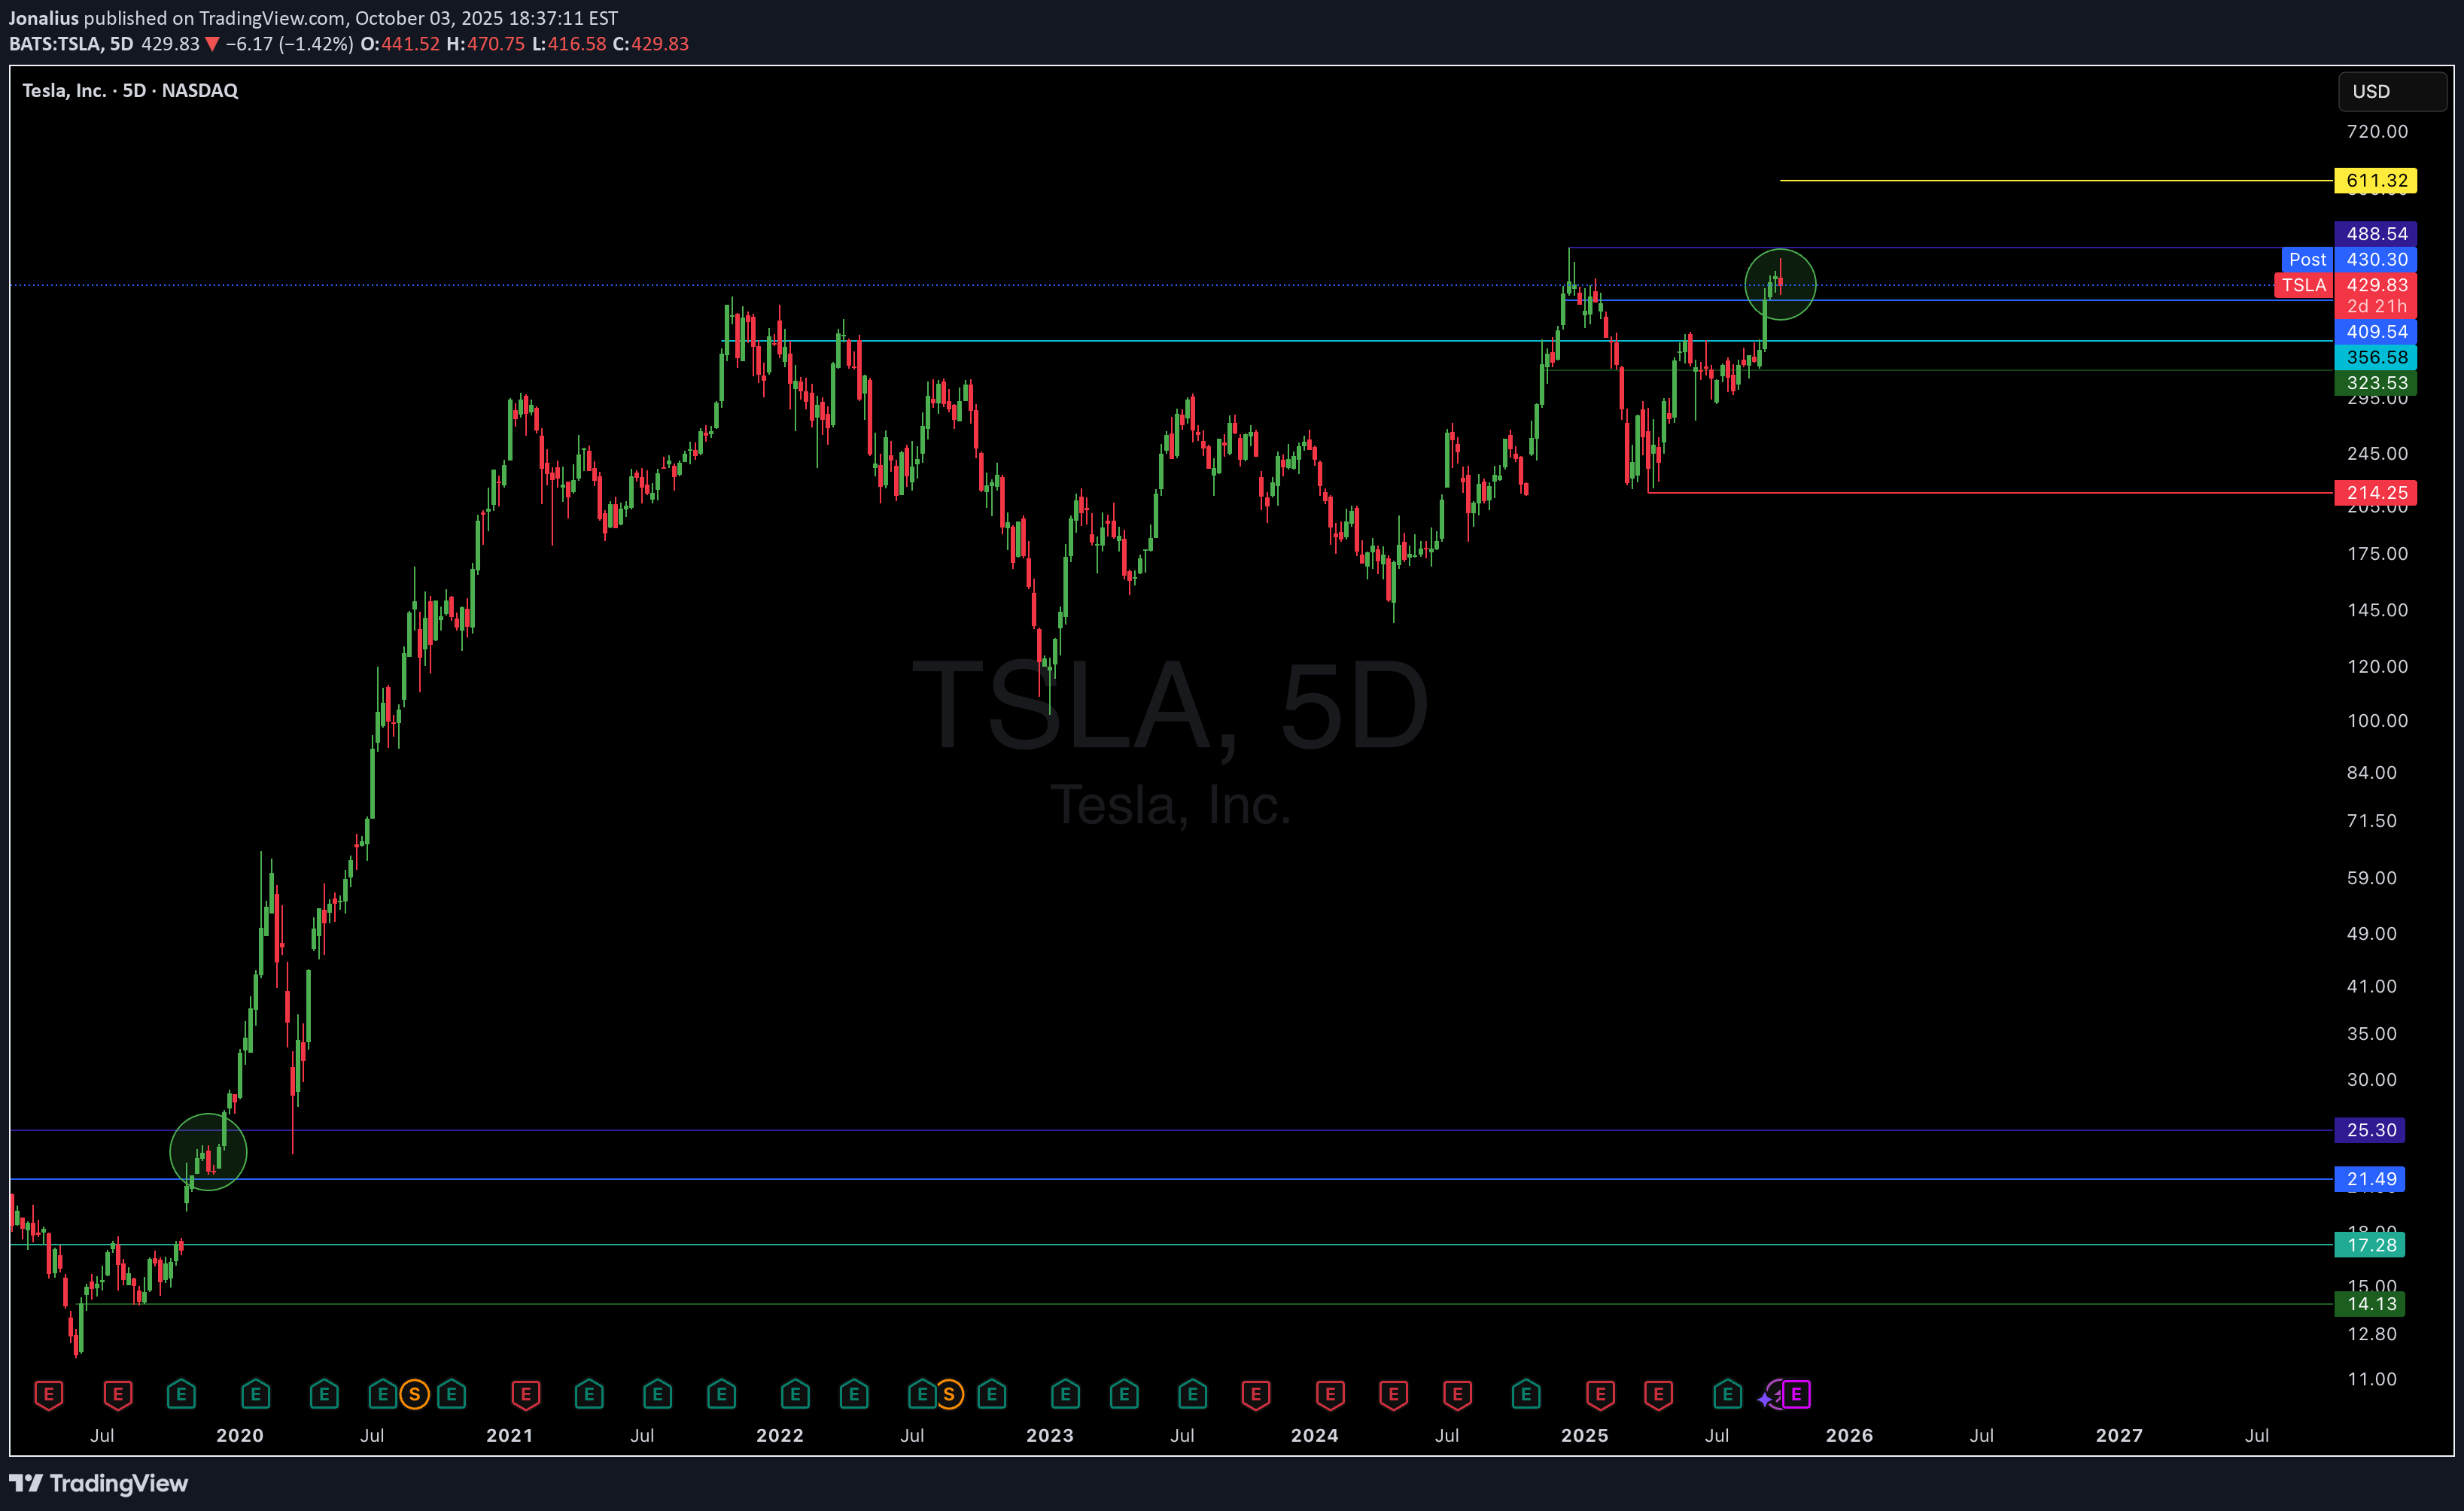
In this video we discussed the possibility of Tesla taking another leg higher beyond $500 and what technical signals to look out for in the charts
Jonalius
HOW MUCH HIGHER CAN TESLA GO? (September 17, 2025)

Since my last video Tesla stock is up over 25% in the past week and we are breaking a very key Fibonacci levels. In this video, we look at a higher timeframe charts to determine if Tesla can keep pushing towards $600 and $1000 in the coming months ahead given how much it is outperforming everything else in the stock market
Jonalius
TESLA TO $410 SOON? (September 7, 2025)
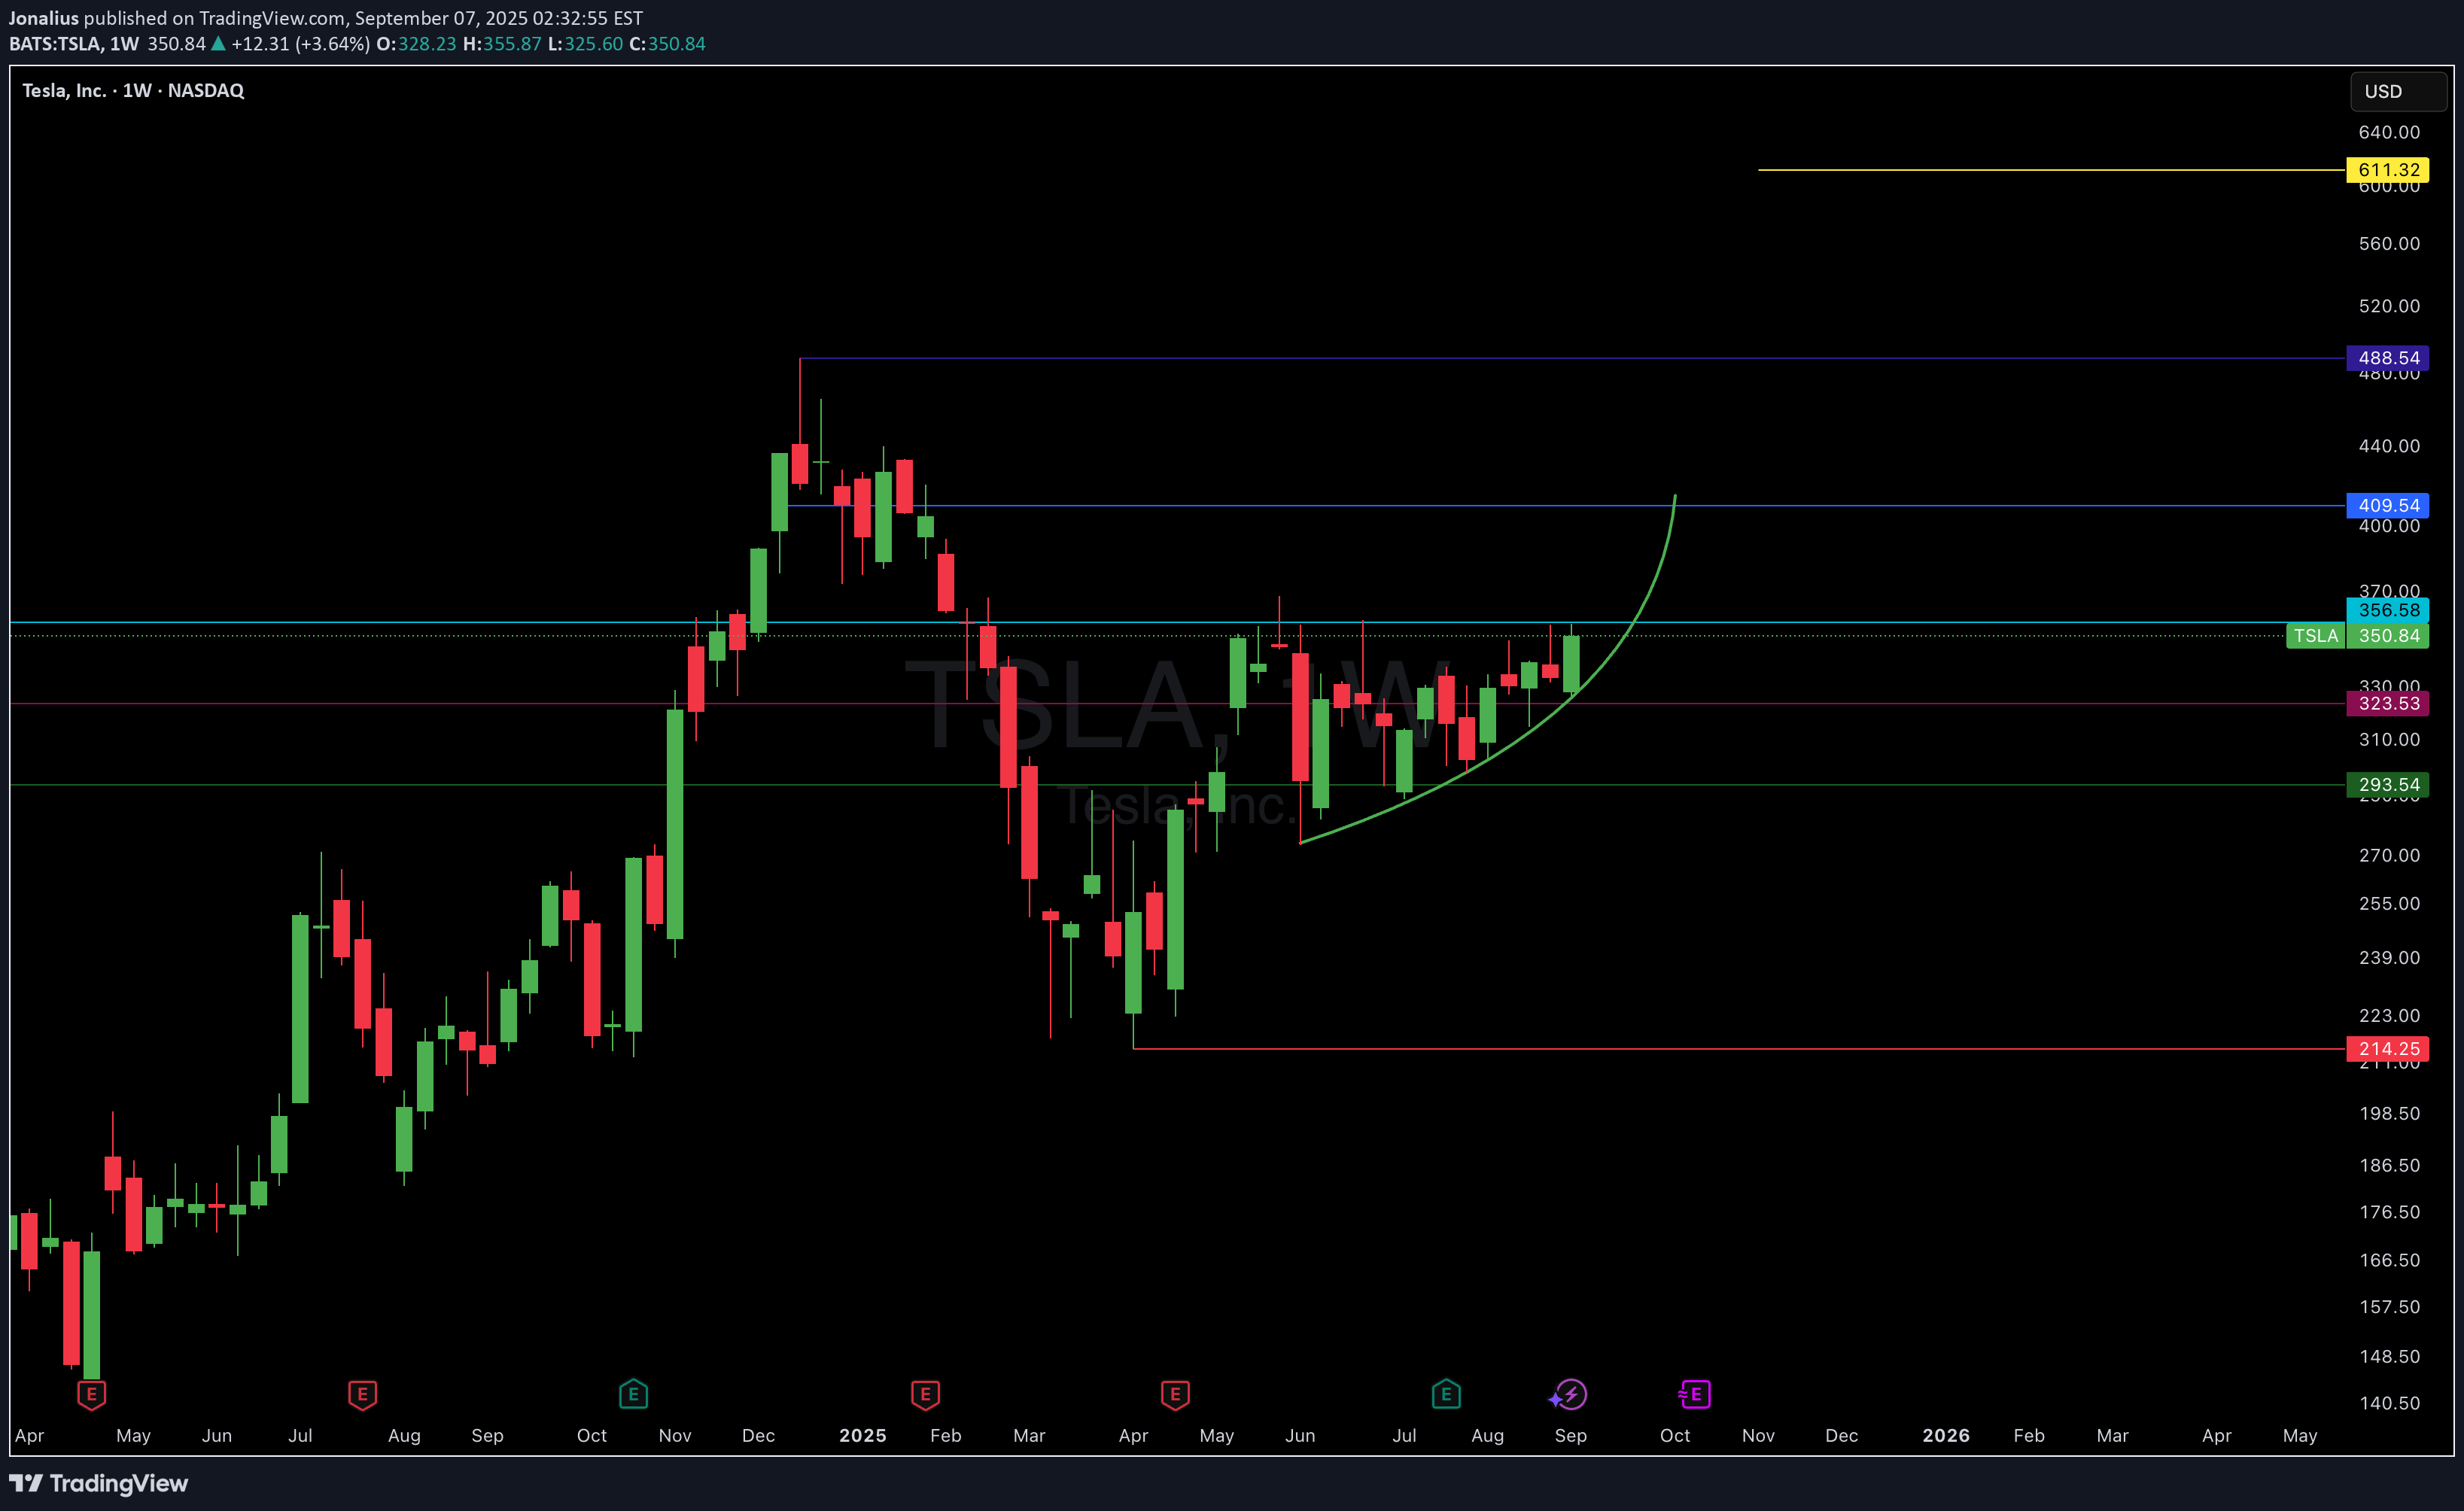
In this video, we look at Tesla stock from numerous time frames together at the evidence presented for new all-time highs
Jonalius
TESLA BACK TO $400+?

TSLA is starting to look good once again, here's what's likely around the corner!
Disclaimer
Any content and materials included in Sahmeto's website and official communication channels are a compilation of personal opinions and analyses and are not binding. They do not constitute any recommendation for buying, selling, entering or exiting the stock market and cryptocurrency market. Also, all news and analyses included in the website and channels are merely republished information from official and unofficial domestic and foreign sources, and it is obvious that users of the said content are responsible for following up and ensuring the authenticity and accuracy of the materials. Therefore, while disclaiming responsibility, it is declared that the responsibility for any decision-making, action, and potential profit and loss in the capital market and cryptocurrency market lies with the trader.