
Jitendra_Verma
@t_Jitendra_Verma

What symbols does the trader recommend buying?
Purchase History
پیام های تریدر
Filter
Jitendra_Verma
تشکیل مثلث متقارن ZEC: سطحهای کلیدی و سناریوهای معاملاتی انفجاری (صعودی/نزولی)
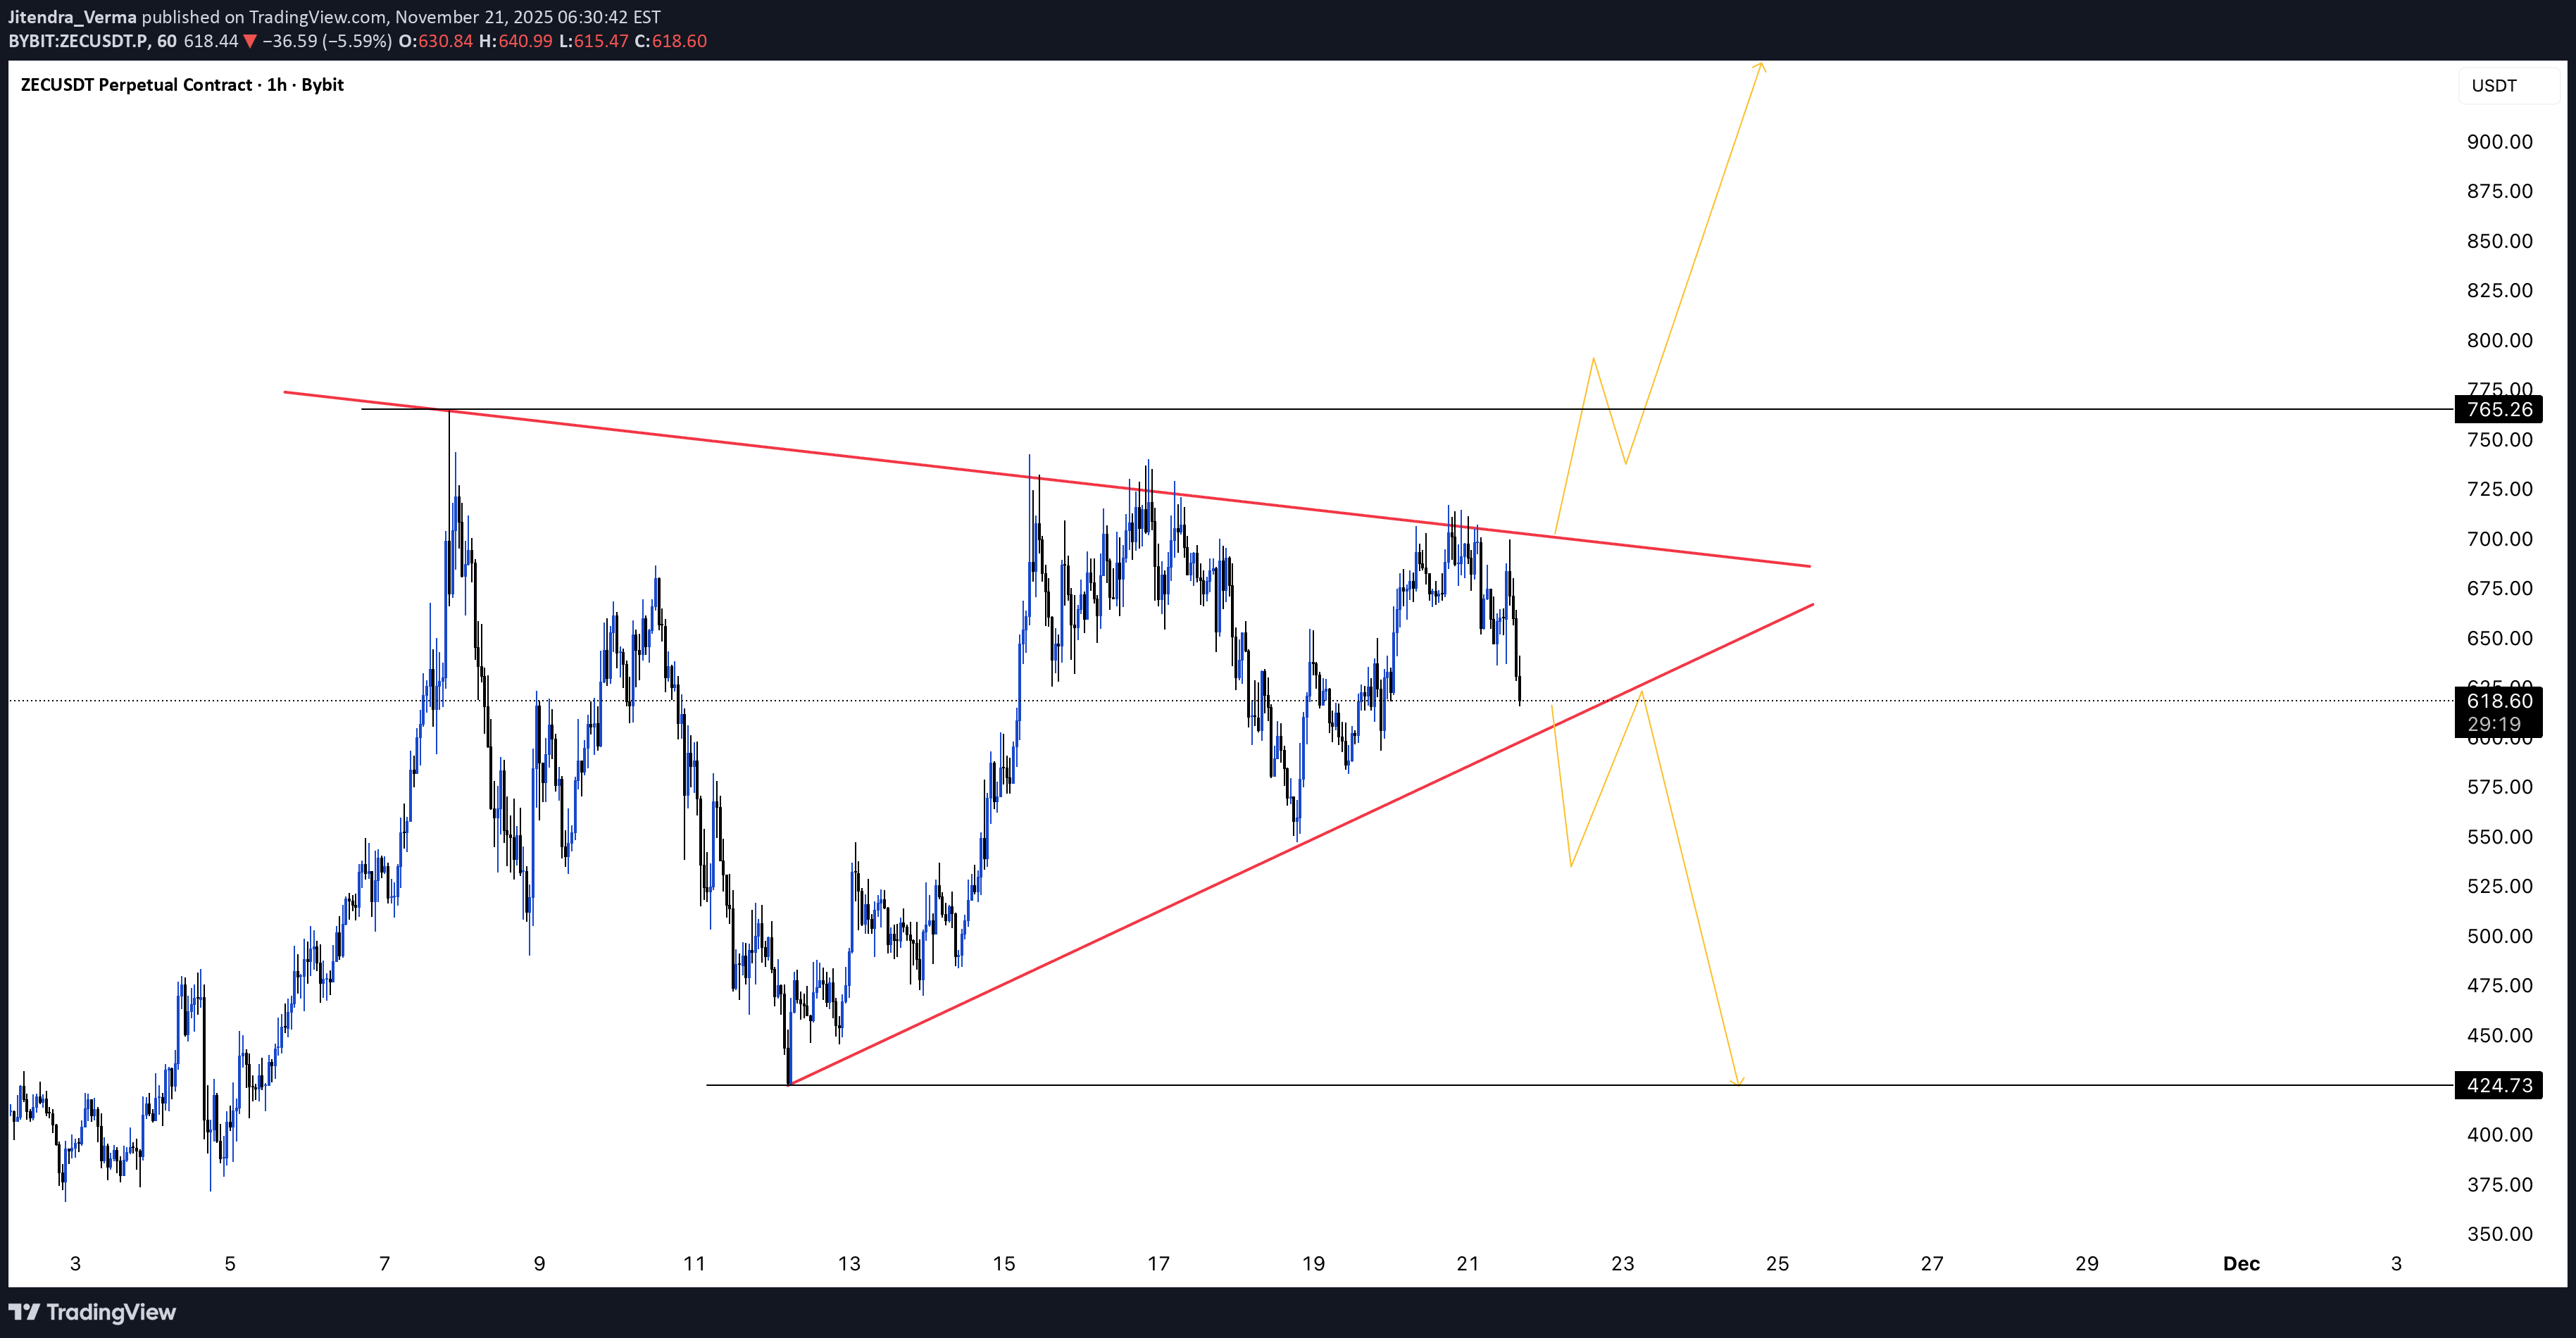
📌 Pattern Overview •The chart is forming a Symmetrical Triangle, highlighted by converging trendlines. •Volatility compression is visible as price prints lower highs + higher lows. •This structure typically appears during a mid-trend pause, often a continuation pattern. ⸻ 📉 Key Levels Support •600 — ascending trendline support •424 — projected downside target (measured move) Resistance • 700 — descending trendline resistance •76— key horizontal resistance ⸻ 📈 Market Outlook •Neutral to Bullish Bias: Price remains inside the consolidation, but the preceding trend tilts odds toward an upside breakout. •Breakout Direction: The next impulsive move will come once price closes outside the triangle on the 1H timeframe. ⸻ 🧭 Trade Scenarios Bullish •Trigger: 1H candle close above 700 •Target: Measured-move expansion → $900+ Bearish •Trigger: Breakdown below 580 •Target: Measured move → 424.73 ⸻ ⚠️ Final Note Always wait for a confirmed candle close outside the structure to avoid fakeouts; expect strong volatility once the compression resolves. ⸻
Jitendra_Verma
تحلیل پامپ (PUMPUSDT): آیا کانال نزولی به پایان میرسد یا سقوط ادامه دارد؟
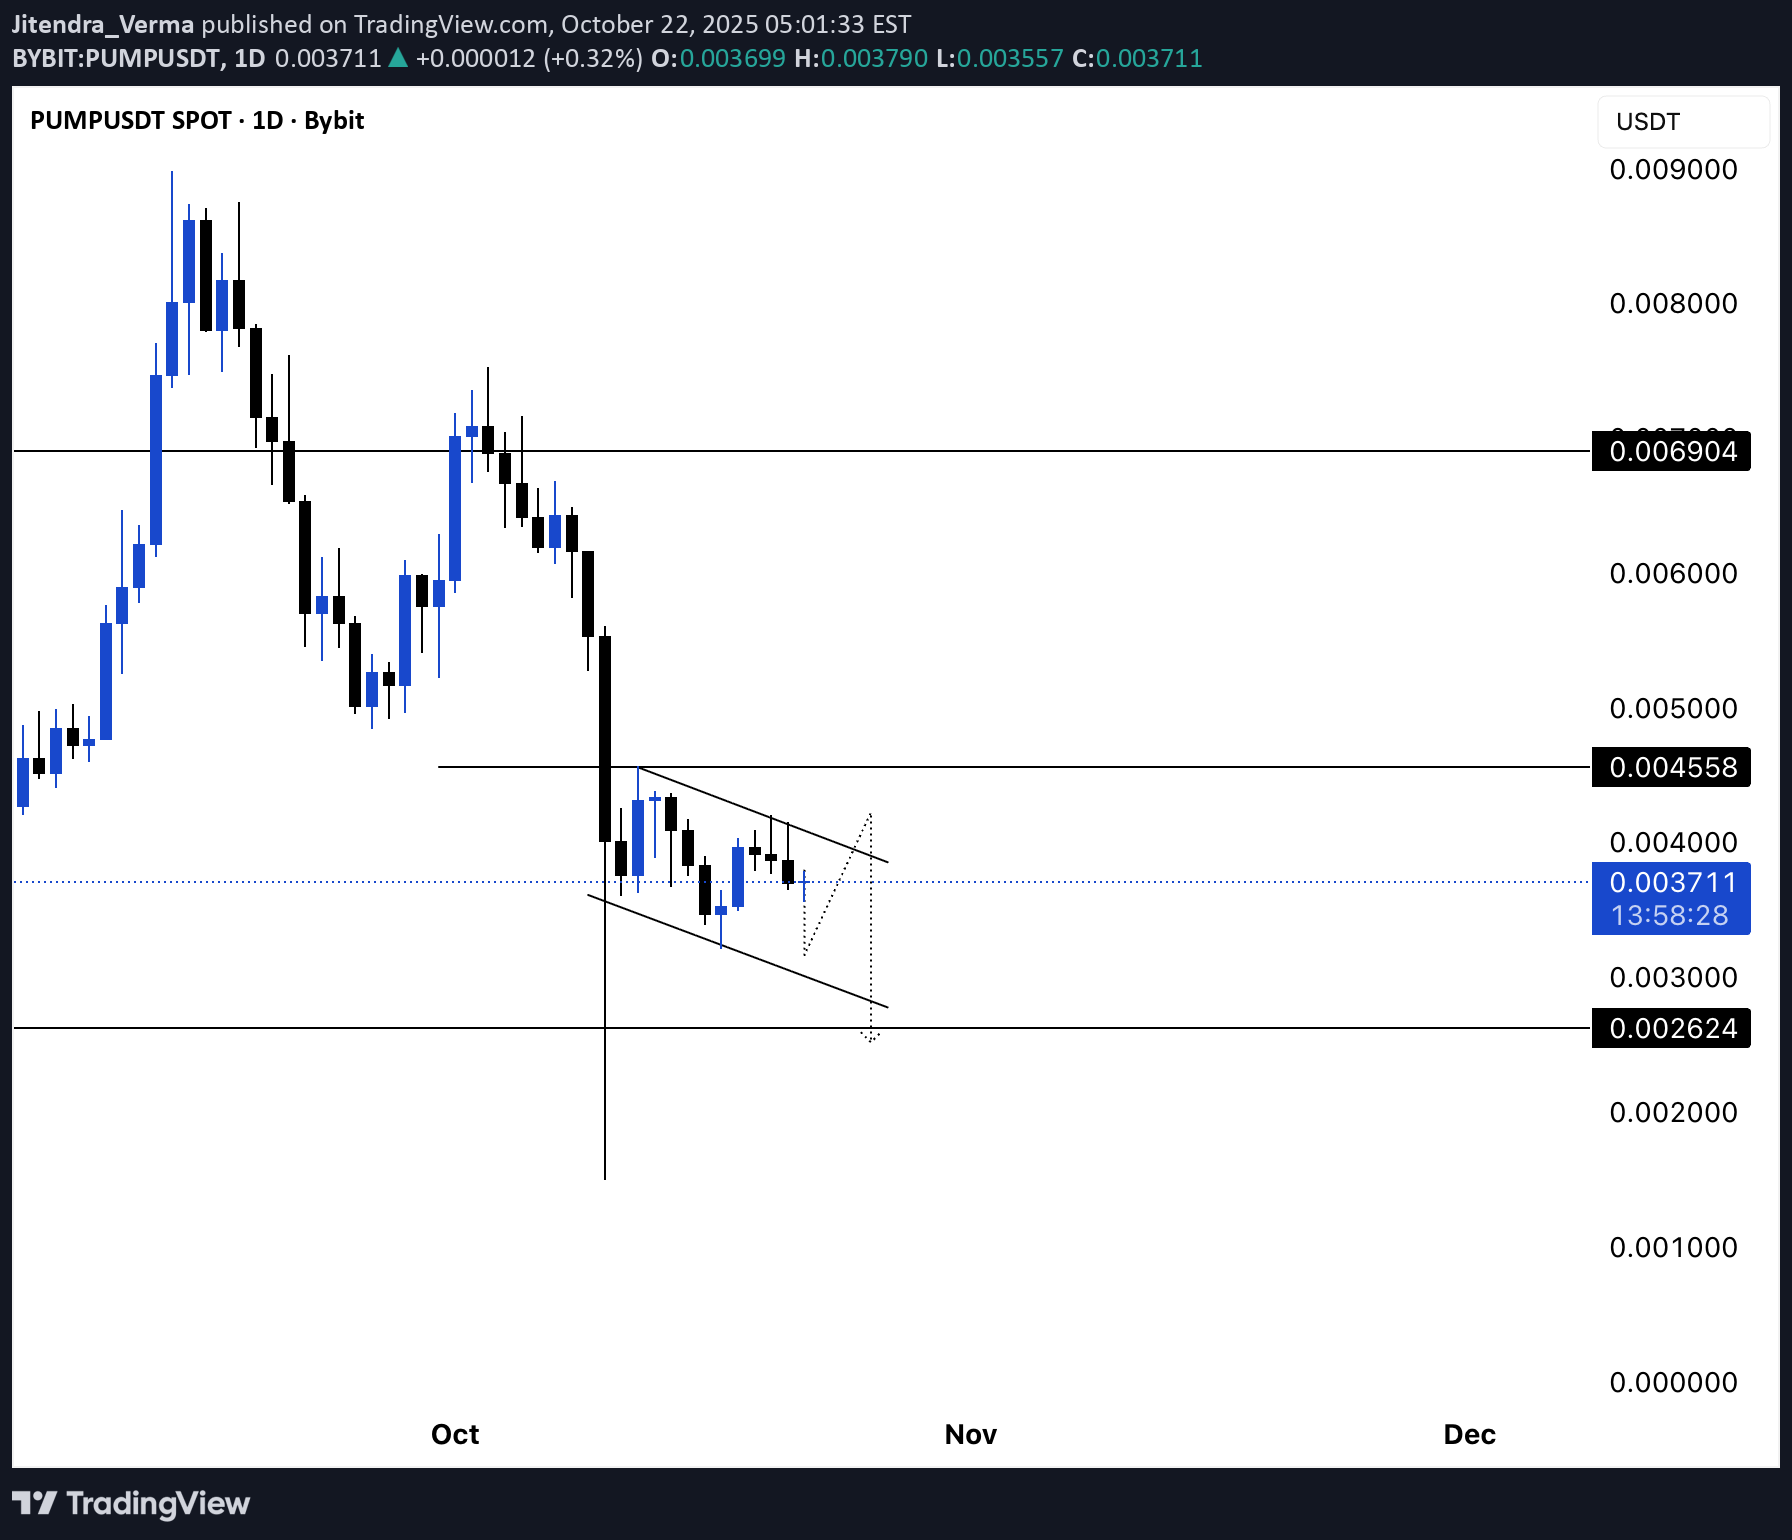
Overview Price continues to consolidate inside a descending channel after a sharp correction. Lower highs and lower lows define the short-term structure, keeping near-term pressure to the downside. Key Levels •Support: $0.002507 (horizontal) + lower channel trendline •Resistance: $0.006059 and $0.006904 (horizontal) + upper channel trendline Technical Context •The prior breakdown below $0.006059 confirmed short-term bearish momentum. •A clean daily close below $0.002507 would validate further continuation toward new lows. •Conversely, a breakout above the upper channel line could signal exhaustion of the current downtrend and open the path for a recovery toward the $0.006059–$0.006904 area. Market Bias •As long as price trades within the channel, tone remains bearish. •Watch for volatility as price compresses — breakout direction will likely define the next impulsive move. Summary The setup remains technically corrective. A close below $0.002507 = continuation. A break and hold above the upper channel = early reversal signal. 📌 For educational purposes only — not financial advice. #PUMPUSDT #Crypto #DescendingChannel #PriceAction #Support #Resistance #TechnicalAnalysis #TradingViewIdeas
Jitendra_Verma
XRPUSDT 1D falling wedge coiling for breakout
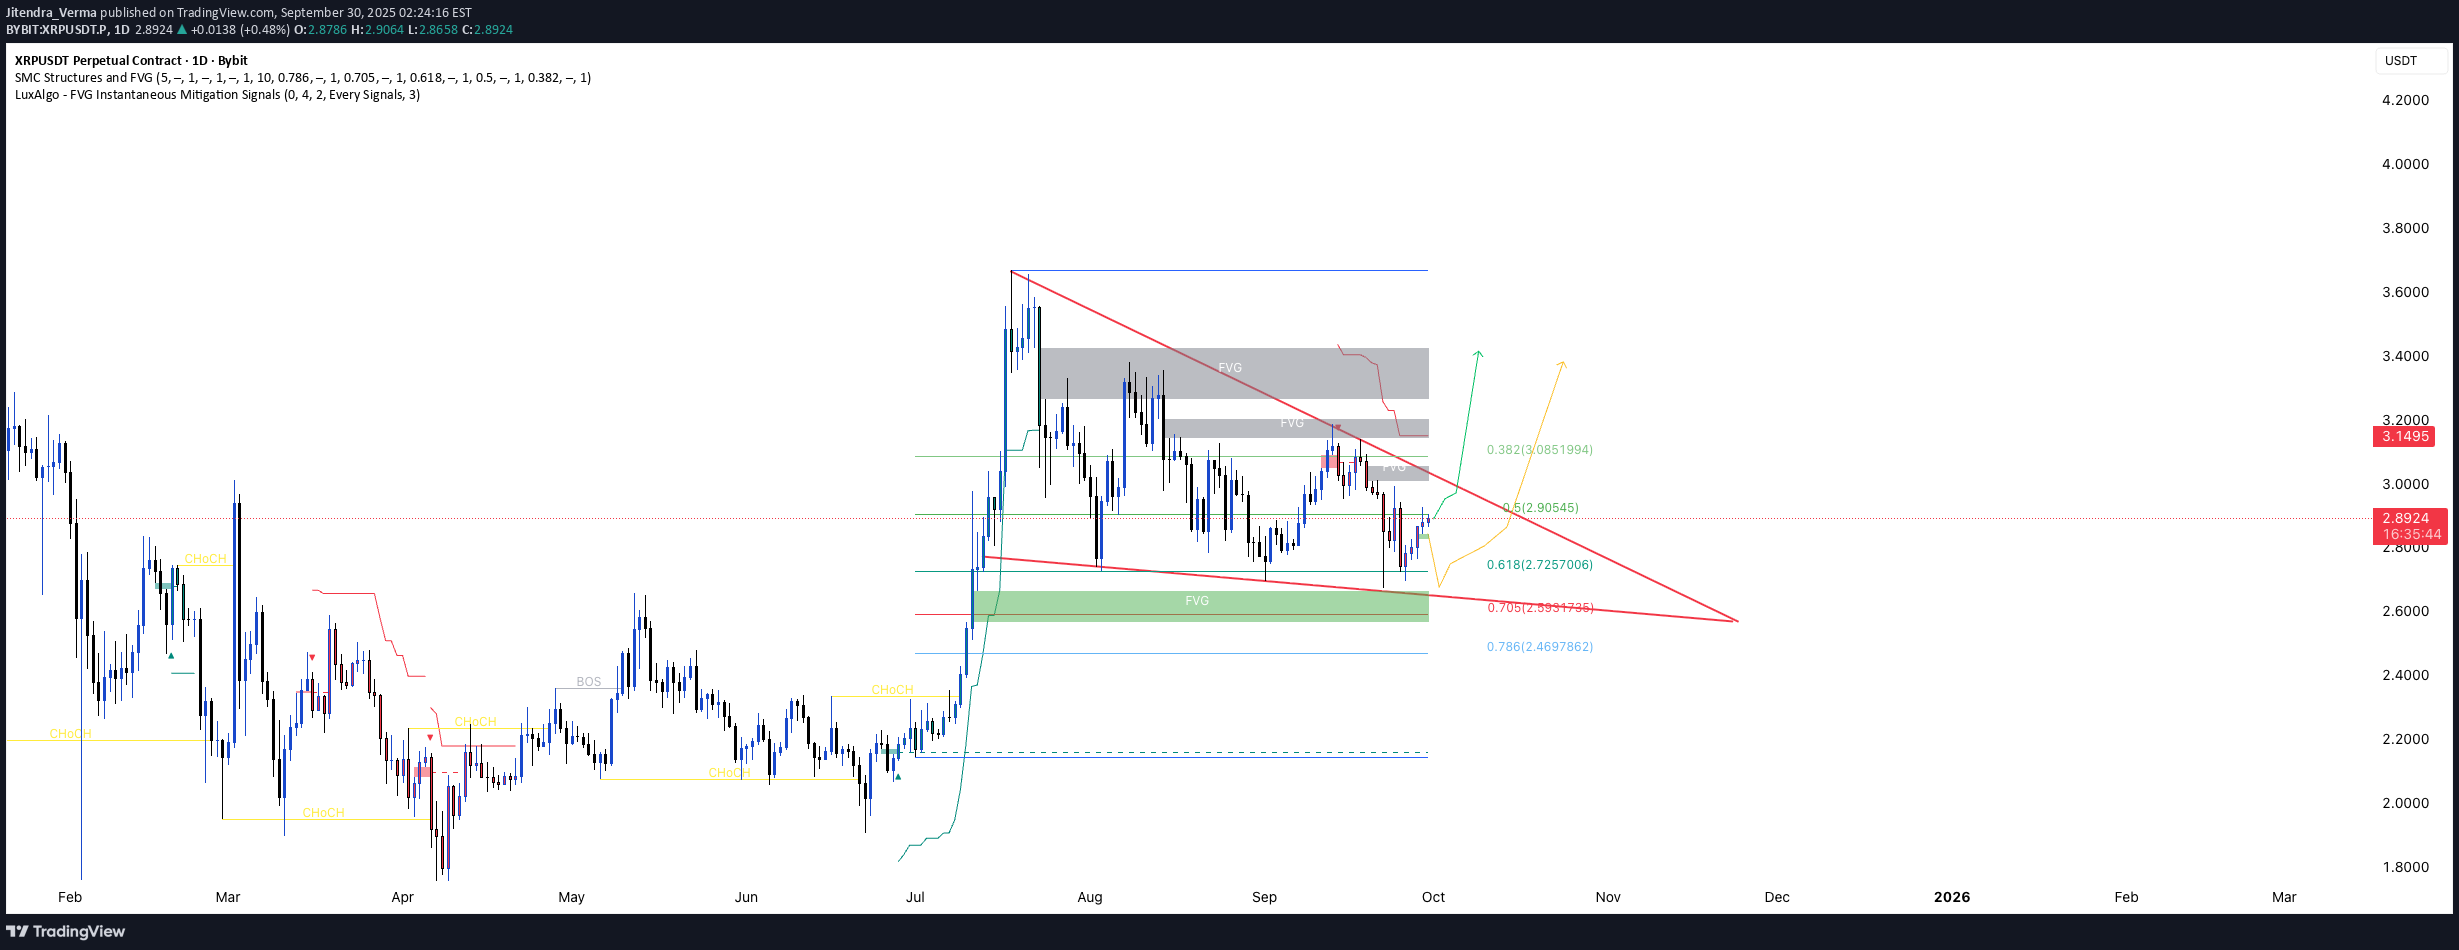
Price is compressing inside a falling wedge with demand below 2.72. A clean daily close above 2.98 opens 3.05 then 3.15. Trend is corrective after the July impulse, printing lower highs inside a falling wedge. Internal structure is bearish-to-neutral, but compression suggests energy building for a break. Price sits mid range near the 0.5 retracement, with external liquidity resting above 3.05 to 3.15 and equal lows below 2.55 to 2.47. A daily break and hold above the wedge top would mark a change of character back to bullish; a sweep into the lower green box keeps the larger uptrend corrective. Levels Wedge resistance: 2.98 FVG supply ceiling: 3.15 0.5 retracement: 2.905 0.618 retracement: 2.726 Liquidity below swing lows: 2.470 Plan A Trigger and confirmation Wait for a daily close above 2.98 and the wedge trendline. Look for a retest that holds as a bullish order block or a higher low on 4H. Invalidation level A daily close back inside the wedge or below 2.86. Targets: TP1, TP2, runner TP1 3.05, TP2 3.15, runner 3.35 toward prior range high. What would invalidate the idea Failure to hold the breakout retest and sustained acceptance back under 2.90. Plan B If price sweeps the downside first, watch 2.72 to 2.60. Trigger on a sweep and reclaim of 2.70 with a 4H change of character. Invalidation and targets Invalidation on a daily close below 2.47. Targets 2.90, 3.05, 3.15. Confluence EMAs 20 and 50 are flattening while the 200 remains upsloping, consistent with a corrective pause. RSI is holding near 50 with mild bullish divergence versus the September swing low. Volume has compressed during the wedge, so expansion after a break should confirm. Volume profile favors 2.90 as a local point of control, with value area low near 2.70 aligning with the 0.618. Fib context places current price near the 50 level, with discount bids in the 62 to 79 zone. Risk Define risk at invalidation, not by feel. Size positions so a full stop hit is tolerable. Wait for confirmation instead of chasing the first spike. Disclaimer Educational content only and not financial advice
Disclaimer
Any content and materials included in Sahmeto's website and official communication channels are a compilation of personal opinions and analyses and are not binding. They do not constitute any recommendation for buying, selling, entering or exiting the stock market and cryptocurrency market. Also, all news and analyses included in the website and channels are merely republished information from official and unofficial domestic and foreign sources, and it is obvious that users of the said content are responsible for following up and ensuring the authenticity and accuracy of the materials. Therefore, while disclaiming responsibility, it is declared that the responsibility for any decision-making, action, and potential profit and loss in the capital market and cryptocurrency market lies with the trader.