Technical analysis by Jitendra_Verma about Symbol ZEC on 18 hour ago

Jitendra_Verma
تشکیل مثلث متقارن ZEC: سطحهای کلیدی و سناریوهای معاملاتی انفجاری (صعودی/نزولی)
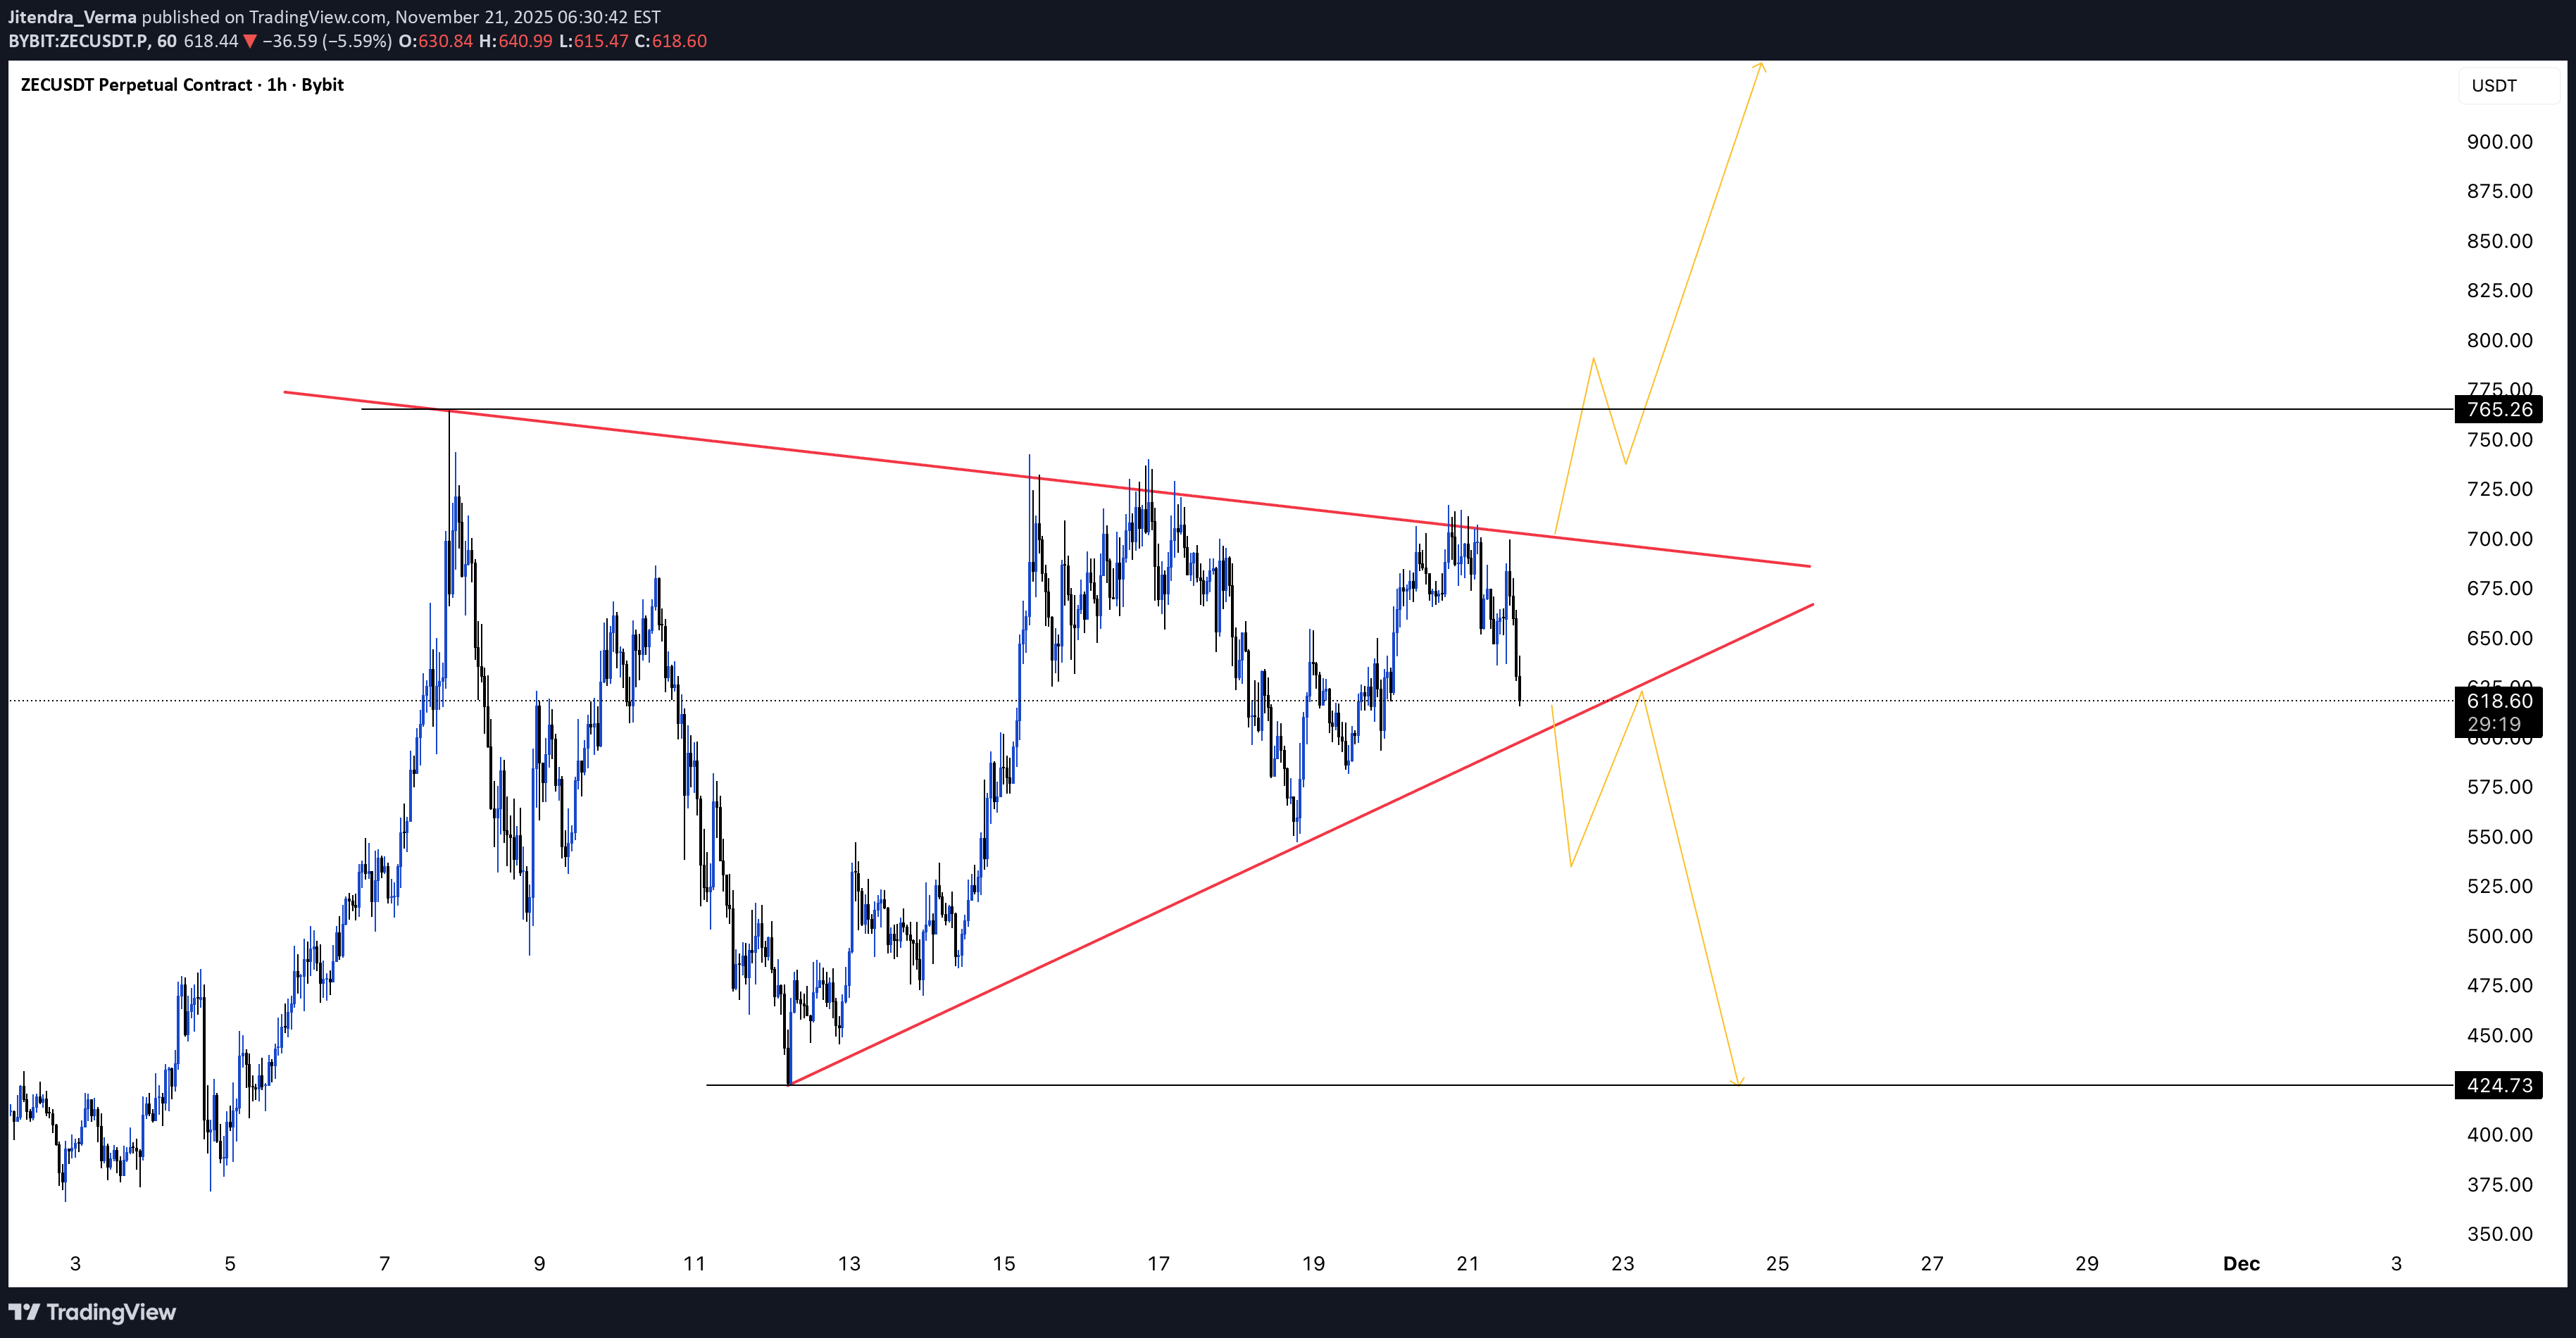
📌 Pattern Overview •The chart is forming a Symmetrical Triangle, highlighted by converging trendlines. •Volatility compression is visible as price prints lower highs + higher lows. •This structure typically appears during a mid-trend pause, often a continuation pattern. ⸻ 📉 Key Levels Support •600 — ascending trendline support •424 — projected downside target (measured move) Resistance • 700 — descending trendline resistance •76— key horizontal resistance ⸻ 📈 Market Outlook •Neutral to Bullish Bias: Price remains inside the consolidation, but the preceding trend tilts odds toward an upside breakout. •Breakout Direction: The next impulsive move will come once price closes outside the triangle on the 1H timeframe. ⸻ 🧭 Trade Scenarios Bullish •Trigger: 1H candle close above 700 •Target: Measured-move expansion → $900+ Bearish •Trigger: Breakdown below 580 •Target: Measured move → 424.73 ⸻ ⚠️ Final Note Always wait for a confirmed candle close outside the structure to avoid fakeouts; expect strong volatility once the compression resolves. ⸻