
JinDao_Tai
@t_JinDao_Tai

What symbols does the trader recommend buying?
Purchase History
پیام های تریدر
Filter
صعود تاریخی طلا: مقصد نهایی کجاست؟ (هدف قیمت ۴۵۰۰ دلار؟)

Gold broke out of a multi-year consolidation (2020–2024) when it cleared the previous all-time high of $2,080. Once that level broke, we entered price discovery mode . This is important: There's no overhead resistance from traders who bought at higher levels because there are no higher levels. That's bullish. But it also means we're in uncharted territory. The weekly chart shows a clean uptrend with no signs of reversal yet. But rallies this big and fast typically need consolidation phases. Here's where it gets specific. Gold showed a classic consolidation pattern: - Consolidation range: $2,565–$2,750 - Breakout point: Early 2025 - Measured move target: ~$3400 Using the Fibonacci extension, if the uptrend continues, it suggests the next major resistance is around $4,500 and $4,750. If you plot these on a chart, you see: - Gold broke out cleanly from consolidation - Every pullback has been bought We're in a controlled uptrend, not parabolic. This is the structure of a trend that could continue. But it's also the structure that could reverse if critical support breaks.
صعود تاریخی طلا تا مرز ۴۵۰۰ دلار: سه نیروی پنهان که بازار را تکان دادند!

Gold approaches $4,500 per ounce for the first time in history. Up more than 50% in less than a year. Everyone's asking the same question: Is this a historic breakout, or the setup for a massive crash? The answer requires looking at three things: what brought us here, where we are technically, and what could go wrong. PART 1: THE MACRO STORY Gold doesn't just rally because people are "scared." It rallies because of structural shifts in how the world's largest institutions view money, risk, and trust. Central Banks Are Buying Gold at Record Pace Here's a number that should get your attention: Central banks bought 1,045 tons of gold in 2024. That's the second-highest annual total on record. In 2025, the buying hasn't slowed down. Poland alone has accumulated 67 tons year-to-date. Turkey, India, Kazakhstan, and others are following suit. But here's what's really happening: This isn't about inflation hedging. If it were, Western central banks (US, Europe) would be buying too. They're not. Instead, emerging market central banks are diversifying away from the dollar. Why? Because they watched what happened in 2022 when the US froze Russian reserves. When you hold dollar-denominated assets, they can be weaponized. Gold can't be sanctioned. Gold can't be frozen. Central banks don't panic sell on a 5% dip. When they buy, they hold. This creates a structural price floor. Every pullback gets accumulated. What this means: Central bank buying is the foundation of this rally, not a temporary catalyst. The Federal Reserve is Cutting Interest Rates According to the CME FedWatch Tool, there is a level of certainty that the Fed would cut rates in October 2025, with markets pricing in another cut in December this year. When interest rates fall, something important happens to gold: its "opportunity cost" decreases. Here's the simple version: Gold pays no interest. So when bonds also pay almost nothing (after inflation), holding gold looks pretty reasonable. But when real yields are high, bonds look better and gold looks worse. Right now, the market is pricing in lower real yields ahead. That's bullish for gold. If the Fed doesn't cut as much as the market expects, that changes everything. What this means: Rate cuts fuel the rally. Geopolitical Instability & Currency Debasement Global tensions remain elevated: Middle East instability, US-China friction, and the ongoing Russia-Ukraine conflict. But that's not the real driver here. The real driver is the loss of faith in government money. Gold is at an all-time high, not just in US dollars. It's also hitting all-time highs in euros, yen, and yuan. This isn't a dollar story. This is a global reassessment of what "money" actually means. Meanwhile, the US national debt is over $35 trillion. Debt-to-GDP is at World War II levels. Other countries (Japan, Europe) are in similar situations, printing money and running massive deficits. When governments print excessively, investors need a hedge. Gold can't be printed. What this means: As long as deficits remain high and geopolitical chaos persists, gold has structural demand that goes beyond cycles. The Bottom Line Three powerful forces are all pushing in the same direction: Central banks structurally accumulating gold (de-dollarization) The Fed cutting rates (lower real yields = gold support) Global monetary instability (currency debasement = safe-haven bid) This combination hasn't existed in most traders' lifetimes. That's why this rally feels different. And why it's lasted this long.
BTCUSD Retrace to Rebound

Bitcoin is currently trading around $114,500 price level and continues to be held below the $116,000 level. Price remains in a short-term range between $112,000 and $116,000. But signs are emerging that a breakout may be brewing. Ichimoku Cloud BTC is trading into a bearish cloud, which further highlights the possibility of continuation within the range. RSI RSI is turning lower from the 60 level, away from the overbought region. This could indicate some downside to come (back into the range). The Anticipation Look for a possible break to the downside (below the support level of $112,000 and the 50% retracement level). Eventually, we could see BTC retest the 108,000 support level before a strong rebound, with possibly a new ATH created.
Bitcoin Passes Stress Test

On July 25, 2025, Galaxy Digital executed one of the largest Bitcoin sales ever recorded: 80,000 BTC, valued at approximately $9 billion , on behalf of a Satoshi-era investor. Despite the size, the market absorbed the flow with minimal volatility—Bitcoin dipped from around $119,000 to $115,000, then rebounded above $119,000. Liquidity Maturity in Motion Analysts called the trade a significant demonstration of market maturity, noting that 80,000 BTC was absorbed in days with barely a market blip. Crypto infrastructure has also evolved: algorithmic liquidity providers, institutional desks, and OTC channels handled the load without triggering cascading funding rate hikes or forced liquidations. Ongoing Risks Event-Driven Stress: During macro shocks or sharp sell-offs, liquidity may thin, and the same level of absorption might not persist. OTC vs Exchange: This large sale was managed mostly off-exchange. A similar-sized on-exchange dump could still trigger stop-run cascades. Retail Complacency Risk: The stability seen now can be deceptive, as retail may misinterpret low volatility as a safe leverage zone, only to be caught off-guard. Projections: Watching the 23.6% fib retracement level in line with the $116,600 price level. Anticipate the resistance level of $120,000 to be retested. If price breaks above $120,000, we could see a significant move toward $130,000 The $9B BTC sale went through without materially impacting price is considered a milestone in crypto market evolution. It reflects institutional-grade liquidity and sentiment maturity.
Tesla (TSLA) | Short-Term Compression, Long-Term Ex

Tesla’s daily chart is coiled, with price currently trading at $316, sitting along the 200-day moving average. This looks like a consolidation phase with significant moves building up. Price Action Snapshot TSLA sold off last week, rejecting the $335 resistance level before finding footing around $300. The previous range of $280 and $365 is now tightening. Immediate resistance sits at $335 with a clean breakout above that zone likely triggering momentum back toward the upper range of $365. The recent drop does not seem like a capitulation move; it's likely institutional redistribution. Smart money is repositioning, not exiting. Market Is Focused on the Wrong Data Tesla’s Q2 earnings were objectively weak. Revenue fell 12%, deliveries dropped, and operating margins got clipped. But this correction isn't all about fundamentals. It is about the market adjusting to a company evolving beyond traditional valuation models. While most investors are trying to value Tesla like a car company, it’s spending this entire phase retooling itself into an AI and autonomy-first enterprise. That transition doesn't show up in EPS yet (but it will). The Bigger Picture is Being Missed The robotaxi rollout in Austin is live. Expansion into California, Phoenix, and Florida is on the roadmap. Tesla is building a vertically integrated, owner-driven ride-hailing model that could eventually bypass both Uber and legacy OEMs entirely. Optimus is no longer a lab prototype—it’s moving toward scalable production by 2026. If Tesla even partially succeeds in general-purpose robotics, it will unlock a Technology Acceptance Model (TAM) that dwarfs the current EV narrative . Daily Technical Outlook We’re currently in a bullish compression, with higher lows forming against the resistance area of $365. If $280 holds and the price continues to grind within this wedge, it sets up a volatility breakout scenario. The breakout level to watch is $335. A daily close above that reopens $365. And beyond that, the resistance level is at $426. My View Tesla is compressing, both in price and narrative. The long game is quietly coming into focus, where the risk/reward skews asymmetrically in favor of the upside. This daily compression won’t last forever, and when it resolves, the move will likely be outsized.
S&P 500 Outlook. Best Quarter Since 2023… But What Next?

The S&P 500 just logged its best quarterly performance since Q4 2023 , surging on optimism around global trade negotiations and growing expectations that the Fed may begin cutting rates as early as September. US futures are green this morning, thanks to developments like Canada backing off digital taxes, ongoing dialogues with China ahead of the July 9 deadline, and risk-on sentiment is pushing yields and the dollar lower. But as traders, we need to ask: Are we witnessing a genuine economic inflection point? Or is this just a liquidity-driven rally that’s pricing in a best-case scenario? Technical View Support Zone: 6,150 was just broken through. And 6000, the round number level, coinciding with the 20-day EMA and previous swing level. Resistance Levels: 6,235 is the next critical ceiling, a clean breakout could see price reach the extension level of 6,415. Momentum Indicators: RSI remains elevated and is creeping toward the overbought. While momentum is strong, watch out for the possible development of a divergence. Possible Scenarios The 'Soft Landing’ Is Now the Base Case Markets are trading as if the Fed has successfully engineered a soft landing. But that’s now fully priced in, and historically, the most dangerous trades are the ones everyone agrees on. If trade talks stall, inflation re-accelerates, or earnings disappoint, the reversal could be brutal and fast. Risk-on Sentiment Without Volume Is a Yellow Flag Despite the price strength, volume has been tapering off. The S&P’s recent leg up occurred on lighter-than-average participation, suggesting institutions may be watching, not chasing. That’s often the case in low-volatility summers, but it also implies that any negative catalyst could cause outsized downside moves. Macro-Fundamentals May Not Justify Valuation Expansion Yes, inflation is slowing, and the Fed might cut. But if they do, it’s likely because growth is weakening, not because the economy is roaring. So the very condition that triggers rate cuts could also cap earnings growth! Projection Bullish Scenario: A confirmed breakout above 6,280 could carry us toward 6,400–6,500 by mid-Q3, especially if the trade deals progress, July inflation comes in soft, and the Fed signals accommodation. Bearish Risk: If price fails to hold above 6,120, especially if trade optimism fades, or inflation growth spikes or Fed rhetoric shifts hawkish again, this could then open a quick pullback toward 6,000 or lower, which also aligns with the 50-day SMA. Key Events to Watch July 9 Trade Talks Deadline: Any sign of stalling could bring volatility back fast. June CPI Print (July 10): Crucial for confirming the Fed's next move. Earnings Season Kickoff (mid-July): Tech-heavy expectations may not be easy to beat after such a strong run. Conclusion A record-setting quarter is impressive but not necessarily predictive. This quarter’s rally has been built more on relief and expectations than hard data. When expectations (not earnings) are doing the heavy lifting, any misstep from central banks or geopolitics could unravel gains rapidly. A rate cut might be delayed, or inflation re-accelerates, or trade talks stall; any of these could leave equities hanging. Remember: the higher the climb without real earnings growth, the harder the fall when sentiment shifts. It's not just about the chart. It is about the narrative behind the price. What’s your bias for Q3? Are you buying this breakout or fading the optimism? Drop your thoughts below.
Gold in a Shifting Macro Landscape
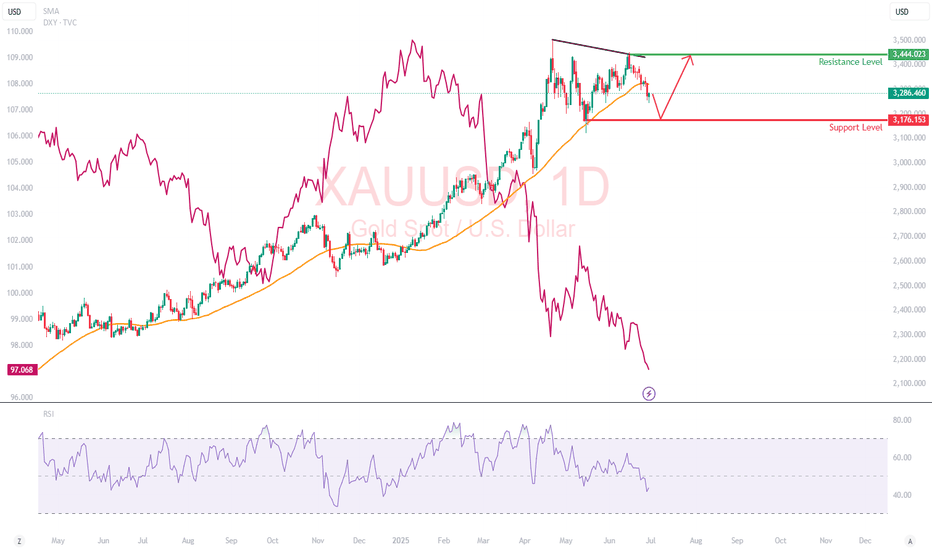
Fundamentals First: Why is Gold Falling While DXY is Too? Normally, gold and the U.S. dollar share an inverse relationship (which means, when DXY weakens, gold rises). But recently, this correlation has broken down, and that divergence is a loud macro signal. What’s Happening: Trade Deal Optimism: Headlines suggest the U.S. is nearing a resolution with China and other partners. With reduced geopolitical tension, investors are reallocating from safe-haven assets like gold into risk-on trades like equities and crypto. Iran-Israel Ceasefire: The temporary cooling of conflict has revived risk appetite. Traders are rotating out of war hedges (like gold and oil) and into tech, growth, and EM plays. Real Yields Still Elevated: Despite a softening Fed narrative, U.S. real yields remain positive, keeping pressure on non-yielding assets like gold. The fact that gold couldn't rally even as the 10-year note softened post-Moody's downgrade could be telling. My Perspective: This is the first clear signal in months that geopolitical hedging may have peaked. When gold decouples from its safe-haven narrative despite macro uncertainty, that often precedes a structural rotation phase, especially if institutional flows favor equities. Technical Breakdown Gold has broken below its 50-day SMA at $3,322 and is trading in the lower third of its 3-month range. While the daily candles show increasing selling pressure, especially on lower highs (a sign of weakening bullish momentum) RSI : Falling toward 40, with no bullish divergence yet. Support Level : $3,176: Previous swing low Resistance Level : $3,444: previous swing high What This Move Might Be Telling Us When gold sells off on dollar weakness and geopolitical calm, the market isn’t just relaxing. It is rotating. The de-grossing of gold-heavy hedges: Some hedge funds may be taking profit on gold-heavy exposure from Q1’s rally. Rise of risk appetite despite cracks: Markets are forward-pricing trade peace and earnings resilience, possibly too early. Gold might not be in trouble, but it’s on the bench. Unless something reignites fear (e.g., Fed policy mistake, Middle East flashpoint, or economic shock), capital may stay elsewhere.
Bitcoin Daily Technical Overview (BTC/USD)
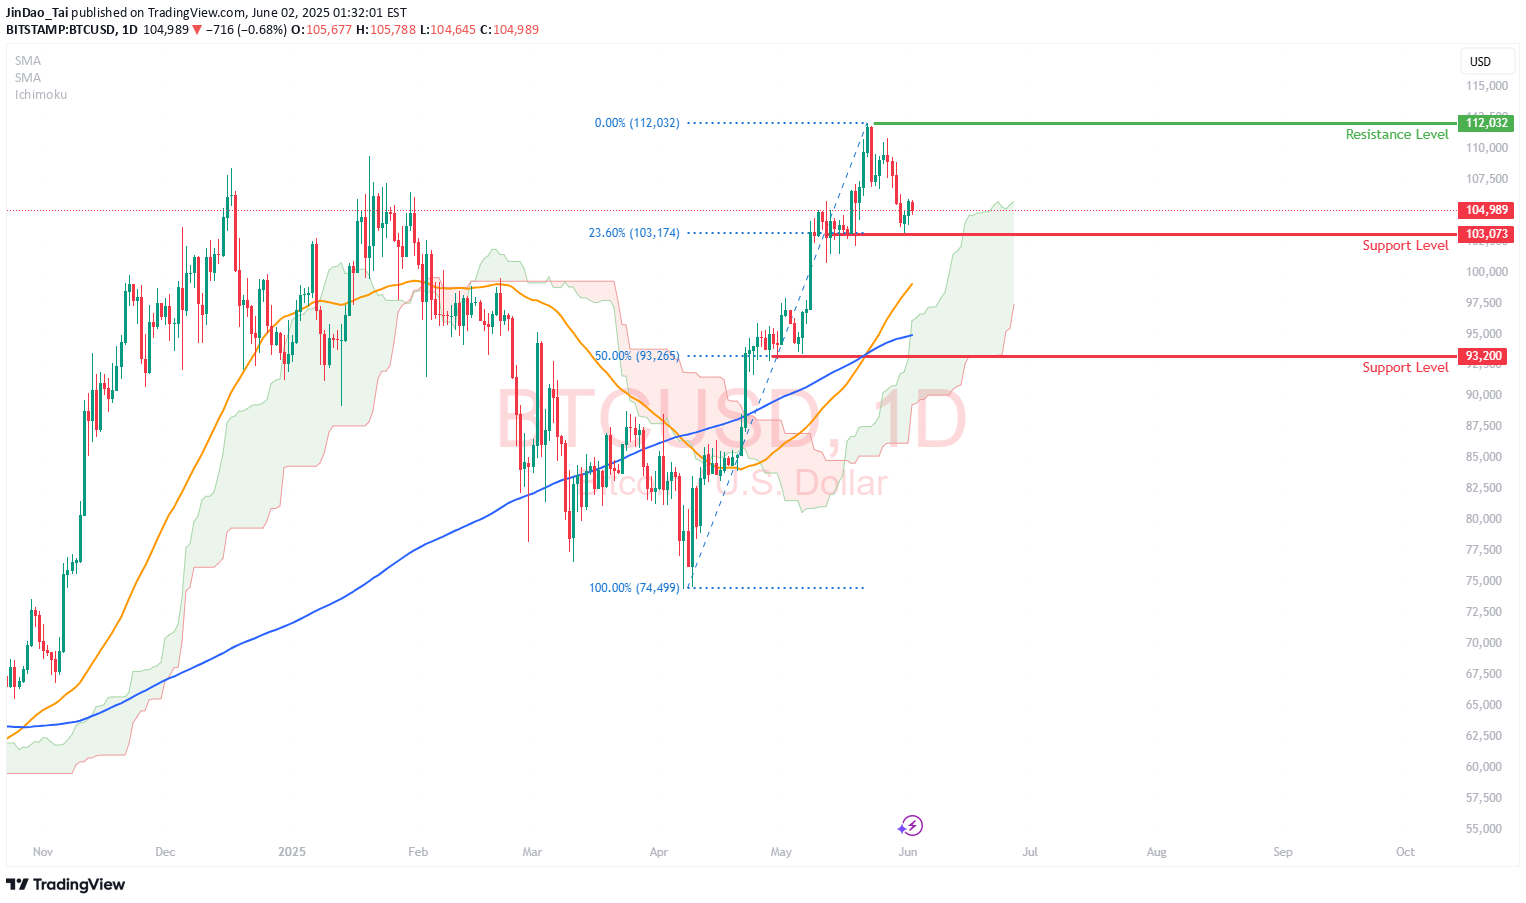
Currently, Bitcoin (BTC/USD) is trading around $104,800. Up slightly but still digesting a sharp reversal that rattled short-term bulls. Recent Price Action: Rejection From $112K Back on 22nd May, Bitcoin surged to a new high near $112,000, fueled by bullish momentum, institutional flows, and strong on-chain accumulation. However, that breakout was swiftly rejected, and BTC fell as low as $103,400. This kind of "bull trap" reversal highlights a few key dynamics: 1) Overextended sentiment: The rally above $110K was not supported by volume or follow-through, suggesting exhaustion. 2) Profit-taking by large holders or institutions likely triggered a cascade of stop-losses, accelerating the decline. 3) Liquidation clusters in leveraged long positions likely exacerbated the drop. Bitcoin is now attempting to reclaim stability around the $104K–$105K range. 🔍 Technical Snapshot - Support Zones at $103,000 and $93,200 - Resistance Levels at $112,000 (ATH) Price is still above the 50 & 200-day SMAs, which could be a bullish longer-term signal. In addition, the price remains above the upper band of the cloud, but momentum is stalling. A decisive bounce off the cloud could reignite bullish sentiment. Or falling into the cloud could trigger more uncertainty and downside. Macro tailwinds: Concerns over U.S. fiscal stability and potential Fed rate cuts could keep Bitcoin attractive as a non-sovereign asset. 📈 Projection Scenarios Bullish Case: If BTC consolidates above $107K, we could see another attempt and retest of $112K. Bearish Case: Failure to hold above $103K could see Bitcoin revisit $100K, and if that breaks, downside opens toward the $93K level. 🧭 Insight & Takeaway The current reversal serves as a healthy reminder that no trend goes up in a straight line. Especially not in crypto. It likely shook out overleveraged longs, reset sentiment, and may give the market room to breathe before the next leg up. The long-term trend remains intact, but expect more volatility before any clean break to new highs. Always DYOR and DYODD and manage your risk.
Magnificent Seven: Still Magnificent? Or Diverging for Good?

The Nasdaq 100 has bounced, but under the surface, the “Magnificent Seven” are no longer marching in sync. And this divergence matters, especially if you’re trading QQQ or using it as a momentum proxy. ⚔️ Leadership Rotation in Real Time - Nvidia (NVDA): Still a beast. Making fresh highs, clear institutional momentum. - Microsoft (MSFT): Quiet strength — not flashy, but technically clean. - Meta, Amazon: Holding up, consolidating after major runs. - Apple (AAPL) and Tesla (TSLA): Weak links. AAPL can't find a bid. TSLA is stuck below major resistance. Trading QQQ directly? Consider weighting your thesis by what’s working under the hood. - QQQ reclaimed the 200-day MA with the May 12's gap echoing the broader S&P move. - Look for a retest of the resistance and the previous high of 540 - Play breakouts with confirmation, or mean-reverting pullbacks. 🧠 Final Take The Magnificent Seven are splitting into two camps: those still driving the rally, and those dragging it.
Tariffs Shocked the World, But Look What Happened Next

Trump's “Liberation Day” reciprocal tariff announcement triggered a sharp selloff in the S&P 500 on the 2nd April. A classic policy shock! But the market has since clawed back every point. So what now? Let’s break it down by strategy. 🔎 Long-Term Investors: Stay the Course 1) This recovery reinforces one truth: When you own quality businesses, Volatility ≠ Risk. Policy creates opportunity, not exit signals. 2) Stick with great companies, buy on fear, and ignore the noise. The next 10 years won’t be won by panic. ⚡ Momentum Traders: Technical Reversal Delivered 1) S&P 500 bounced above its 30-day MA. With the May 12th’s bullish gap (post temporary tariff pause) confirming the trend shift. 2) This was a textbook momentum setup. But if you didn’t plan for the whipsaw, you missed the edge. 📈 What This Means Now Short-term volatility is likely to continue as tariffs, rates, and elections are all on the table. Watch for pullbacks into structure and keep risk tight as news-driven moves will be fast and brutal. Choose your timeframe. Respect the trend. Don’t confuse noise with signal. The edge now isn’t in prediction — it’s in preparation.
Disclaimer
Any content and materials included in Sahmeto's website and official communication channels are a compilation of personal opinions and analyses and are not binding. They do not constitute any recommendation for buying, selling, entering or exiting the stock market and cryptocurrency market. Also, all news and analyses included in the website and channels are merely republished information from official and unofficial domestic and foreign sources, and it is obvious that users of the said content are responsible for following up and ensuring the authenticity and accuracy of the materials. Therefore, while disclaiming responsibility, it is declared that the responsibility for any decision-making, action, and potential profit and loss in the capital market and cryptocurrency market lies with the trader.