
JerryManders
@t_JerryManders
What symbols does the trader recommend buying?
Purchase History
پیام های تریدر
Filter
Need Confirmation B-wave is complete
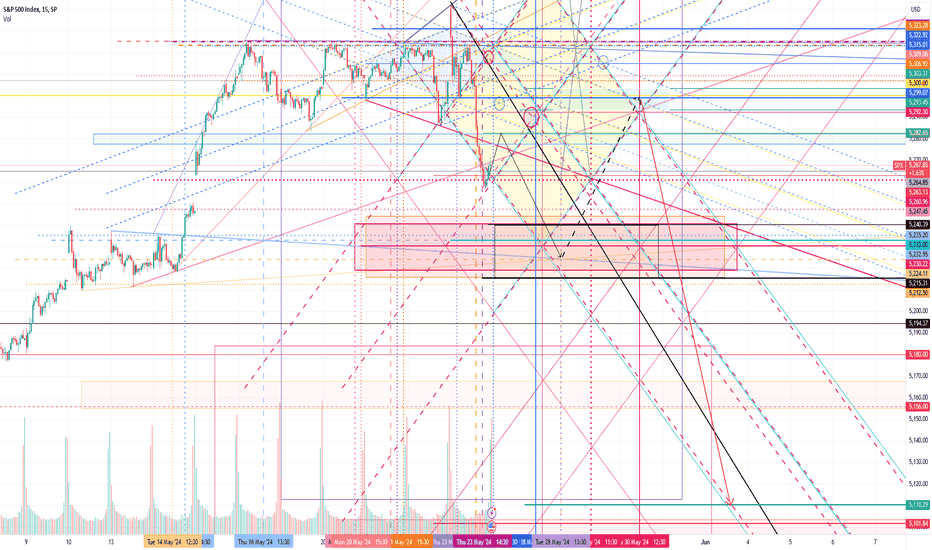
I posted an idea for SPX500USD and SPY a couple weeks ago saying I was legging into July puts because we are nearing a major top. That top is likely in, but here is the confirmation I am looking for to signal a larger degree B-wave has completed: - Expect small bounce to around 5283 - Then drop to 5215-5240 ** If this occurs, and is followed by a bounce to 5292-5293, it will set up for a iii wave down to 5110 by early to mid June 2024 to confirm a larger degree C wave is in progress with end goal 4600-4700 by end of July 2024.
Test of 427 at Least (final TGR pt. 5)
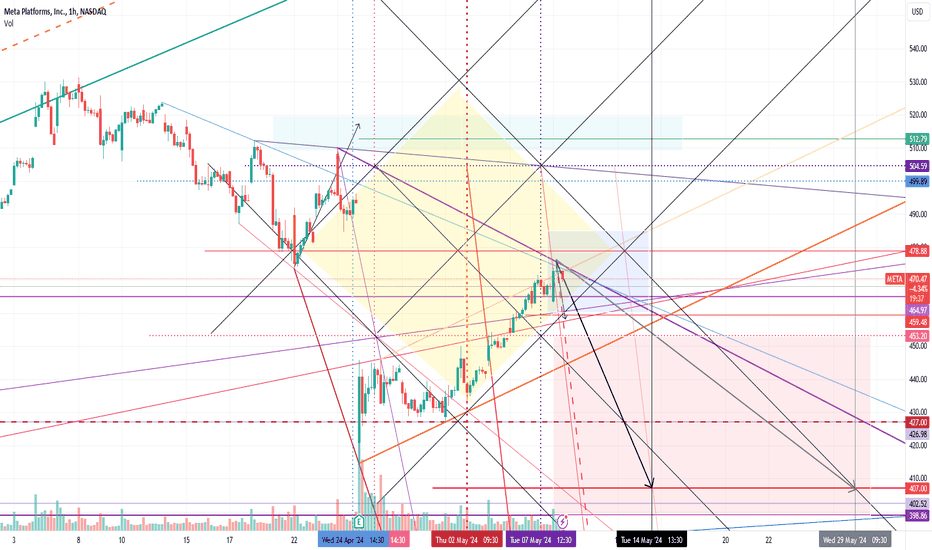
Loading July puts in the price range 460-485. I will continue to accumulate puts in this zone until either of the 2 scenarios below occurs: 1) If price drops below 460 at any point 2) If price is still in this zone on 5/14 (next Tuesday) If either of these occur my position will be complete. Main/primary forecast: - Reversal begins tomorrow 5/9, initial target is a break below 460 by 5/10 - Goal target = 427 by 5/17 Alt. forecast : - META takes until 5/15 to break below 460 -Goal target = 427 by 5/31/2024 Stop Loss = close above 485 Not Fin. advice -------------------------------------------------------------------------------------------------------------------- This is my last prediction for now in The Goat Returns series (a set of bearish ideas for the expected market drop over the coming weeks). The other ideas in the series are linked below.Gap won't get filled yet. MZ savin it for laterMaking final adds for puts before finalizing my position by the closing bell today. As I enphasized in the original post, this last week has been a loading period for accumulating July puts in preparation for this expected move down (it will be big). Good luck, its about that time bears.
Still room to run to 420 (at least)
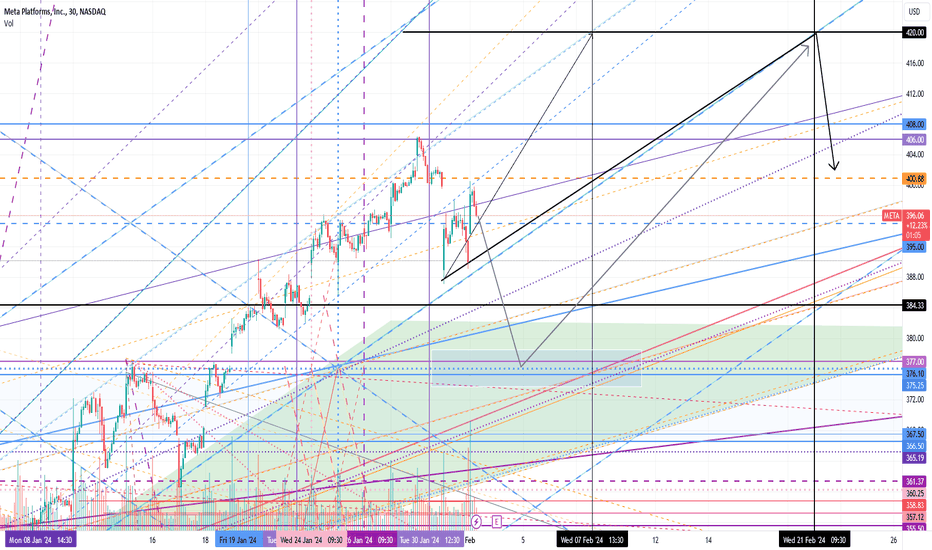
META target by end of Feb 2024 is 420. 3 most likely paths to target: 1) 1pt solid black arrow = earnings pop to 405-413 and then continue to 420 by 2/7/2024 2) 2pt (thick) solid black arrow = earnings pop and then run to 420 by 2/21 (more conservative) 3) 2pt (thick) grey arrow = drop to 373-378 after earnings which would get bought up fast and then run to 420 by end of Feb. (would be great opportunity to enter long). Not playing this for earnings but it should be a good indicator for what market will do mid-term. My expectation is SPY will continue higher to 500+, and the earnings today 2/1 will be a catalyst for this. I think at least 2 of 3 of the big tech earnings will be bullish todaym maybe all 3: META to 420 AMZN to 164 AAPL to 198Boom. 420 hit post-market. That's how its done.444 at 4:15 Letssss gooooooDon't short this lol. If you are in calls I would take some profits at open. Its very bullish here, but could consolidate in the 450-470 range before moving higher. Could also pullback to test 430-435 for support and then continue higher. We will need to see how it trades from here to determine if there is distribution or re-accumulation at these levels. In summary: sell calls for profits if you're in, hold shares if you're in, avoid entering puts, calls, or shares yet until we see some price action over the next week.If you load new bars you'll have to scroll up (a lot) to find the price, just fyiWelcome to the Metaverse Distribution center.. Still expecting UTAD (upthrust) well above 500 in the coming weeks - that will be the top.
Social Experiment

For those who prefer a simpler chart - same idea as previous post just cleaned up. There are 3 paths I see from here: Black path/arrow = initial bounce followed by lower low (36-38k) before continuing higher (most likely) Green path arrow = initial bounce followed by higher low before continuing higher Grey path/arrow = run directly to make higher high from here (least likely) - One common denominator in all 3 of these paths - we will get an initial bounce to 44400-48000 by Feb 14 2024. 44.4k-48k is my initial target. - At that point it will run into selling pressure (red funnel off recent peak) and start pullback. The extent of that pullback will determine the next move higher. ~ if it takes black path it will find buyers at 36-38k and then bounce to 48k-51k ~ If it takes green path it will retrace to around 41k-43k and then rally to 51k-55k ------------------------------------------------------------------------------------------------------------- Some comments on the summary above: - The bulk of this initial bounce to 44.4k-48k will take place early this week (1/29-1/31) - The pullback from initial target will take shape in late Feb 2024 - early March 2024 * Wait to go long after the pullback to catch bigger bounce/rally that will follow. i.e., run to 48k-55k by late March 2024 - early April 2024 ~If this initial bounce breaks above 48k then it will take the solid grey path directly to 51k-55k by end of Feb. 2024.Looks like this is following the grey path (most bullish near-term scenario).Guess what... Initial target of 44.4k hit, what'd you expect? This keeps going.Took the most bullish path exactly. Next up is 51k-54k.Made it to the 51k-54k target range. I'm seeing downside risk from here that could last until 2/28-3/1. Expecting this to pullback to at least 46k, could drop as low as 37k to test previous breakout level for support. After that it will reverse back to the upside.
abcdefghiJK...
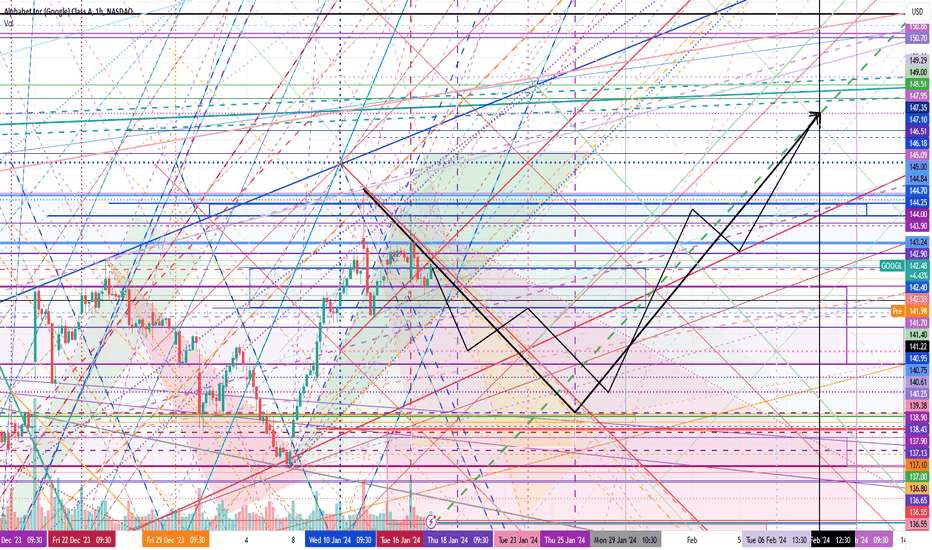
Before I begin I'm going to explain the meaning of each line on this chart... All you need to do to follow this and trade it for profit is focus on the solid plack path/arrow - that is the forecast for expected price action in the coming weeks (the thicker black path is general direction, the other black path is the expected subwaves). So when you load new bars in the coming weeks you'll see price trades along this forecast. In summary, expect a 4-6% drop going into earnings, followed by a 10-14% rally after earnings Pullback (pre-earnings 2/1): Don't enter long until around 1/26/'24 - 1/30/'24, wait to buy the upcoming dip. - Point Downside target = 133 by 1/26/2024 - range for pullback = 132-137 ~ This could still trade higher to around 146-147 before pullback, but it will get discounted (lower than current price) before earnings Post-Earnings Rally: I'll be buying after this pullback going into the earnings report, good chance it will be trading around 144 after the report . - Point INITIAL upside target (after pullback) = 148 by 2/12/2024 - Initial upside target range = 148-152 (in the time period 2/8 - 2/20) *** After this hits initial target it will consolidate in the 146-152 range before making one final leg higher to low 160s by mid-March 2024 (could run as high as 172) ---------------------------------------------------------------------------------------------------------------- How to Play this (not financial advice): - Don't buy/add shares (if you do go light), after this reaches 160-170 it will be the top, after that it will begin a major correction. If you're in shares look to sell in 160-170 range. - Don't waste your energy playing puts to catch this pullback, instead wait for opportunity to enter calls - I'll post an update when it is time to enter long ** I'll be looking at March expiration and choose strike based on extent of pullback. P.S. Check the History
Sailing on a Rocket Ship (700s conservative)
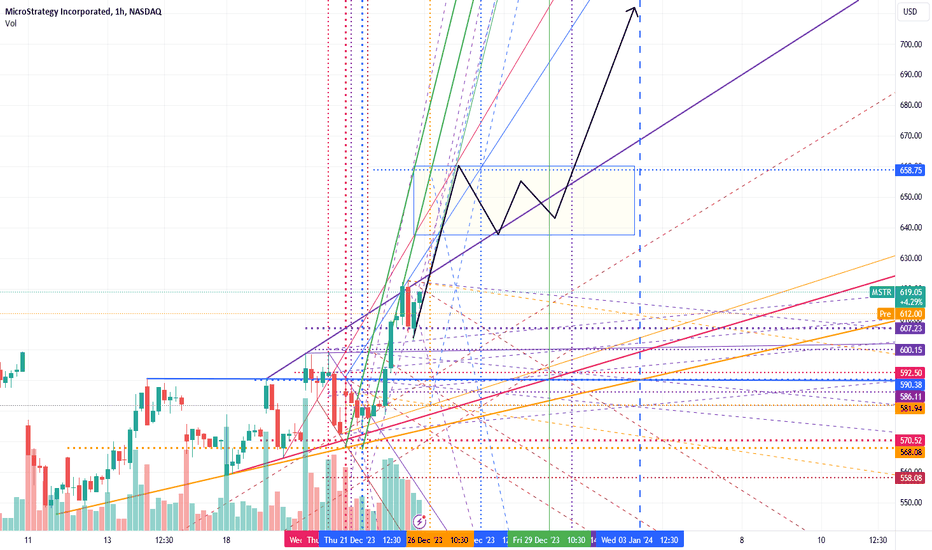
MSTR has the setup to make a move similar to Jan/Feb of 2021. Needs to clear 658 for this to activate. - initial target 658 by 1/3/2024 - If it breaks this next target is 781 (gap fill) by end of Jan. 2024 - If both of the above hit it will get insane from there, 1300+About to test the 658 today. Wow.Lets GoooooooooooooooooooooLoading up on Jan 19 680 calls (12:46pm 1/5 underlying 640). This is about to begin run to 780 by end of Jan 2024. Needs to clear the following resistance: 644, 649, 658 Breakout level is 660, gap to fill at 680... what could go wrong lolOnce this re-breaks 658 we're off toward 1000+ Targets: 700 by 2/16 1000 1315All 3 targets taken out like butter. This thing is insane #MikeySaylerAfter looking at this a little closer today, my next upside target is 1929. It could still pullback to 1567 before taking off again, but if it breaks back above 1710 its ready to rip to 1929.We hit 1909 - still trying to take out the 1929 target. If you're not starting to take profits here you're a pig.
BTC Bigger Picture (supplement)

BTC Bigger Picture (supplement) I posted a near term BTC idea recently before it broke out - It has hit exactly so far (linked). Here is a mid-term projection that will come into play as BTC reaches upper target of previous projection: Breakout Level was 19783 - Initial Target by mid Feb 2023 = 25k-28k (previous idea aligns with bottom range of this target zone) - Then pullback to test support at 19.7k-21.5k by mid March 2023 - If these hit, Target by end of May 2023 = 28k-33k (point target 30k) Bullocks and Yarbles to near-term bears. ~Likely intraday big move to 24k coming tomorrow 1/23/23Comment: *Near term bearish* That was likely the extent of the move up, not expecting it to make it to 25-28k yet. Expect selling beginning this week that could last til mid Feb. It will get hit to 19k-20k to test support.Comment: Upper target hit. What a scam :)
Potential for Reversal - Needs Confirmation
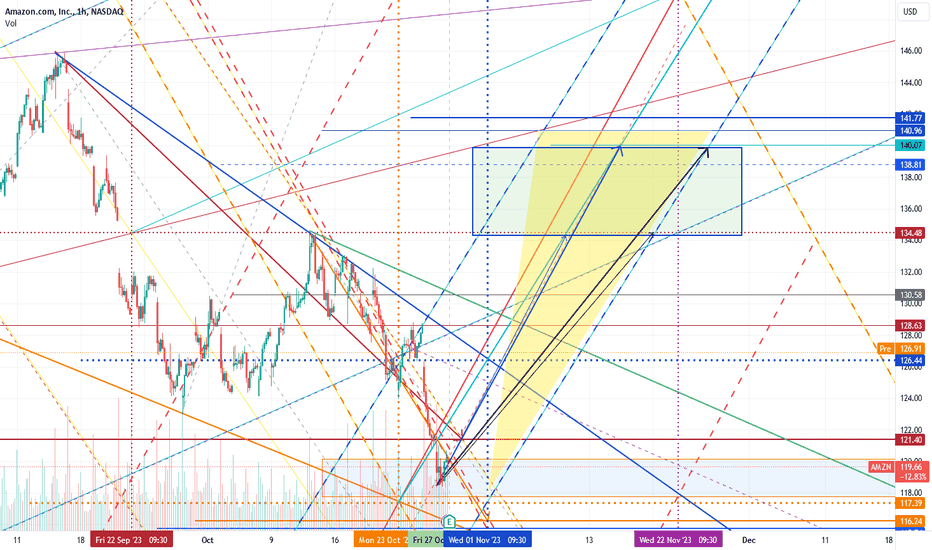
A week ago I posted a Bearish Idea for AMZN - the initial target hit. I sentan update going into earnings for shorts to be cautious, here is the updated chart: - Above 126 is near term bullish. Needs confirmation with a break above 129 by 11/3 (needs to break above solid green line in chart) - If we get confirmation, initial upside target is 134 by 11/10/2023 - If initial target is reached then the goal target will be 140 by 11/27/2023 ** If we see rejection in the 126-129 range, and get confirmation with break below dashed blue channel, then the bearish path to 114-116 (from previous post) will resume.Looking to swing short again once I get confirmation this bounce is overHit the blue arrow almost exactly. Targets all hit but still has a little room to run until around 11/22, then expect pullback to about 126This will keep going higher after completing a re-accumulation phase in the target range. Next upside target = 158. Its bullish as long as it stays above 150-152. End of move could go as high as 166-170 before we see a significant pullback.
How Far Can META Drop?
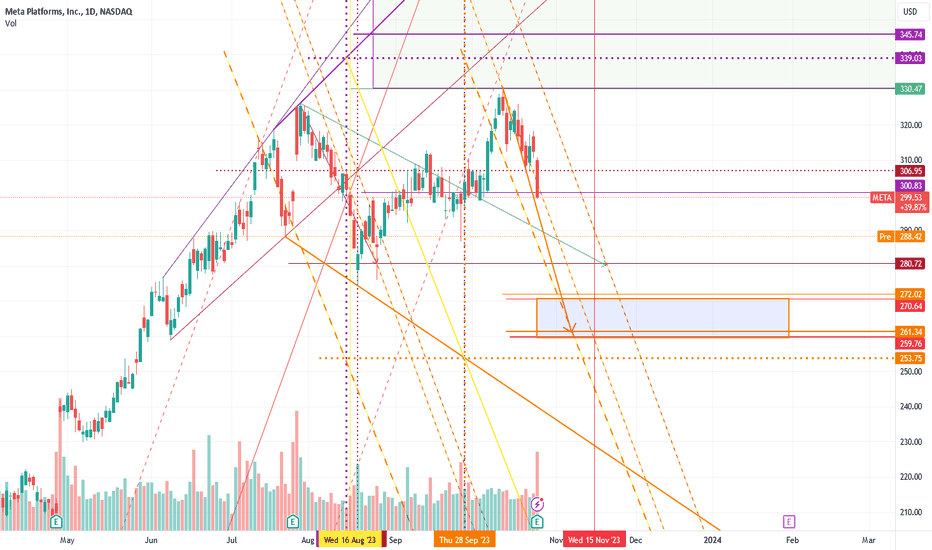
Target range is 260-270 by 11/15/2023 - can go as low as 253 - expecting some accumulation in the 260-270 range before a bounce to 280 by end of November - I'll send an update from there Orange trajectory is the expected path to point target of 260Still bearish as long as 306-311 holds as resistance. Likely will trade in 301-304 range going into FOMC on 11/1 and then drop. - META will be trading at 280 on 11/6/2023 - 260-270 still attainable as goal target by 11/15 - Most bearish case 230s by end of October ** If we see sustained break above 306-311 then I'll get bullish to 334-339.adding puts today, Nov 24 290s.. not financial advice
2 scenarios for earnings
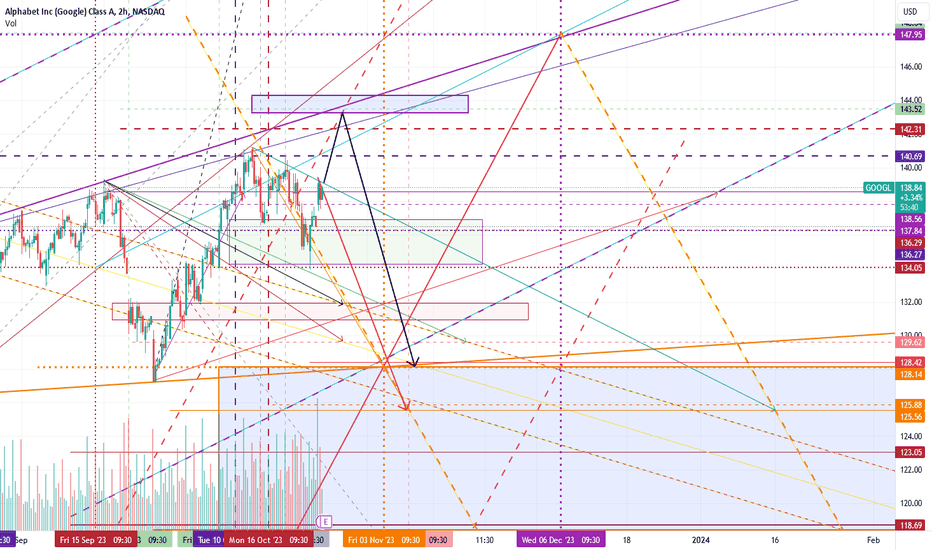
Case 1: We are in wave B of an expanded flat, post earnings pop to 143-144 and then drop to 128 by 11/6 Case 2: Drop from current level (138) to 125-128 before 11/3 expiration ** The play ** - 2:1 puts to calls Nov 3 135 puts for 2.60 and Nov 3 142 calls for 2.80 - If case 1 plays out, sell the calls to break even and enter Nov 9 138 puts Not financial adviceCase 1 is the black path and case 2 is red pathTaking profits here on the Nov 3 135 puts for 12.60. Recap on trade: - Bought 2:1 puts:calls for a total of 2.60 + 2.60 + 2.80 = 8.00 - Sold for a total of 12.60 + 12.60 + 0.00 = 25.20 ** $1,720 profit at 1 unit, 215% return ** You're welcome. Not financial advice lmaoStay tuned for more. ~AliMore downside comingLoad new bars - if we break above dashed orange and yellow line directly above I'm bullish
Disclaimer
Any content and materials included in Sahmeto's website and official communication channels are a compilation of personal opinions and analyses and are not binding. They do not constitute any recommendation for buying, selling, entering or exiting the stock market and cryptocurrency market. Also, all news and analyses included in the website and channels are merely republished information from official and unofficial domestic and foreign sources, and it is obvious that users of the said content are responsible for following up and ensuring the authenticity and accuracy of the materials. Therefore, while disclaiming responsibility, it is declared that the responsibility for any decision-making, action, and potential profit and loss in the capital market and cryptocurrency market lies with the trader.