
JR-HUB
@t_JR-HUB

What symbols does the trader recommend buying?
Purchase History
پیام های تریدر
Filter
JR-HUB
بیت کوین: اصلاح موقت یا شروع سقوط بزرگ؟ تحلیل قیمت و سطوح حیاتی پیش رو
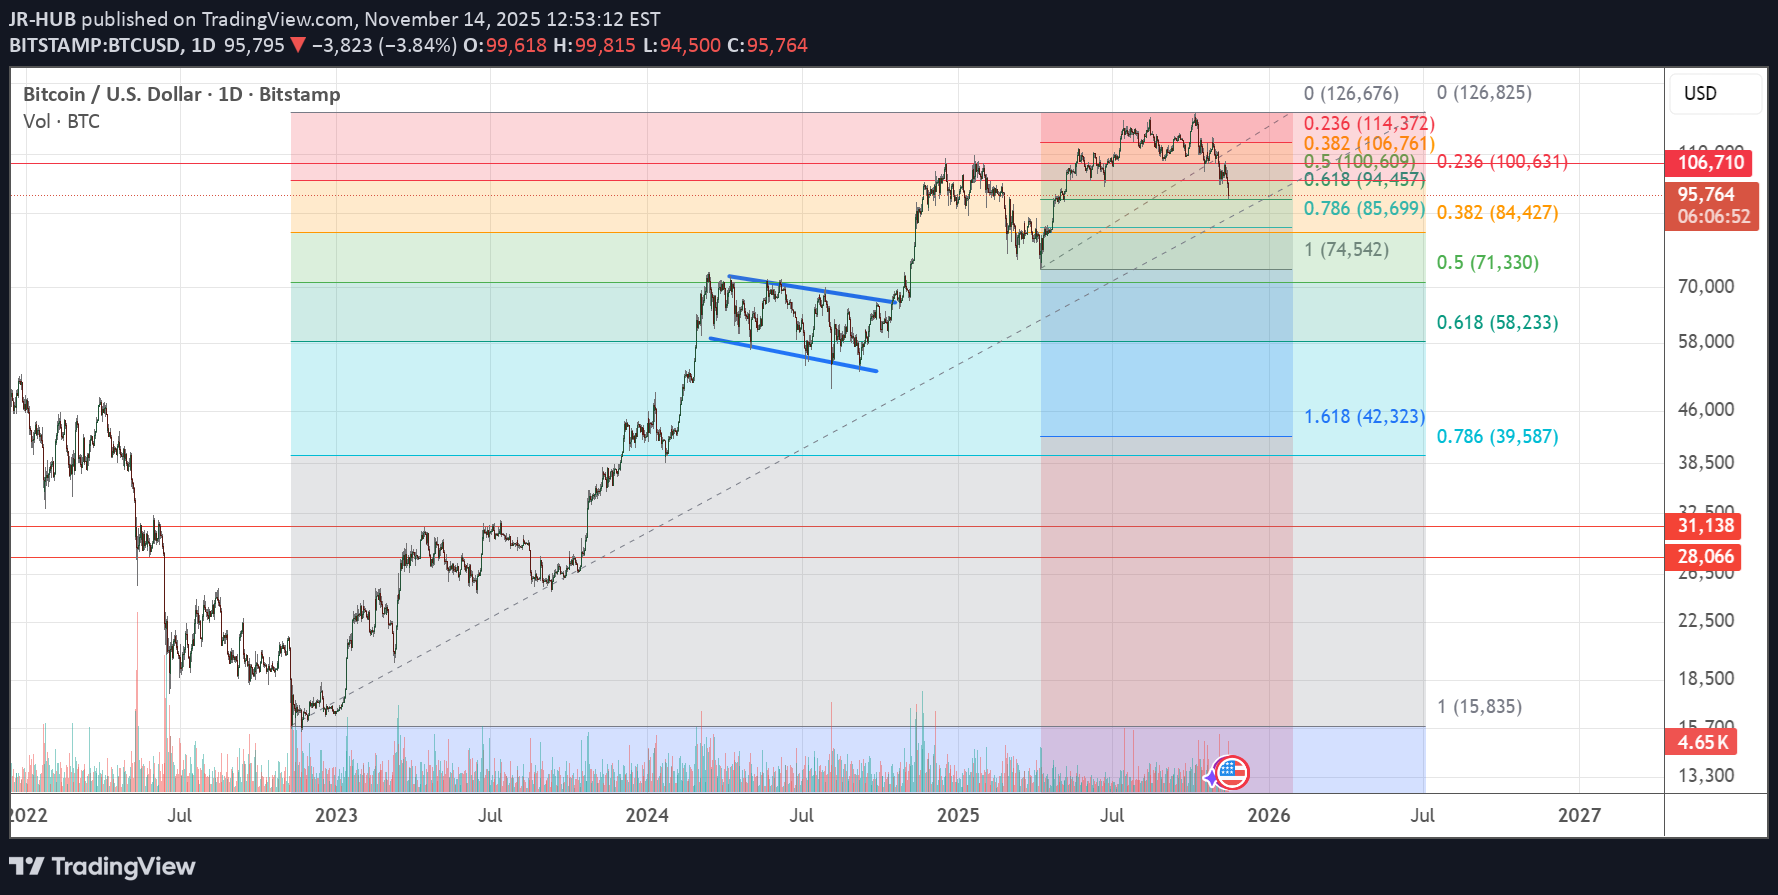
Bitcoin: Correction Wave or Beginning of a Downtrend? Overview of Recent Bitcoin Trends At the end of the second week of March 2023, a clear confirmation of an uptrend emerged in the Bitcoin chart. Since then, Bitcoin has experienced a series of corrections, each time reaching historical price levels. This consistent pattern has led to ongoing speculation about when a genuine downtrend might begin. Current Market Outlook Presently, from a long-term perspective, Bitcoin appears to be undergoing another correction wave. This wave closely resembles the previous correction that concluded in the second week of April 2025, though the current correction is notably more aggressive. Short-Term vs. Long-Term Strategies For short-term traders, there are indications that the recent uptrend may be reversing. A clear signal for a potential short-term downtrend has emerged after Bitcoin broke below the price point of $106,710.00. Traders are closely monitoring whether prices will continue to decline, which could result in significant losses for many who are already experiencing substantial daily losses. Alternatively, there remains the possibility that this correction is temporary, and a new uptrend could push prices to new highs in the coming months. Critical Price Levels to Watch •Long-Term Traders: A decisive break below $75,000 is a critical level in the current correction wave. •Short-Term Traders: The ongoing downtrend is expected to end if prices climb to $106,500 or higher. However, it is important to consider the risk-to-return ratio before taking any position. Assessing the potential risk and potential reward is crucial in making informed trading decisions. It's worth noting that the analysis provided is based on the information given and assumes the accuracy of the mentioned technical indicators. However, market conditions can change rapidly, and it's always important to conduct comprehensive and up-to-date analysis before making any investment decisions.
JR-HUB
Ethereum to $2030

Based on the analysis provided, it suggests that there is an uptrend in the price of Ethereum starting from October 22, 2023, after breaking the price level of $1745. Several technical indicators are mentioned to support this interpretation: 1-Price Breakout: The price breaking above $1745 is seen as a bullish signal, indicating a potential change in trend. 2-Divergence: The divergence between price action and the Relative Strength Index (RSI) suggests a possible shift in momentum, supporting the notion of an uptrend. 3-ADX Break: The break of the Average Directional Index (ADX) line above the DI- line is another signal indicating an increase in bullish momentum. 4-Following Bitcoin: The observation that Ethereum is following the trend of Bitcoin is mentioned, suggesting a general trend in the cryptocurrency market. Based on this analysis, the target levels for the uptrend are mentioned as $2030, followed by $2135. However, it is important to consider the risk-to-return ratio before taking any position. Assessing the potential risk and potential reward is crucial in making informed trading decisions. It's worth noting that the analysis provided is based on the information given and assumes the accuracy of the mentioned technical indicators. However, market conditions can change rapidly, and it's always important to conduct comprehensive and up-to-date analysis before making any investment decisions.
JR-HUB
Why XAUUSD is near to $1970 ?

In the short term, gold prices have been observed to fluctuate within a range of $1970 to $2000 per ounce. This range aligns with the levels of the 61% and 78% Fibonacci retracement, respectively, relative to the previous downtrend wave. The fact that gold prices are currently trading within this range indicates uncertainty regarding the market's direction. Traders and investors are awaiting a clear confirmation or signal that would indicate a definitive direction for the gold market. Until such confirmation is received, it is challenging to determine whether the market is establishing a clear trend. The price movement within the Fibonacci retracement levels suggests a period of consolidation or indecision, where market participants are assessing the next potential move. During such phases of uncertainty, traders often look for additional technical indicators, chart patterns, or fundamental catalysts to provide more clarity on the market's direction. It is essential to exercise caution and wait for a clear confirmation before making significant trading decisions, as a breakout from the current range could signal the start of a new trend. The decline in the price of gold can be attributed to the current optimistic market sentiment, which has caused investors to shift their capital towards other assets that carry more risk. One of the factors contributing to the reduced demand for gold is the resurgence in US Treasury yields. The 10-year US Treasury yield has rebounded from a six-week low observed on Friday and currently stands at 4.645%. The increase in US bond yields has strengthened the US Dollar (USD), as The DXY is currently trading near 105.40. This overall market environment, characterized by positive sentiment and rising bond yields, has put downward pressure on the price of gold. Investors are likely reallocating their investments towards assets that offer potentially higher returns in line with the current market conditions. Furthermore, the World Gold Council (WGC) recently released a report indicating that central banks worldwide acquired a combined 337 metric tons of gold in the third quarter. Year-to-date, these banks have added an impressive 800 tons to their reserves. Notably, emerging markets have been the primary buyers, showcasing a continued trend of diversification away from the US dollar. Overall, the improved investor sentiment, speculation about the Fed's monetary policy, and continued gold purchases by central banks, particularly in emerging markets, have contributed to the recent uptick in bullion prices. However, the situation in the Middle East has had a slight impact on gold outflows.
JR-HUB
Bitcoin temporary weakness in volatility.

After that great move in a short period of time, the Bitcoin price is facing a historical resistance area between the prices of $28100 and $31100. We know that is a big range, as Bitcoin is one of the more risky pairs to trade in, but at the same time, it is achieving a high return. Anyway, we will hold our old purchase order, waiting to see if it will break out of the discussed area or not. other wise, we could change our position immediately in the event that the price fell below $26,900. In that case, we will close our buy position and start to change our point of view in the near term.
Disclaimer
Any content and materials included in Sahmeto's website and official communication channels are a compilation of personal opinions and analyses and are not binding. They do not constitute any recommendation for buying, selling, entering or exiting the stock market and cryptocurrency market. Also, all news and analyses included in the website and channels are merely republished information from official and unofficial domestic and foreign sources, and it is obvious that users of the said content are responsible for following up and ensuring the authenticity and accuracy of the materials. Therefore, while disclaiming responsibility, it is declared that the responsibility for any decision-making, action, and potential profit and loss in the capital market and cryptocurrency market lies with the trader.