
Ivan_Olyanskiy
@t_Ivan_Olyanskiy
What symbols does the trader recommend buying?
Purchase History
پیام های تریدر
Filter
Signal Type

Ivan_Olyanskiy
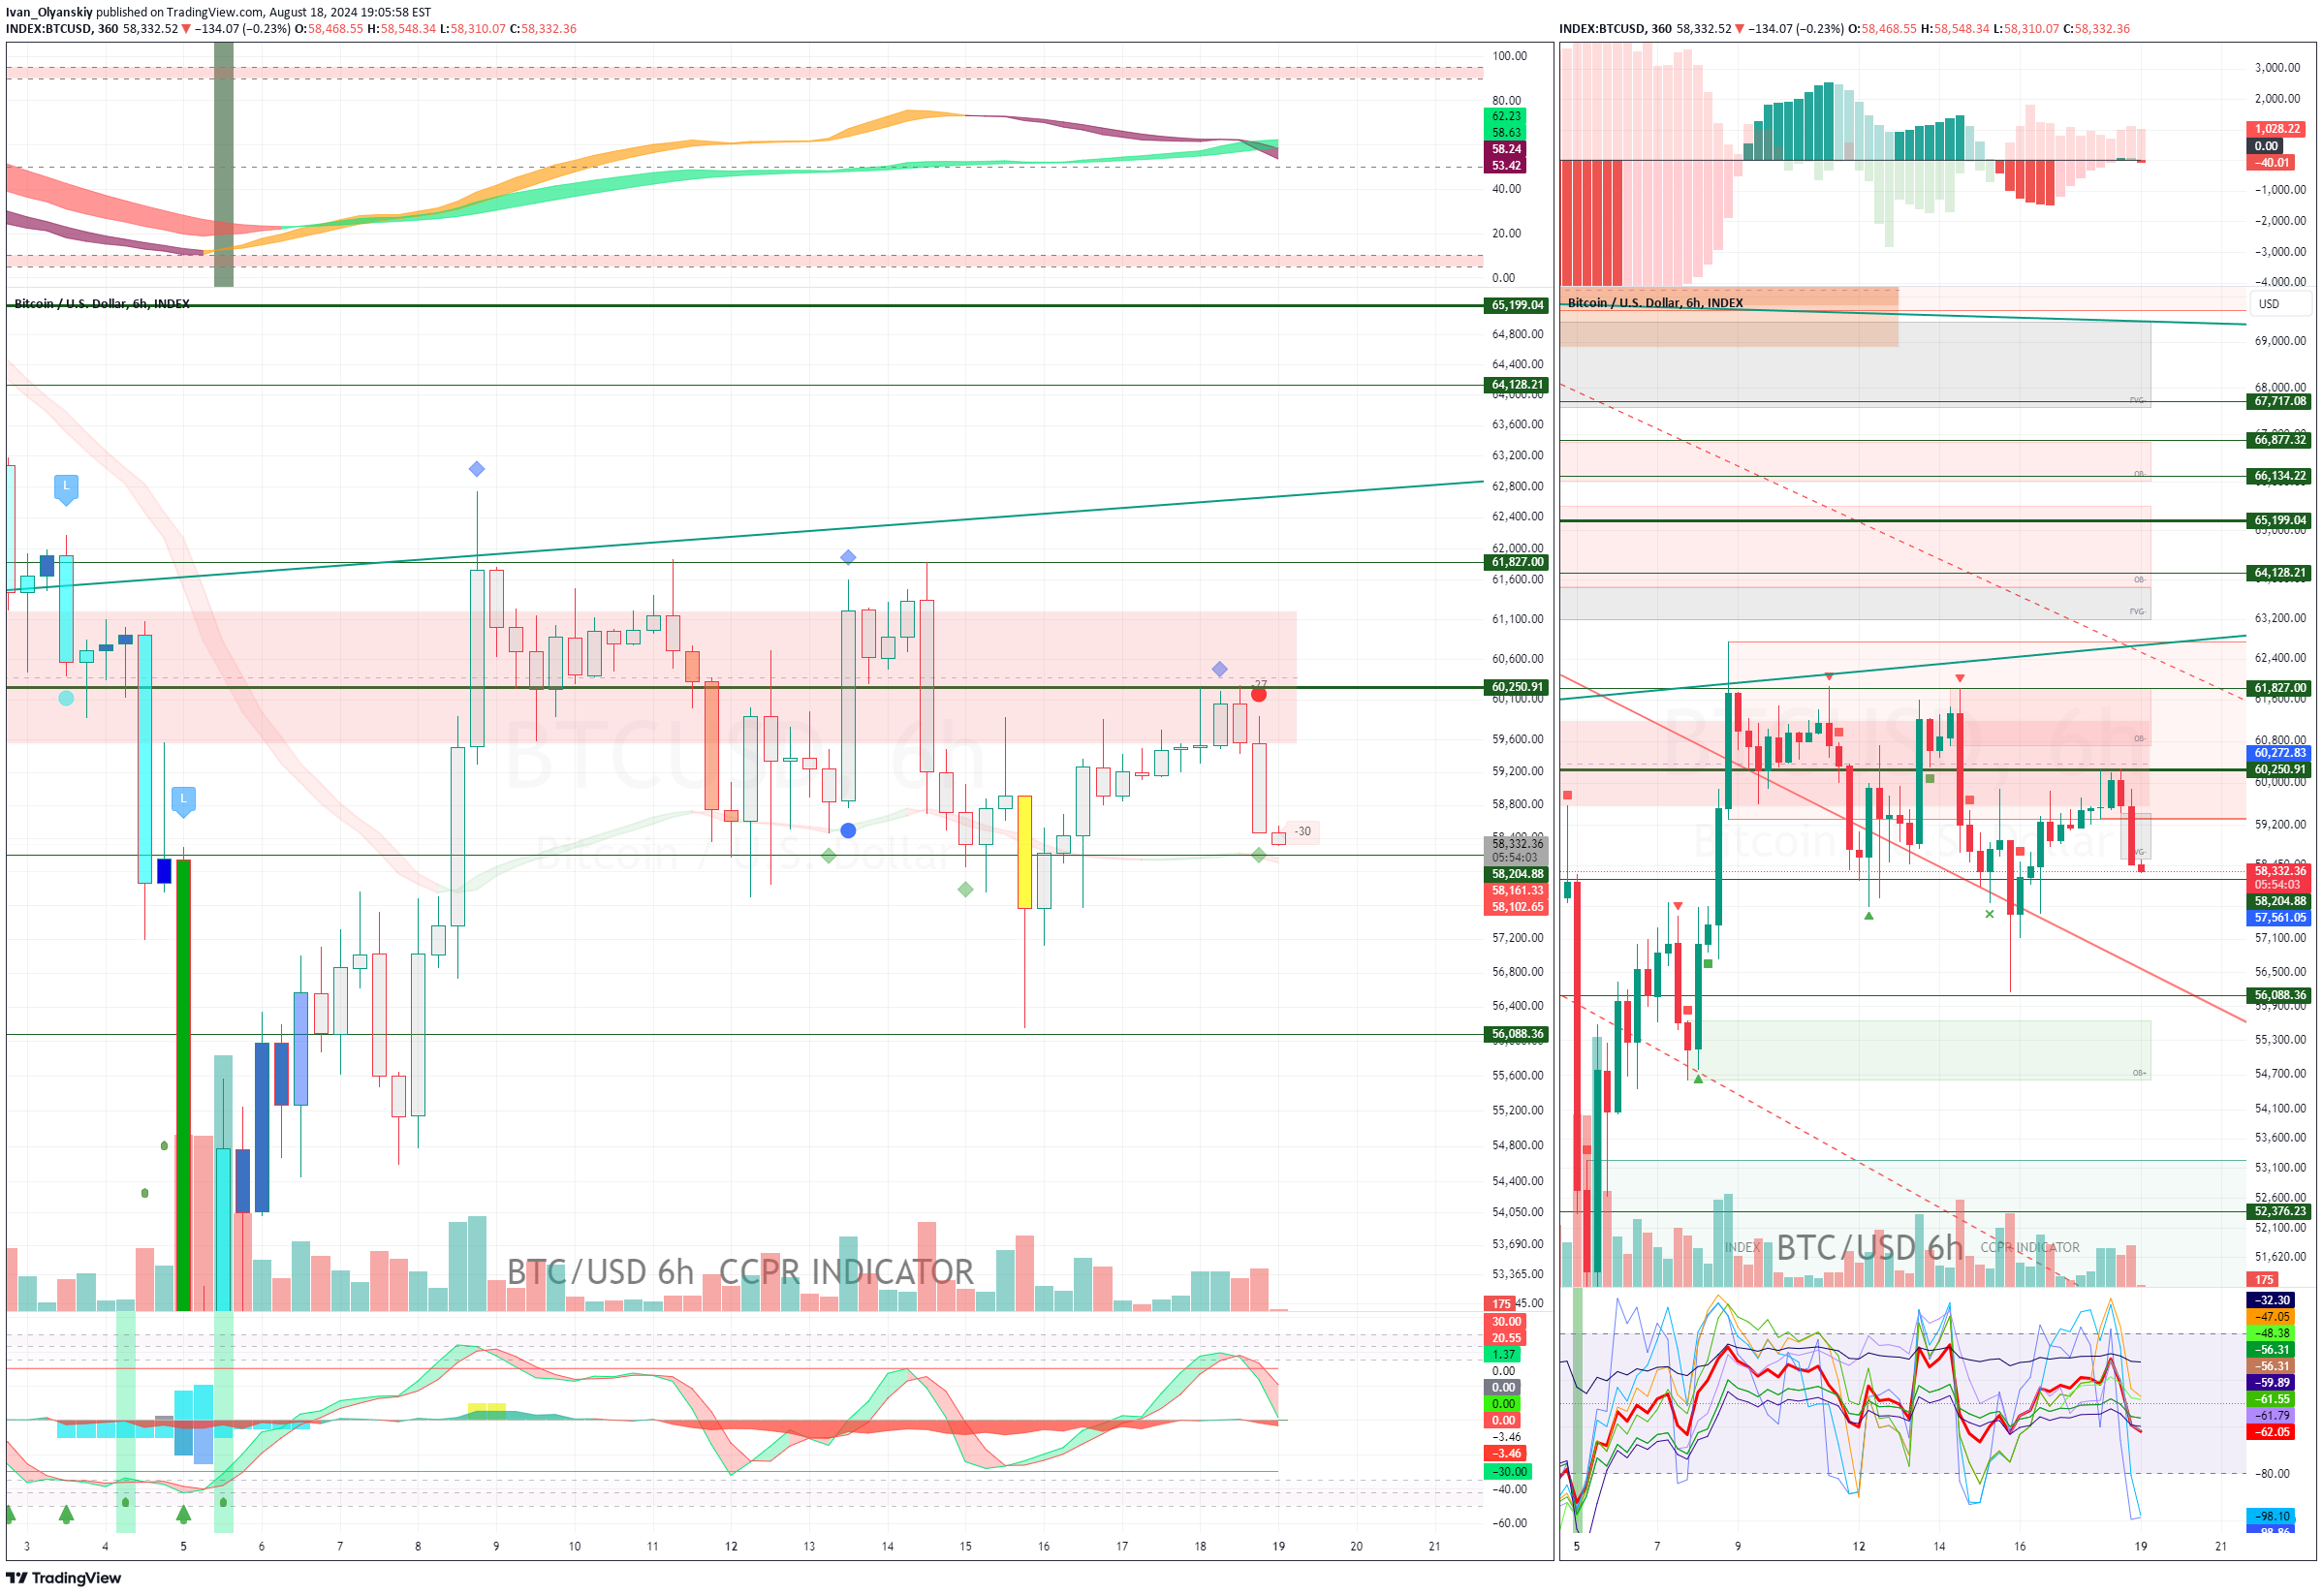
#BTC #6h #BIGREDDOT # 2024-08-19 03:00 | 58428.2 #anthropic/claude-3.5-sonnet # Analysis of the current situation: Funding on most exchanges is negative, indicating the prevalence of short positions. Trading volume is low (32.22), indicating low activity in the market. The Fear and Greed Index is in the fear zone (31), which also indicates the prevalence of bearish sentiment. # Support and resistance levels: Support: 58000, 57500, 57000 Resistance: 59000, 59500, 60000 # Forecast of the BTC price movement against the dollar: ## Short-term forecast: (intraday) A decline to the support level of 58000 is expected. #### Probability of movement: 65% ## Medium-term forecast: (1-7 days) A continuation of the downward trend with a target of 57000-57500 is likely. #### Probability of movement: 60% ## Long-term forecast: (2-3 weeks) A reversal pattern may form and an upward movement to 60000-61000 may begin. #### Probability of movement: 55% # Conclusions: The current BIGREDDOT signal indicates strong bearish pressure. Low trading volume and negative funding confirm the prevalence of short positions. However, long-term indicators show signs of oversold, which may lead to a trend reversal in the coming weeks. # Recommendations for entering a position: For short-term trading, it is recommended to open a short position from current levels with a target of 58,000. For medium-term trading - waiting for a rebound to 59,000-59,500 to enter a short position. For long-term trading - accumulation of long positions in the range of 57,000-58,000. # Entry and exit points and stop loss: (best option) Entry into a short position: 58400 Take profit: 57700 Stop loss: 58800 Risk/reward ratio: 1:3.5

Ivan_Olyanskiy
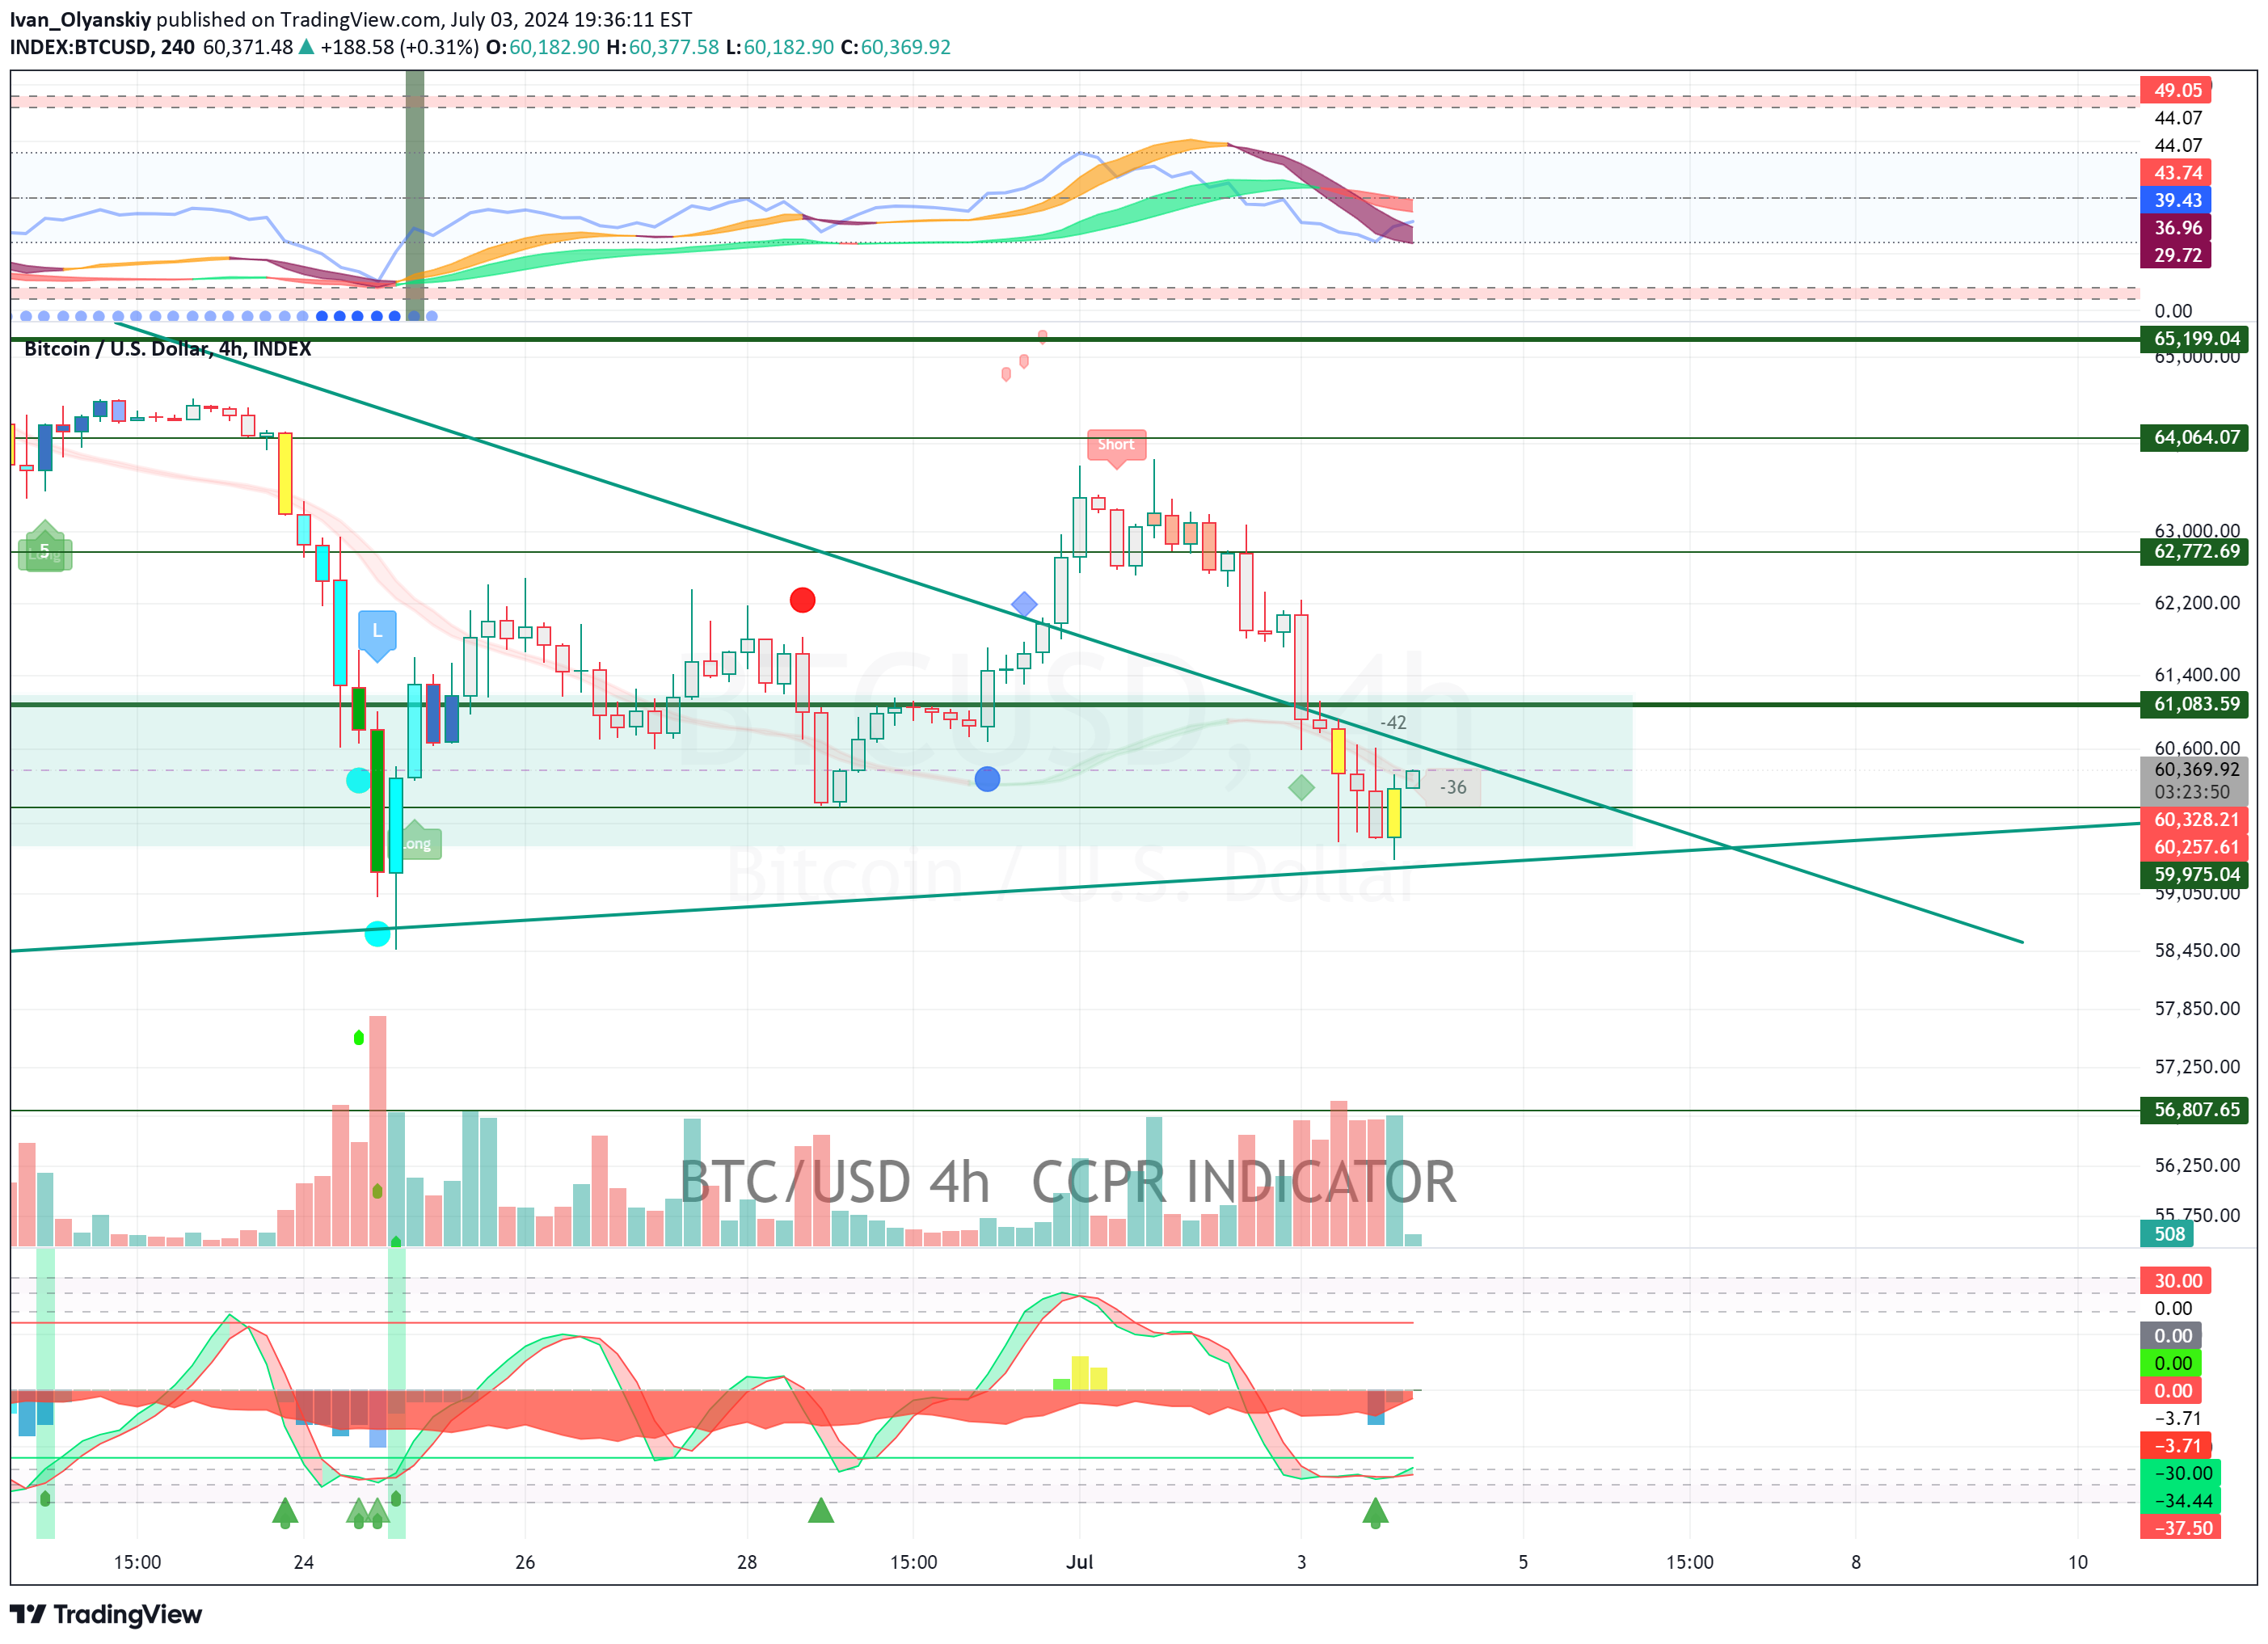
#BTC #4h #UpYellowBar 2024-07-04 03:04 | 60248 #anthropic/cloud-3.5-sonnet I will answer as a world famous trading expert with the most prestigious REAL WORLD award - BEST TRADER IN THE WORLD # Analysis of the current situation: Funding on most exchanges is weakly positive (0.01-0.02%), indicating moderately bullish sentiment. Trading volumes decreased compared to previous days, which may indicate some uncertainty in the market. The fear and greed index is at 44, which corresponds to the state of "fear" and may indicate a potential buying opportunity. # Support and resistance levels: Support: $59,400, $58,500 Resistance: $61,000, $62,200, $63,200 # Forecast of BTC price movement relative to the dollar: ## Short-term forecast: (intraday) Consolidation is expected in the range of $59,800-$60,800 with a possible breakout up to $61,000. #### Probability of movement: 60% up, 40% down ## Medium-term forecast: (1-7 days) An increase to the level of $62,000-$63,000 is likely, with a possible correction to $60,500. #### Probability of movement: 65% up, 35% down ## Long term forecast: (2-3 weeks) If the current dynamics are maintained, growth to $65,000-$66,000 is possible. #### Probability of movement: 70% up, 30% down # Conclusions: The market is in a consolidation phase after the recent decline. Technical indicators and market sentiment indicate potential for an upward move in the near future. However, you should be careful due to possible volatility. # Recommendations for entering a position: Consider opening a long position when the level of $60,800 is broken with a target of $62,000. Set a stop loss below the support level at $59,400. # Entry and exit locations and stop loss: (best option) Entry: $60,800 Take profit: $62,000 (profit 1.97%) Stop loss: $59,300 (2.47% risk) Risk/reward ratio: 1:0.8 (not ideal, but acceptable in current market conditions)

Ivan_Olyanskiy
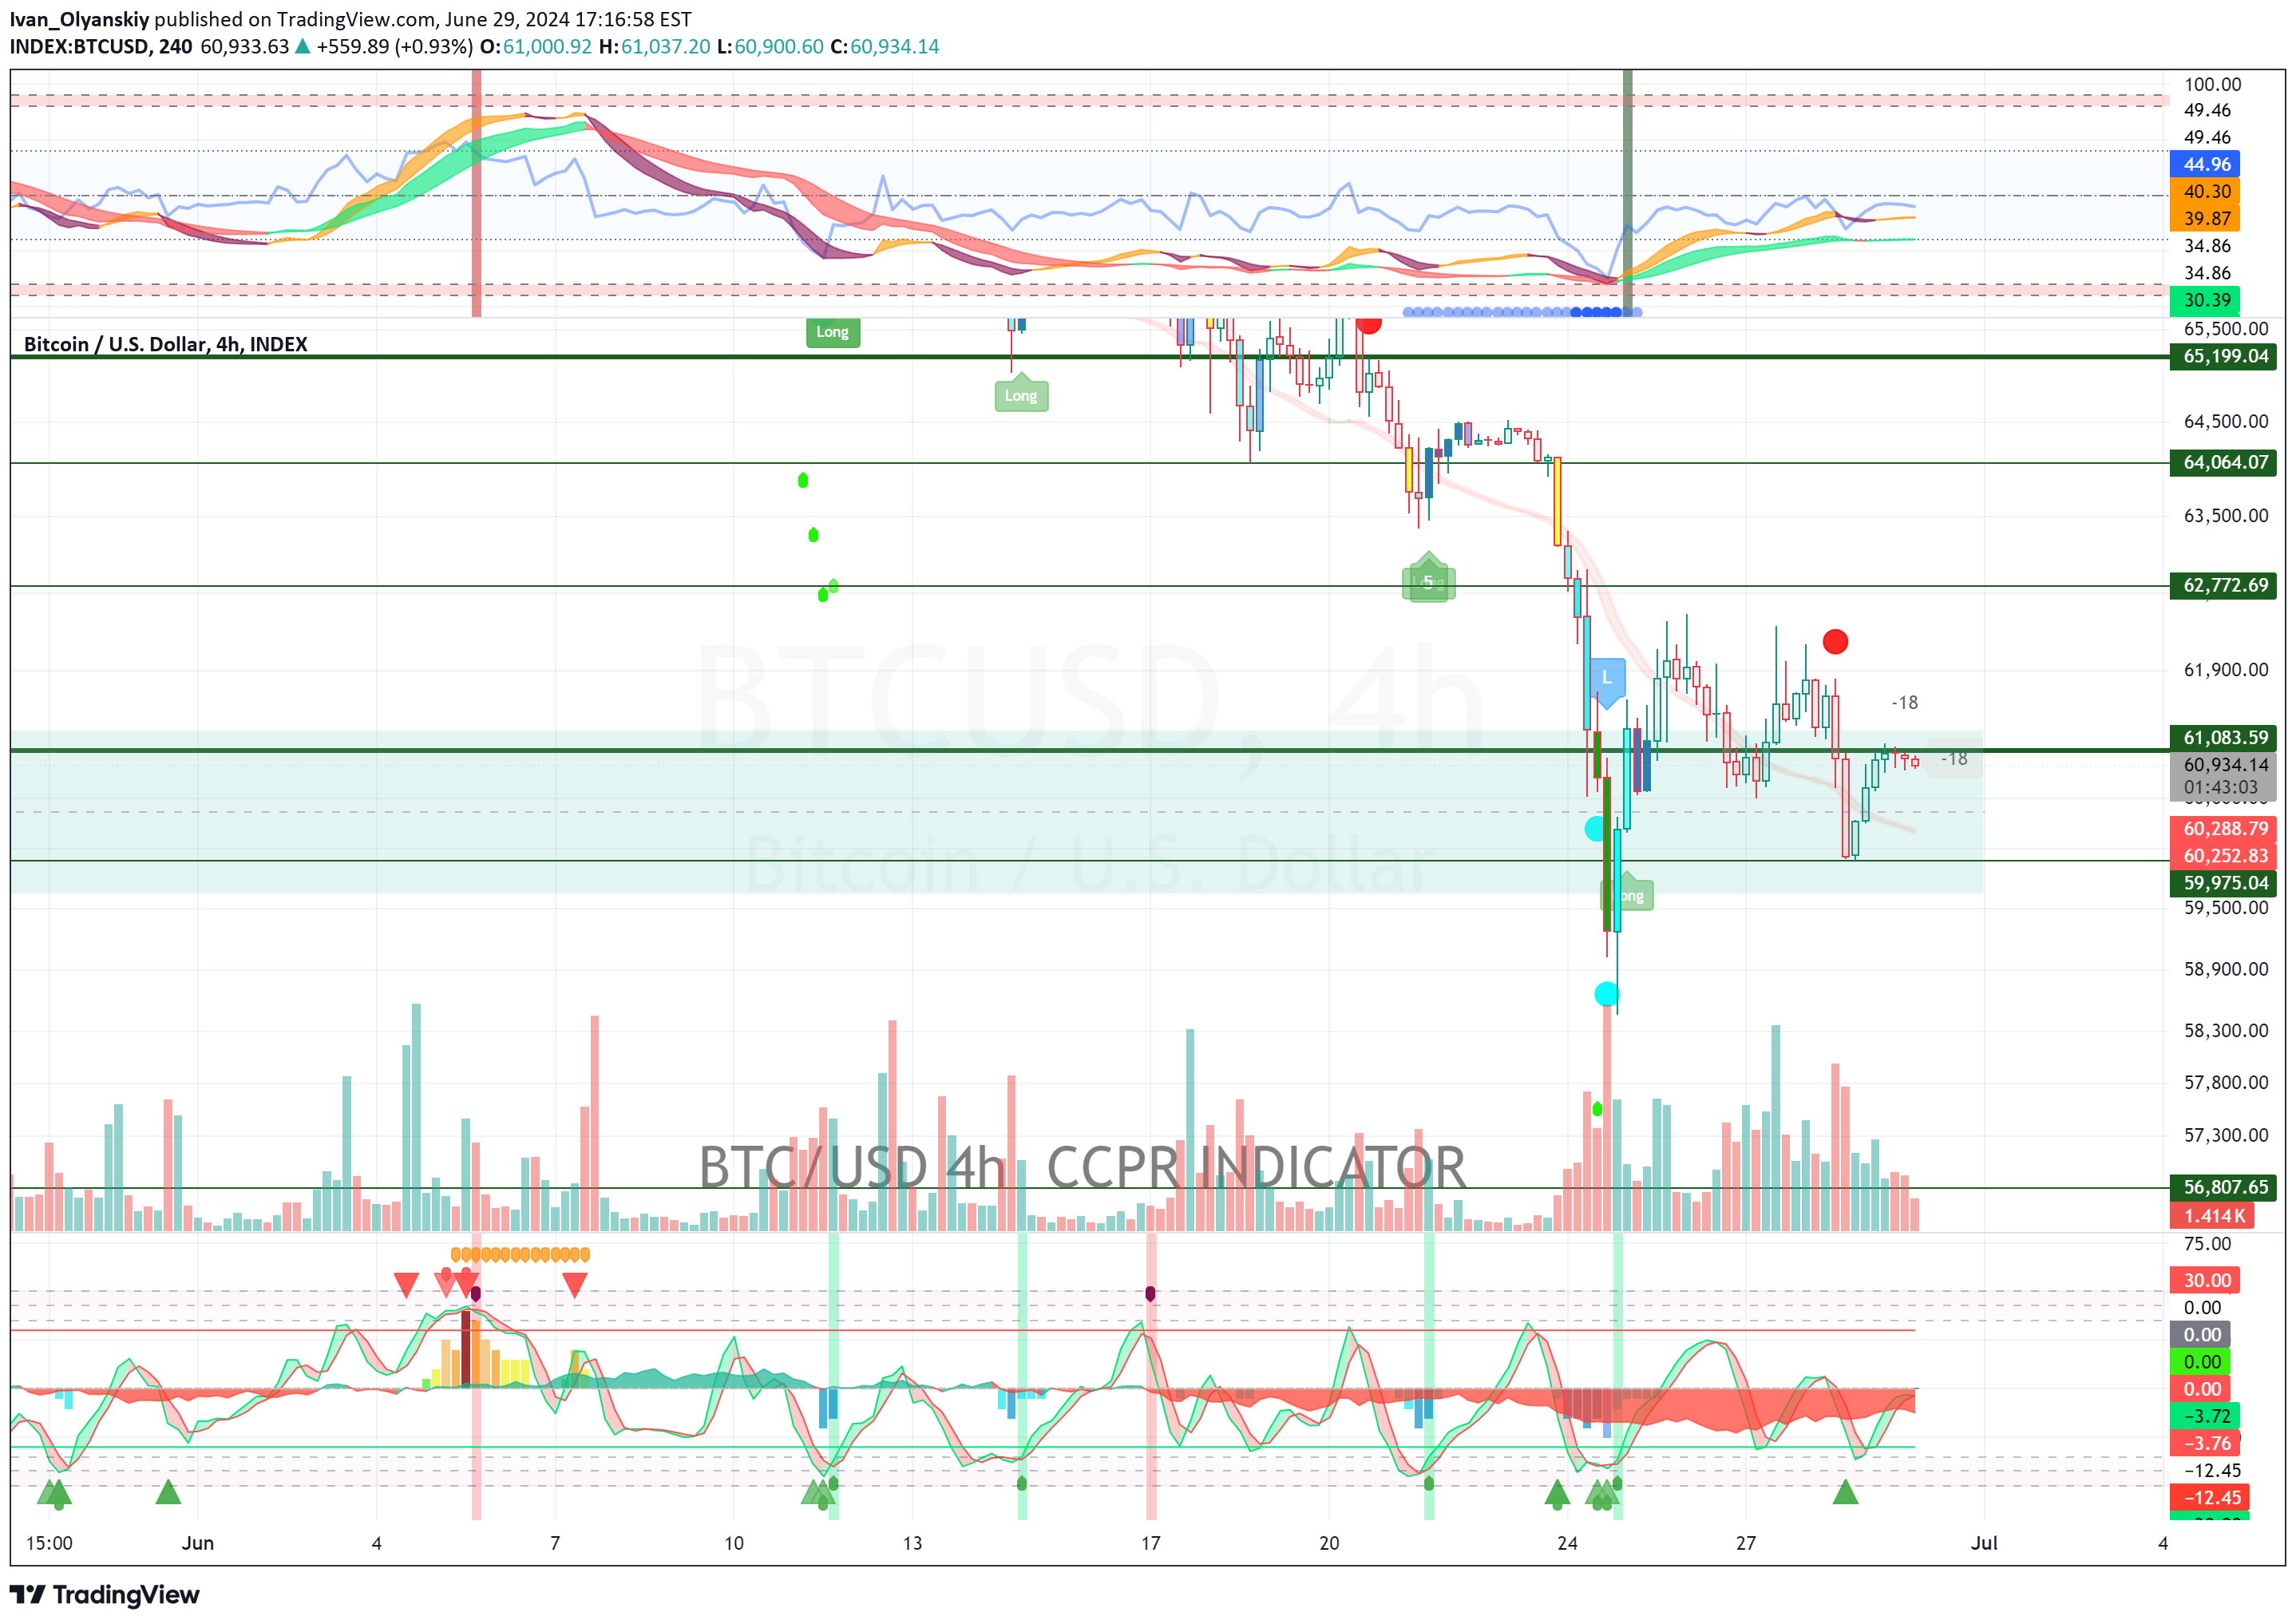
#BTC #4h BTCUSDT BTCUSDT BTCUSD 2024-06-29 23:00 | 61057.38 claude-3.5-sonnet I'll answer like a world-renowned trading expert with the most prestigious award - BEST TRADER IN THE WORLD # Current situation analysis: (funding and volume) Current aggregated funding is 0.0079%, indicating weak bullish sentiment in the market. Trading volumes are moderate, without significant spikes. The fear and greed index is at 30, indicating a predominance of fear in the market. # Support and resistance levels: Support: 60700, 60300, 59500 Resistance: 61200, 61600, 62000 # BTC price movement forecast against the dollar: ## Short-term forecast: (intraday) Consolidation in the range of 60700-61200 is expected with a possible breakout to 61600. #### Probability of movement: Up: 60% Down: 40% ## Medium-term forecast: (1-7 days) The uptrend is likely to continue with a target of 62000-63000. #### Probability of movement: Up: 65% Down: 35% ## Long-term forecast: (2-3 weeks) A correction to the levels of 58000-59000 is possible before the growth continues. #### Probability of movement: Up: 55% Down: 45% # Conclusions: 1. The market is in a consolidation phase after a recent decline. 2. Bullish sentiment prevails, but high volatility persists. 3. The key level is 61200 - its breakthrough will open the way to 62000. 4. It is necessary to monitor trading volumes to confirm movements. # Position entry recommendations: 1. Buy on a breakout of 61200 with a target of 61600-62000. 2. Sell from 61600 with a target of 60700-60300. 3. If 60300 breaks, it is possible to enter a short position with a target of 59500. # Entry and exit points and stop-loss: (best option) Long position entry: 61220 Take-profit: 61850 (profit 1.03%) Stop-loss: 60600 (risk 1.01%) Risk/reward ratio: 1:1.02

Ivan_Olyanskiy
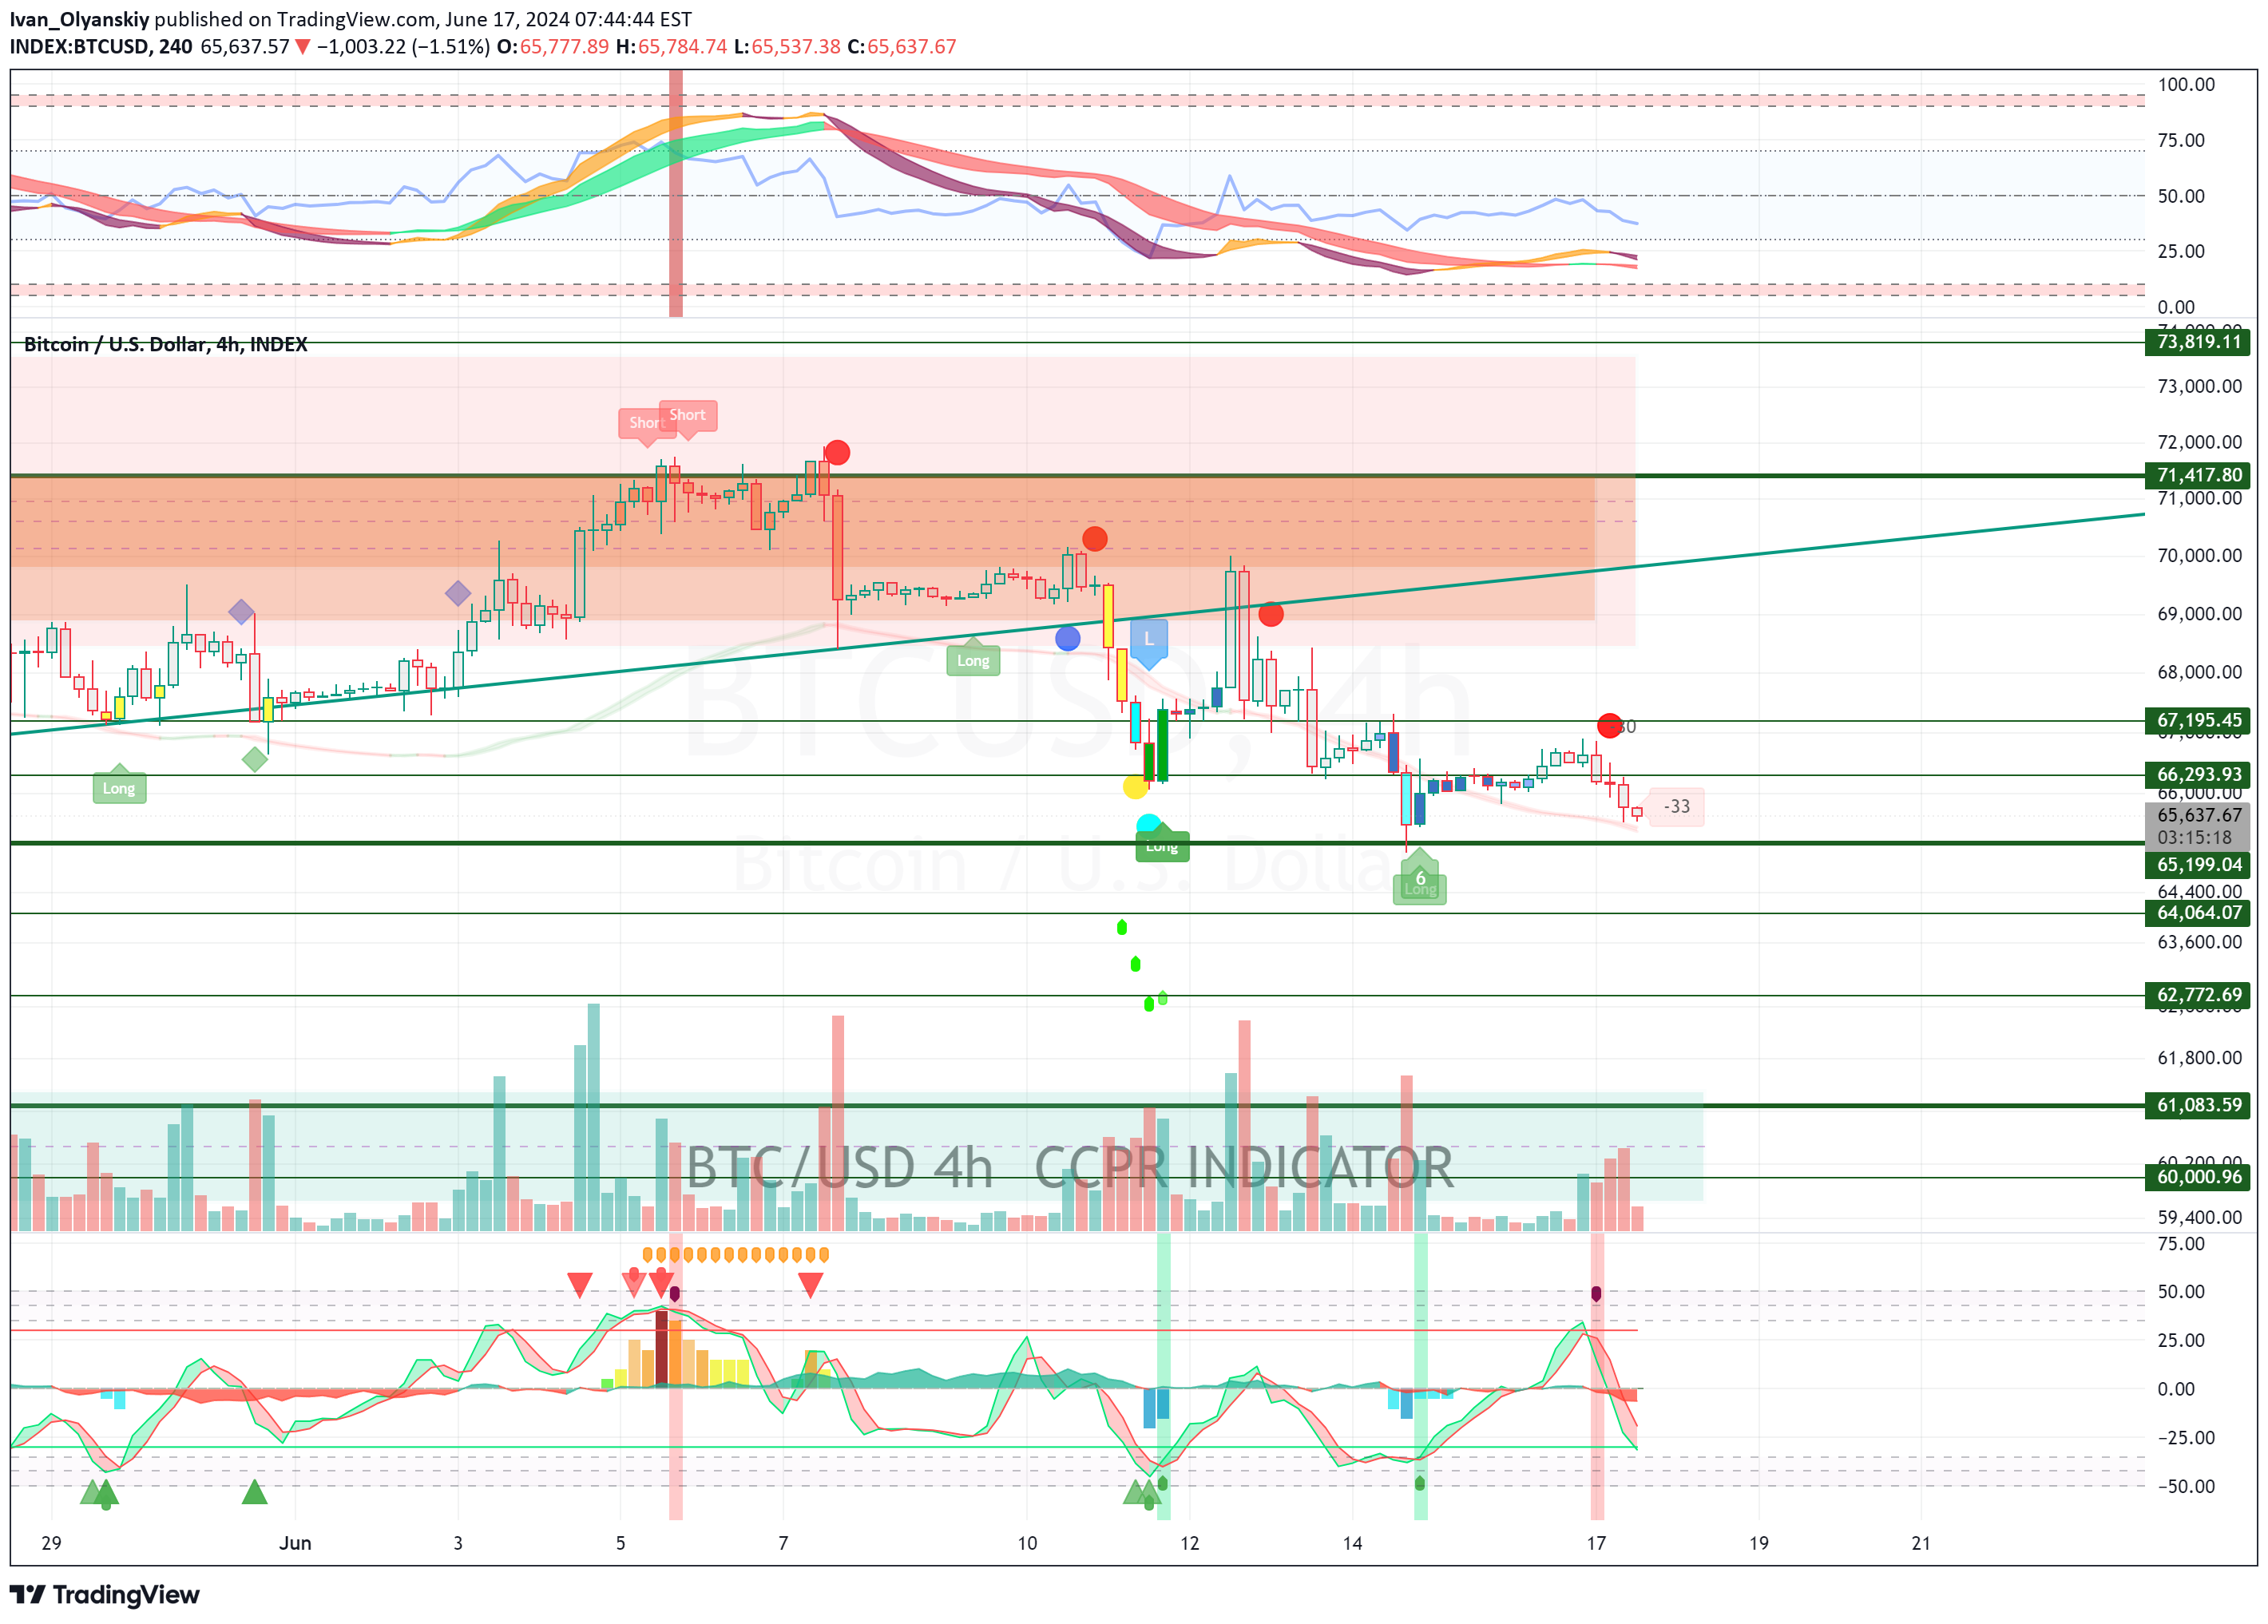
or 4 red - this is a wiring, and active growth should begin. # Analysis of the current situation On the 4-hour time frame, the current BIGREDDOT signal indicates buyer weakness. This may indicate a possible price reduction in the near future. # Support and resistance levels - Support: $66000, $65383 (UpTurquoiseBar level) - Resistance: $67000, $67449 (BIGREDDOT level) # Forecast of BTC price movement relative to the dollar ## Short term forecast: Based on current signals and funding data, the downtrend is likely to continue. The BIGREDDOT signal confirms the weakness of buyers, which may lead to a further decline in prices. ## Mid-term forecast: If the price breaks the support level at $66,000, the next target will be around $65,383. However, if strong reversal signals appear (for example, GreenDot or TurquoiseDot), a recovery to the resistance level in the area of $67,000-$67,449 is possible. ## Probability of movement: - Down: 70% - Up: 30% # Conclusions Current signals indicate a prevailing bearish mood in the market. Funding is also showing neutral readings, which does not support significant growth in the near term. # Recommendations for entering a position 1. Short-term traders may consider opening short positions if the $66,000 support level is broken with a target around $65,383. 2. Medium-term traders should monitor the emergence of strong reversal signals (GreenDot or TurquoiseDot) for possible entry into long positions when a trend reversal is confirmed. ### Conclusion Be attentive to changing market conditions and watch for new signals to adjust your strategy.

Ivan_Olyanskiy
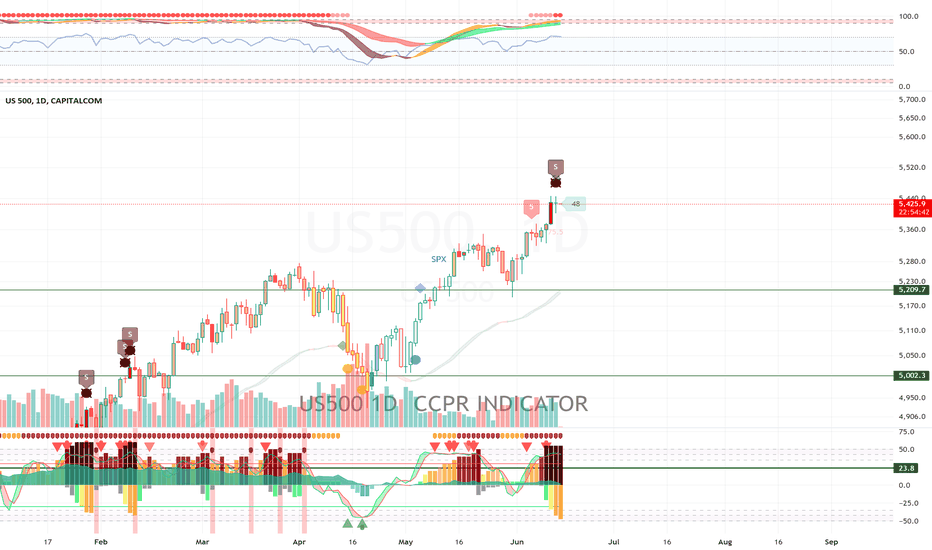
SPX SPX SPX SPX This analysis was performed by a neural network based on all signals from the indicator CCPR #US500 #1d #BrownDot 06/13/2024 | 5432.81 #google/gemini-flash-1.5 ### Analysis of the current situation: (funding and volume) *Funding: Funding on the US500 is in negative territory, indicating that sellers are more active than buyers. *Volume: Trading volume on the US500 has been above average in recent days, indicating increased interest in the market. ### Support and resistance level: * Resistance level: 5440, 5480 * Support level: 5380, 5340. ### Forecast for US500 price movement relative to the dollar: #### Brief immediate forecast: *Probability: 60% * Movement: The price is expected to drop by $500 in the coming days. * Signals: There is a strong signal for a downward reversal (BrownDot), which is confirmed by a weak buyer (BIGREDDOT) and negative funding. #### Medium-term forecast: *Probability: 40% * Movement: The price is expected to increase by US$500 in the medium term. * Signals: There is a downward divergence (DivergenceDOWN), which can be a trend reversal signal and preserves all previous downward signals. #### Motion reliability: * Up: 40% *Down: 60% ### Conclusions: * The current situation in the US500 market indicates a trend toward gradual price declines. * However, a downward divergence signal (DivergenceDOWN) can be a trend reversal signal and leaves all previous signals to fall. ### Recommendations for entering the position: * Short: Apply an open short position on US500 with a target of 5340, stop loss of 5400. * Long: thus delay opening long positions until the trend reverses. Additional factors to monitor: * News: Stay tuned for news that may appear in the $500 market, for example, for the publication of data on dynamics, interest rates, etc. *Volume: Follow trade analysis to ensure signal strength. Data for analysis: *Price: Keep an eye on the $500 price to determine its movement. * Indicators: Use indicators to give signals. *Volume: Follow trade research to identify strength signals.

Ivan_Olyanskiy
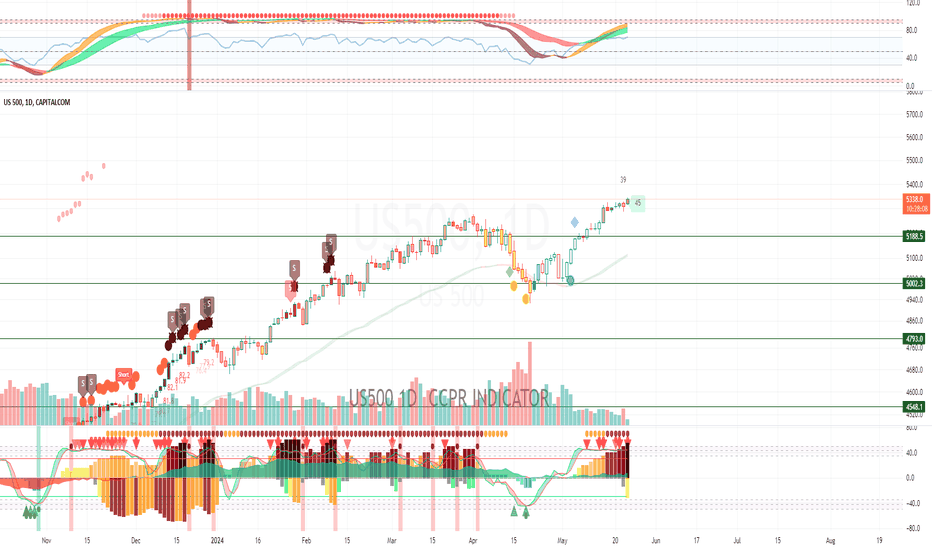
US500 1d 2024-05-22|5307.01 google/gemini-flash-1.5 Based on signals from the indicator CCPR # US500 price movement forecast relative to the dollar Briefly: In the near future, the US500 price is expected to move sideways with little growth potential. Support and resistance levels: * Resistance: 5320, 5350 * Support: 5250, 5200 Signals: * 1d: There is weakness of the seller (BLUEDOT) and the formation of a resistance level (DownOrangeBar). Signal strength is weak. * 4h: Seller weakness signal (BLUEDOT) and formation of resistance level (DownOrangeBar). Signal strength is weak. * 6h: Seller weakness signal (BLUEDOT) and formation of resistance level (DownOrangeBar). Signal strength is weak. * 8h: Seller weakness signal (BLUEDOT) and formation of resistance level (DownOrangeBar). Signal strength is weak. * 10h: Seller weakness signal (BLUEDOT) and formation of resistance level (DownOrangeBar). Signal strength is weak. Conclusion: There are weak downside signals, but they are not strong enough for a confident forecast. In general, sideways price movement prevails at the moment. Probability of movement: * Up: 40% *Down: 40% * Lateral: 20% The best place to enter a position: * Buy: Upon breakdown of the resistance level 5320 with confirmation by strong signals for growth. * Sell: Upon breakdown of the support level of 5250 with confirmation by strong downward signals. Additional factors to watch for: * Economic News: Follow the release of macroeconomic data such as the Consumer Price Index (CPI), Business Purchasing Index (PMI) and employment reports. * Political Situation: Monitor political events that may affect the market, such as elections, trade wars and geopolitical conflicts. * Monetary Policy: Monitor central bank decisions on interest rates and quantitative easing. Data for analysis: *Price: Current price is US500. *Volume: Trading volume US500. * Indicators: Keep an eye on technical indicators such as RSI, MACD and Bollinger Bands. Important: *This forecast is based on analysis of historical data and is not a guarantee of future results. * Investing always involves risk. *Consult your financial advisor before making investment decisions.

Ivan_Olyanskiy
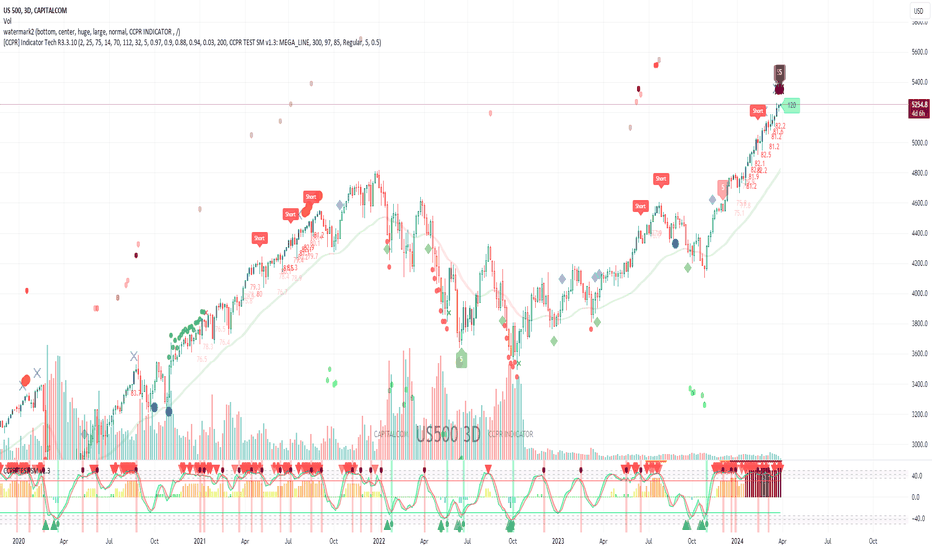
Guys, using the maximum filter for 3 days - signals were sent that everyone had arrived) + news seen today that everyone is long on shares) will probably be damped soon There has never been a total overheating of such signals. SPX SPX SPX SPX SPX500USD SPXL There is also a strong downward signal this week

Ivan_Olyanskiy
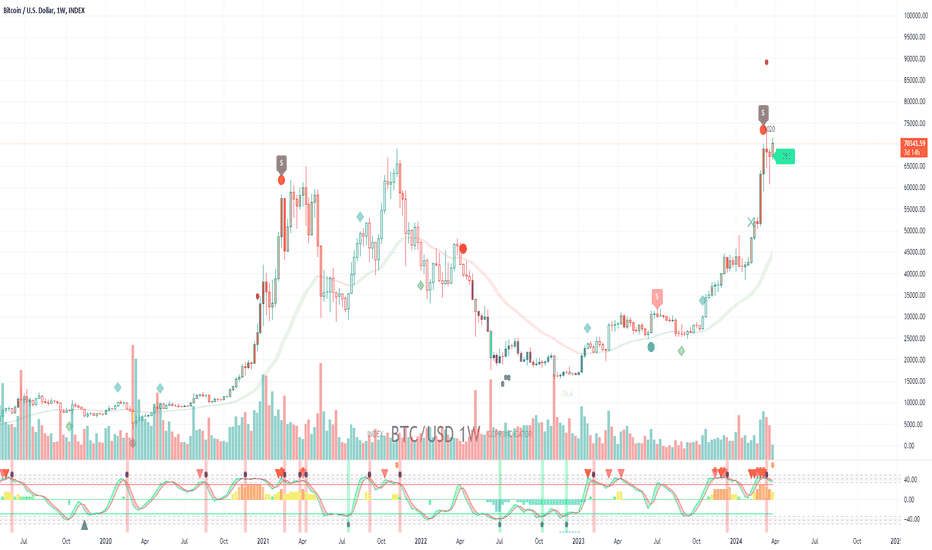
If we consider all tfs that are above the daily rate, then many indicators indicate continued growth. Just a huge cash flow. All indicators have been unloaded. A very large buyer index. 68500 is a very strong level, which is now acting as strong support. Based on such data, the probability of touching ATH again is very high. But I don’t have enough strength yet to move on at the same pace.

Ivan_Olyanskiy
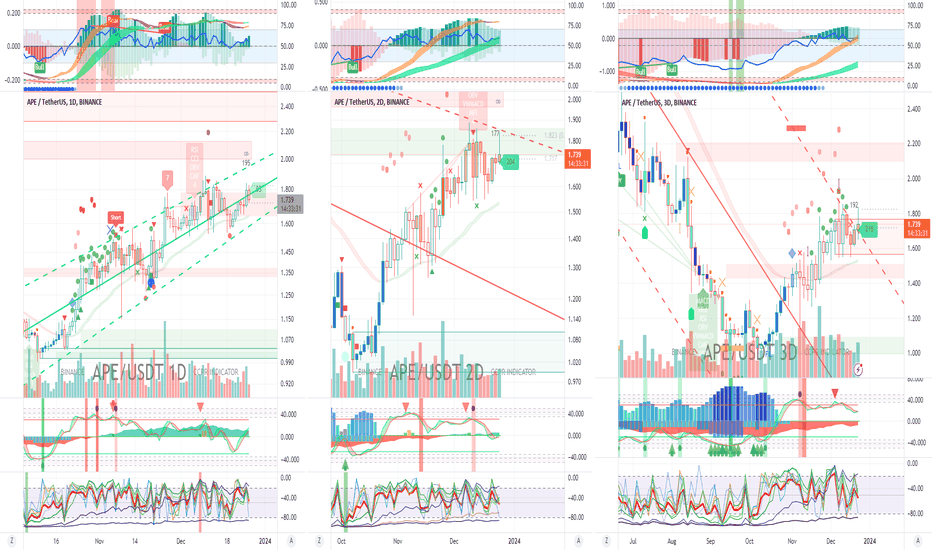
APEUSDT Month. Little data. But there are strong signals to continue growing. Week. Strong resistance here, if broken there will be a very strong move up, but the index is still short, money flow in the red zone, sales are going. If buyers are at 1.2 then hold. Or place a limit order here, good price. 3 days - also at resistance and looks weak of course, no buyers here. But! There is a lot of manipulation, pushed down hard. Breakout will happen for sure, but not a fact that soon. Daily is weak, growth due to Bitcoin. If consolidates above 1.73 - then there is a probability to go further up.

Ivan_Olyanskiy
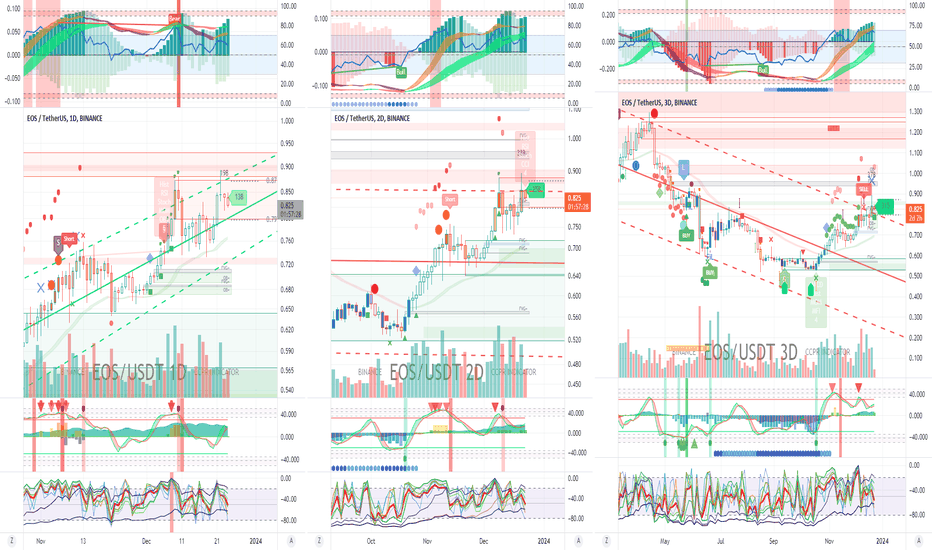
EOS has had a good month, with clear signs of being oversold. There are also many signals indicating a potential reversal. However, the seller's index is still high, making it easier for the price to drop further. On the weekly chart, there are signs of strong selling pressure but also signals pointing towards a possible turnaround. The 'money flow' indicator is in the red zone, indicating ongoing selling activity. The three-day chart shows no manipulation and presence of sellers. Yet here we can see a promising buying zone emerging between $0.52 and $0.60. As for the daily chart, it's neutral. As Bitcoin moves, so does this asset.)
Disclaimer
Any content and materials included in Sahmeto's website and official communication channels are a compilation of personal opinions and analyses and are not binding. They do not constitute any recommendation for buying, selling, entering or exiting the stock market and cryptocurrency market. Also, all news and analyses included in the website and channels are merely republished information from official and unofficial domestic and foreign sources, and it is obvious that users of the said content are responsible for following up and ensuring the authenticity and accuracy of the materials. Therefore, while disclaiming responsibility, it is declared that the responsibility for any decision-making, action, and potential profit and loss in the capital market and cryptocurrency market lies with the trader.