
ItsNutsTrades
@t_ItsNutsTrades

What symbols does the trader recommend buying?
Purchase History
پیام های تریدر
Filter
ItsNutsTrades
NMR - PRICE $24 - $53
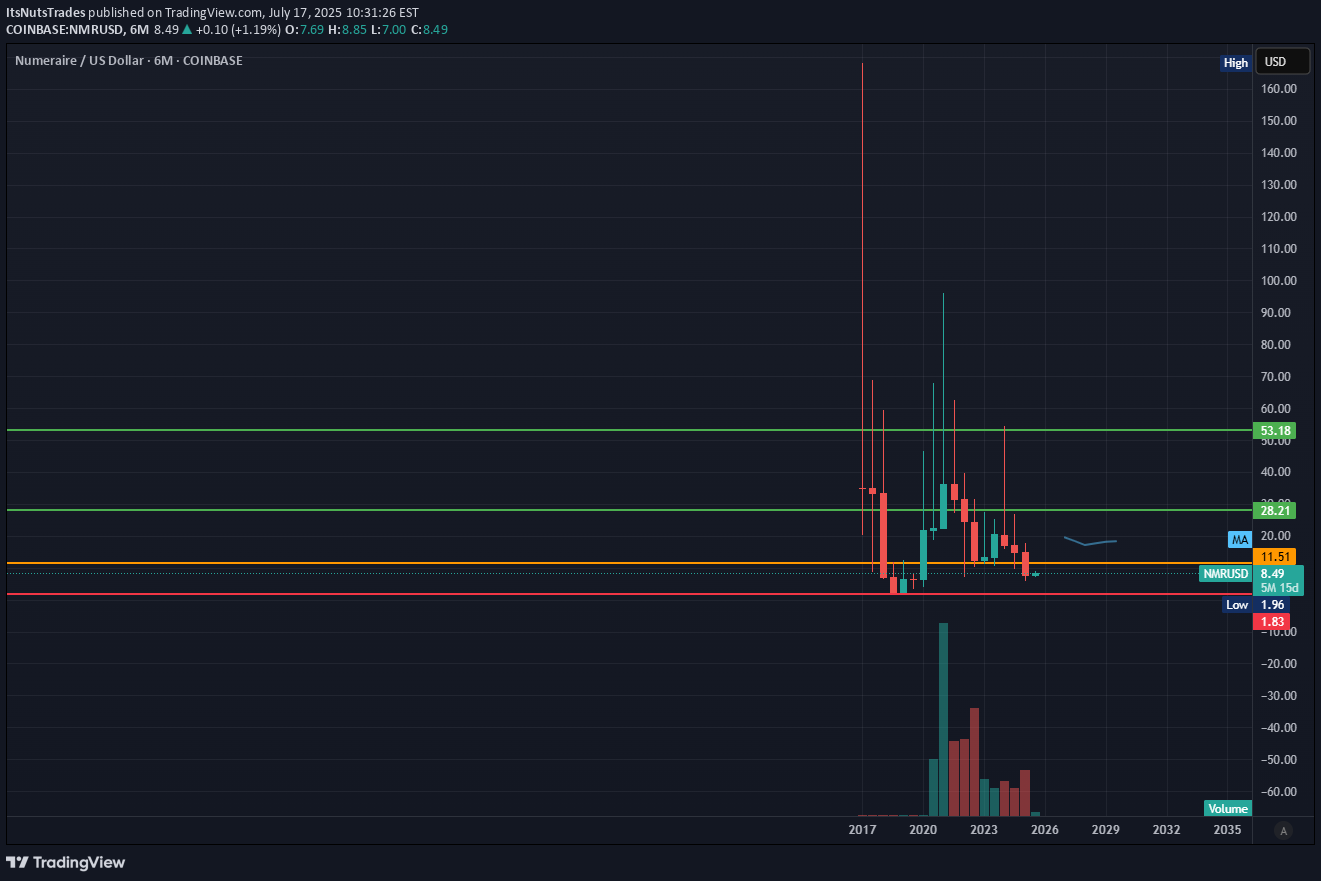
Price Target Summary Chart High: Approximately $28 (Nov–Dec 2024) Recent Low: Around $6 (June 2025) Key Breakout Zone: $8.50–$9.00 NMR is approaching a critical breakout level and showing signs of bullish momentum. Short-Term Trend: Mild uptrend forming since mid-June 2025 Volume: Moderate, with some spikes suggesting accumulation Previous Resistance: Around $9.50 - $10.00 Major Support: Around $6.00 - $6.50 HH on Chart: ~$28 (in late 2024) 2025 - Price Target $24 - $53
ItsNutsTrades
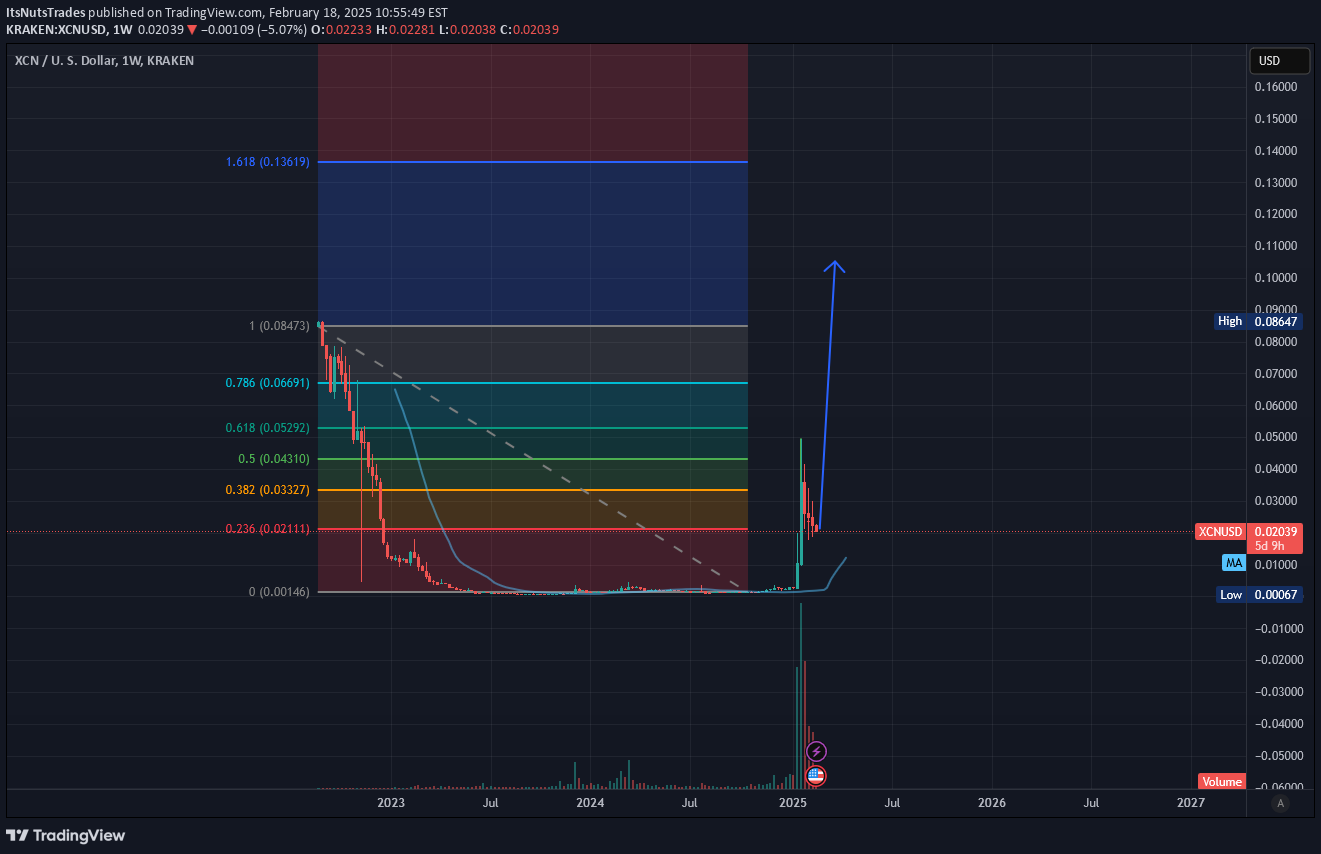
Key Chart Elements: Fibonacci Retracement Levels The chart includes a Fibonacci retracement tool from a high of $0.08473 down to a low near $0.00146. Key levels: 0.236 ($0.02111) 0.382 ($0.03327) 0.5 ($0.04310) 0.618 ($0.05292) 0.786 ($0.06691) Price is currently hovering around the 0.236 retracement level, which is often a weak resistance level. Price Action & Volume A massive downtrend took place from August 2022 to early 2024. A recent spike in volume suggests renewed interest in the asset. The price had a sharp bounce from the bottom, indicating a possible reversal or speculative accumulation. Technical Outlook (Projected Path) The dotted gray trendline suggests a prior long-term downtrend. The blue curved line indicates a potential rounding bottom pattern, often a sign of accumulation before a move higher. The blue upward arrow suggests a bullish breakout projection, possibly toward the 0.618 or 0.786 Fibonacci levels ($0.05292–$0.06691). A break above $0.08473 (previous high) could confirm a major trend reversal. Support & Resistance Support Levels: $0.011 (Moving Average) $0.00146 (All-time low) Resistance Levels: $0.033 (0.382 Fib) $0.043 (0.5 Fib) $0.066 (0.786 Fib)Potential Scenarios: Bullish Case: If volume sustains and breaks key resistance levels, price could rally toward $0.10-$0.25 Bearish Case: If buying momentum fades, price may retest support near $0.011 before another attempt at breaking higher.
ItsNutsTrades

Downtrend with Potential Reversal: The price has been in a consistent downtrend, but a bullish inverted hammer is forming, which could indicate a reversal. The price is currently sitting near a strong support zone (marked in red). Support & Resistance Levels: Support Levels: Around $0.0186, $0.0183, and $0.0158 (red zones). Resistance Levels: $0.0217 (yellow), $0.0251, $0.0268, $0.0303, $0.0341, $0.0493, and $0.0611 (green zones). Indicators & Moving Average: The moving average (MA) is above the current price, acting as resistance. A possible breakout above the MA could indicate further upside movement. Bullish Scenario (Green Path Projection): If price breaks above $0.0217 and $0.0251, we could see a strong recovery towards $0.0341 and potentially $0.0493 or higher. Bearish Scenario: If price fails to hold support around $0.0186 - $0.0158, further downside could be seen.Conclusion: A reversal seems likely, but confirmation is needed (break above resistance). Watch for volume increase and price action near key resistance levels before making a move. If bullish momentum builds, the price could follow the green trajectory towards $0.0341 - $0.0611.
ItsNutsTrades

The price experienced a strong uptrend followed by volatility and a retracement.It peaked around January 27th, followed by a pullback.There seems to be recent consolidation and a possible attempt at recovery.The volume spikes suggest periods of high trading activity, especially during sharp price movements.Current volume appears moderate, indicating less extreme volatility.If the price breaks above recent highs, it may attempt to rally towards $0.05.If it fails to break resistance, it could retest support near $0.025.Watch for volume increases, which may indicate the next strong move.
ItsNutsTrades

The price has seen a significant upward movement but now appears to be consolidating. Multiple Bearish Harami, Bearish Hammer, and Bearish Marubozu patterns indicate potential reversal or downtrend continuation. Some Bullish Harami, Bullish Marubozu, and Three White Soldiers suggest strong bullish signals.Ichimoku Cloud: The price is above the green cloud, which usually indicates a bullish trend. However, if the price falls below the 0.0311, it could signal weakness.Resistance Levels (Ceiling where price may struggle to move higher) $0.0432 - $0.0462 → Previous high, strong selling pressure. $0.0355 - $0.0360 → Minor resistance, if broken could push price higher. $0.0335 → Psychological resistance around this level.Support Levels (Floor where price may find buying interest) $0.0310 - $0.0319 → Current price zone, key short-term support. $0.0304 - $0.0306 → If broken, could lead to more downside movement. $0.0256 → Stronger support, price may bounce here if selling continues.Outlook: If XCN holds above $0.0310, it might attempt to retest $0.0335-$0.0355 resistance. If price falls below $0.0304, expect a move towards $0.0256 support. Ichimoku Cloud suggests a bullish bias as long as price stays above the cloud.IMO - BULL SOON
ItsNutsTrades

Possible Idea - Buy Zone Description for Onyxcoin (XCN) at 0.02232The buy zone at 0.02232 represents a key support level for Onyxcoin (XCN) on the 4-hour timeframe from the Coinbase exchange. This level is marked by a red horizontal support line, indicating an area where price previously found strong buying interest.The SMA indicators suggest an upward trend, but a potential retracement to 0.02232 could offer a buying opportunity. If price revisits this support, it may provide a favorable risk-reward entry before another upward move. Entry: Consider buying near 0.02232 if the price holds above this level with strong volume. Stop-Loss: Set below the support (e.g., 0.02150) to minimize downside risk. Target: Look for a potential upside move towards resistance levels at 0.03128 or higher.This zone could act as a retest area before continuation if the bullish trend remains intact. Always use risk management and monitor price action closely. 🚀NOT FINANCIAL ADVICE = TRADE AT YOUR OWN RISK
Disclaimer
Any content and materials included in Sahmeto's website and official communication channels are a compilation of personal opinions and analyses and are not binding. They do not constitute any recommendation for buying, selling, entering or exiting the stock market and cryptocurrency market. Also, all news and analyses included in the website and channels are merely republished information from official and unofficial domestic and foreign sources, and it is obvious that users of the said content are responsible for following up and ensuring the authenticity and accuracy of the materials. Therefore, while disclaiming responsibility, it is declared that the responsibility for any decision-making, action, and potential profit and loss in the capital market and cryptocurrency market lies with the trader.