Technical analysis by ItsNutsTrades about Symbol XCN: Buy recommendation (2/18/2025)

ItsNutsTrades
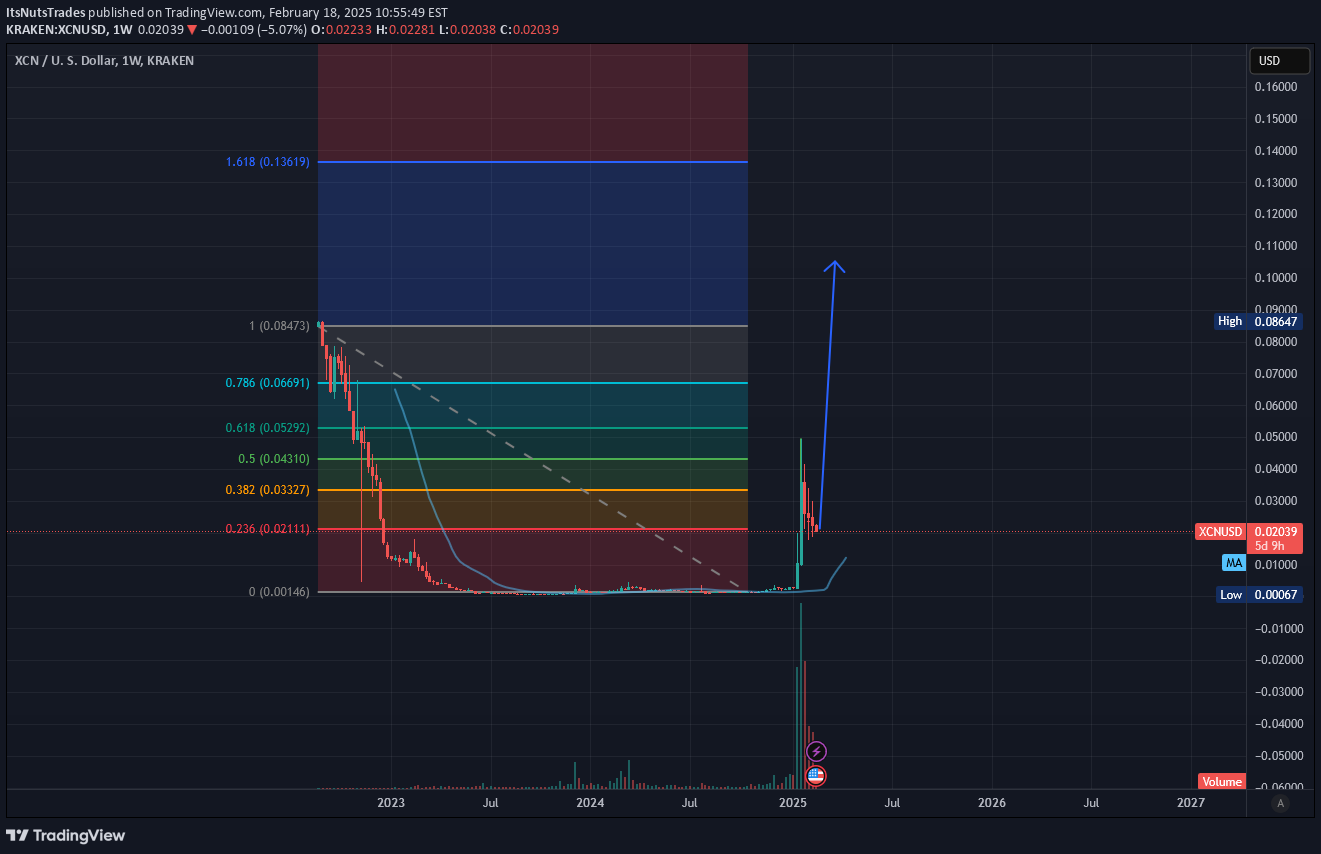
Key Chart Elements: Fibonacci Retracement Levels The chart includes a Fibonacci retracement tool from a high of $0.08473 down to a low near $0.00146. Key levels: 0.236 ($0.02111) 0.382 ($0.03327) 0.5 ($0.04310) 0.618 ($0.05292) 0.786 ($0.06691) Price is currently hovering around the 0.236 retracement level, which is often a weak resistance level. Price Action & Volume A massive downtrend took place from August 2022 to early 2024. A recent spike in volume suggests renewed interest in the asset. The price had a sharp bounce from the bottom, indicating a possible reversal or speculative accumulation. Technical Outlook (Projected Path) The dotted gray trendline suggests a prior long-term downtrend. The blue curved line indicates a potential rounding bottom pattern, often a sign of accumulation before a move higher. The blue upward arrow suggests a bullish breakout projection, possibly toward the 0.618 or 0.786 Fibonacci levels ($0.05292–$0.06691). A break above $0.08473 (previous high) could confirm a major trend reversal. Support & Resistance Support Levels: $0.011 (Moving Average) $0.00146 (All-time low) Resistance Levels: $0.033 (0.382 Fib) $0.043 (0.5 Fib) $0.066 (0.786 Fib)Potential Scenarios: Bullish Case: If volume sustains and breaks key resistance levels, price could rally toward $0.10-$0.25 Bearish Case: If buying momentum fades, price may retest support near $0.011 before another attempt at breaking higher.
