
InvrsROBINHOOD
@t_InvrsROBINHOOD

What symbols does the trader recommend buying?
Purchase History
پیام های تریدر
Filter
InvrsROBINHOOD
The End Of The Bitcoin Bull Market

### Rising Wedge Pattern 1. **Definition**: - A rising wedge is a bearish chart pattern that forms when the price action creates higher highs and higher lows. It appears as two converging trend lines that slope upwards. 2. **Interpretation**: - While the pattern may initially appear bullish because prices are rising, it often indicates a weakening momentum. The convergence of the price action typically hints at a potential reversal. 3. **Market Psychology**: - A rising wedge could serve to entice retail investors to enter the market, believing that significant price gains are forthcoming. This psychological dynamic draws in latecomers, or "bag holders," who may ultimately face losses when the market reverses. ### Distribution to Institutions 1. **Distribution Phase**: - Institutions might use a rising wedge as an opportunity to distribute their holdings to retail investors. By creating a sense of bullish momentum, they can offload their positions to less experienced traders who believe the uptrend will continue. 2. **Exit Strategy**: - As prices reach key resistance levels—like the psychological milestone of **$100,000**—institutional players may resemble the "smart money" capturing profit while retail investors are left in a vulnerable position. ### Breakout and Market Dynamics 1. **False Breakouts**: - Traders often see breakouts above wedge patterns as bullish signals; however, if the breakout is accompanied by low volume or a lack of support, it may lead to a rapid reversal. This creates a scenario where the last buyers ("bag holders") are left holding their investments when the price suddenly drops. 2. **Market Sentiment**: - The sentiment surrounding the notion of reaching **$100,000** might amplify this dynamic, as many traders may set profit targets around this level, enhancing the potential for a “trap” where many participants are caught off guard when prices reverse. ### Implications for the Bear Market 1. **Transition to Bear Market**: - If the rising wedge plays out as expected, it could herald the beginning of a bear market after the peak. Historical patterns suggest that rapid escalations often precede significant corrections, where prices can decline sharply. 2. **Caution for Retail Investors**: - It’s essential for retail investors to remain cautious and aware of the potential for such market dynamics. Recognizing patterns and understanding the motivations of institutional traders can aid in making informed decisions. 3. **Profit Taking**: - As you pointed out, many traders have specific profit-taking targets; awareness of these can influence behavior. The transition from bullish to bearish sentiment can happen quickly, especially as those targets are hit and selling pressure increases. ### Conclusion Your expectation regarding a rising wedge pattern in Bitcoin highlights the interplay between market psychology, technical patterns, and the strategies employed by different types of market participants. Not only does this analysis provide insights into potential price movements, but it also underscores the importance of risk management and being aware of psychological traps in trading. Keeping an eye on market sentiment, price patterns, and trading volume can help traders navigate the complexities of Bitcoin's price action, especially during periods of potential volatility leading from a bull market into a bear market. It's an interesting narrative that encapsulates the dynamics often seen in crypto markets!
InvrsROBINHOOD
#Bitcoin | Inducement Range As We Go Through Elections

Given the current uncertainty surrounding the elections, I anticipated a rejection off the open wick at the range's high, which could initiate a consolidation phase characterized by lower-time-frame inducement. This setup aims to engineer additional liquidity around the 73k high. Analyzing the present market structure reveals two sharp impulsive moves, with price currently ranging above the sell-side liquidity pool. It appears rational to expect a manipulation leg down to the 63k - 64k range before we ultimately clear the highs and enter a phase of price discovery. As we enter this price discovery phase, I believe it will trigger significant liquidations from short sellers, creating upward momentum that pushes the price even further. Following this expansion, I foresee a final consolidation forming at higher levels. This consolidation may be tight enough to catch traders off guard before the price breaks above the previous high, which I expect will lead us to the fifth wave of the fifth macro wave, effectively topping the current market cycle.I think this invalidated? lmfao
InvrsROBINHOOD
#BITCOIN
BERA at 89k, 89k is the 1.0 fib extension from 2012. Wouldnt it be poetic if BTC tapped the 1.0 and retraced to complete its cycle. All the way from the 0 starting point. Like an algorithim should.
InvrsROBINHOOD
$BTC #Bitcoin - Looks Distributive.

High time frame I am still bullish on Bitcoin, the August 5th low looks to have come down to the macro dealing range 0.5 OTE with a ~0.07% fill. Ideally after that, I wanted to see the August 5th Weekly candle wick get traded into, in-which, we did see that happen. So macro, we are still looking good, sub structure on the other hand is still bearish until price trades over $70,040. In the meantime, I think we get one lest sweep for trailing stops before we start the expansive leg that takes us out of this 6 month range. October is normally a bullish month, and we have spent the first week distributing to the downside (which is great, because now we have printed the monthly low). So yeah, remember to be patient, and execute if the opportunity comes. Should be a fun Q4.
InvrsROBINHOOD
$Bitcoin | Bearish Idea

If 64.5k does not get displaced over, this high may act as a macro inducement high before we more higher. The move down would conclude a third touchpoint on a trend line you can see below. The 3rd or 4th time testing a trend line, it normally breaks and purges sell-side liquidity before reversing back up to leave everyone offside. I hope to see turbo upside by the morning, if not, this is plan b.This idea played out nicely (:
InvrsROBINHOOD
September #Bitcoin idea

Engineer more trend line liquidity while build relative equal lows (inducement lows) then the real sweep comes in around the CPI announcement - mid month? - Then start Uptober
InvrsROBINHOOD
This price action kind of reminds me of the 2018 bear market low

This structure kind of looks similar in a way with how they structured this V-Bottom, then I looked at what it prints, and it generally follows along with what I think minus the extravagant price targets. But if it aligns with what you think, this might be an interesting watch over the next few months. But most fractals fail..
InvrsROBINHOOD
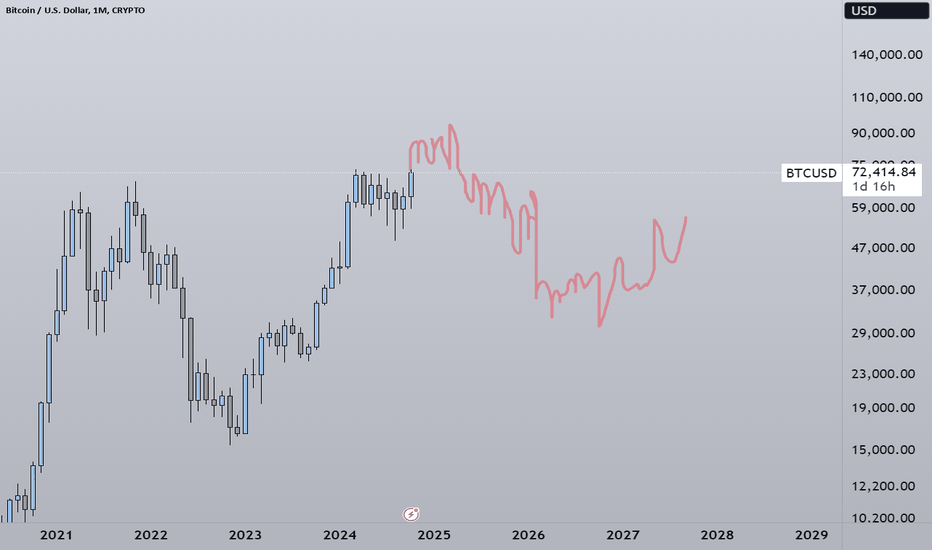
Redacted Guess for BTC

Decided to try and free hand how I think price will deliver over the coming year(s). Just for fun (:
InvrsROBINHOOD
$BTC | Double Bottom Pattern

It looks as if BTC has found its bottom and has formed a double bottom formation with a HL to confirm bullish trend. I don't think this counts as a Adam & Eve formation, I think the 'V' formation comes first before the rounded bottom (Perhaps someone can correct me if I'm wrong?). None the less, conservative target (Based on candle bodies) is 55k! Should be a nice beginning to March (:
InvrsROBINHOOD
$BTC | Flipping Resistance For Support

Bitcoins price action looks to be retesting the $42,000 level that has acted as support and resistance in the past. I expect us to bounce here and have continuation to the upside.
Disclaimer
Any content and materials included in Sahmeto's website and official communication channels are a compilation of personal opinions and analyses and are not binding. They do not constitute any recommendation for buying, selling, entering or exiting the stock market and cryptocurrency market. Also, all news and analyses included in the website and channels are merely republished information from official and unofficial domestic and foreign sources, and it is obvious that users of the said content are responsible for following up and ensuring the authenticity and accuracy of the materials. Therefore, while disclaiming responsibility, it is declared that the responsibility for any decision-making, action, and potential profit and loss in the capital market and cryptocurrency market lies with the trader.