
Investroy
@t_Investroy

What symbols does the trader recommend buying?
Purchase History
پیام های تریدر
Filter
Investroy
Technical Analysis is NOT What the Majority Thinks It Is
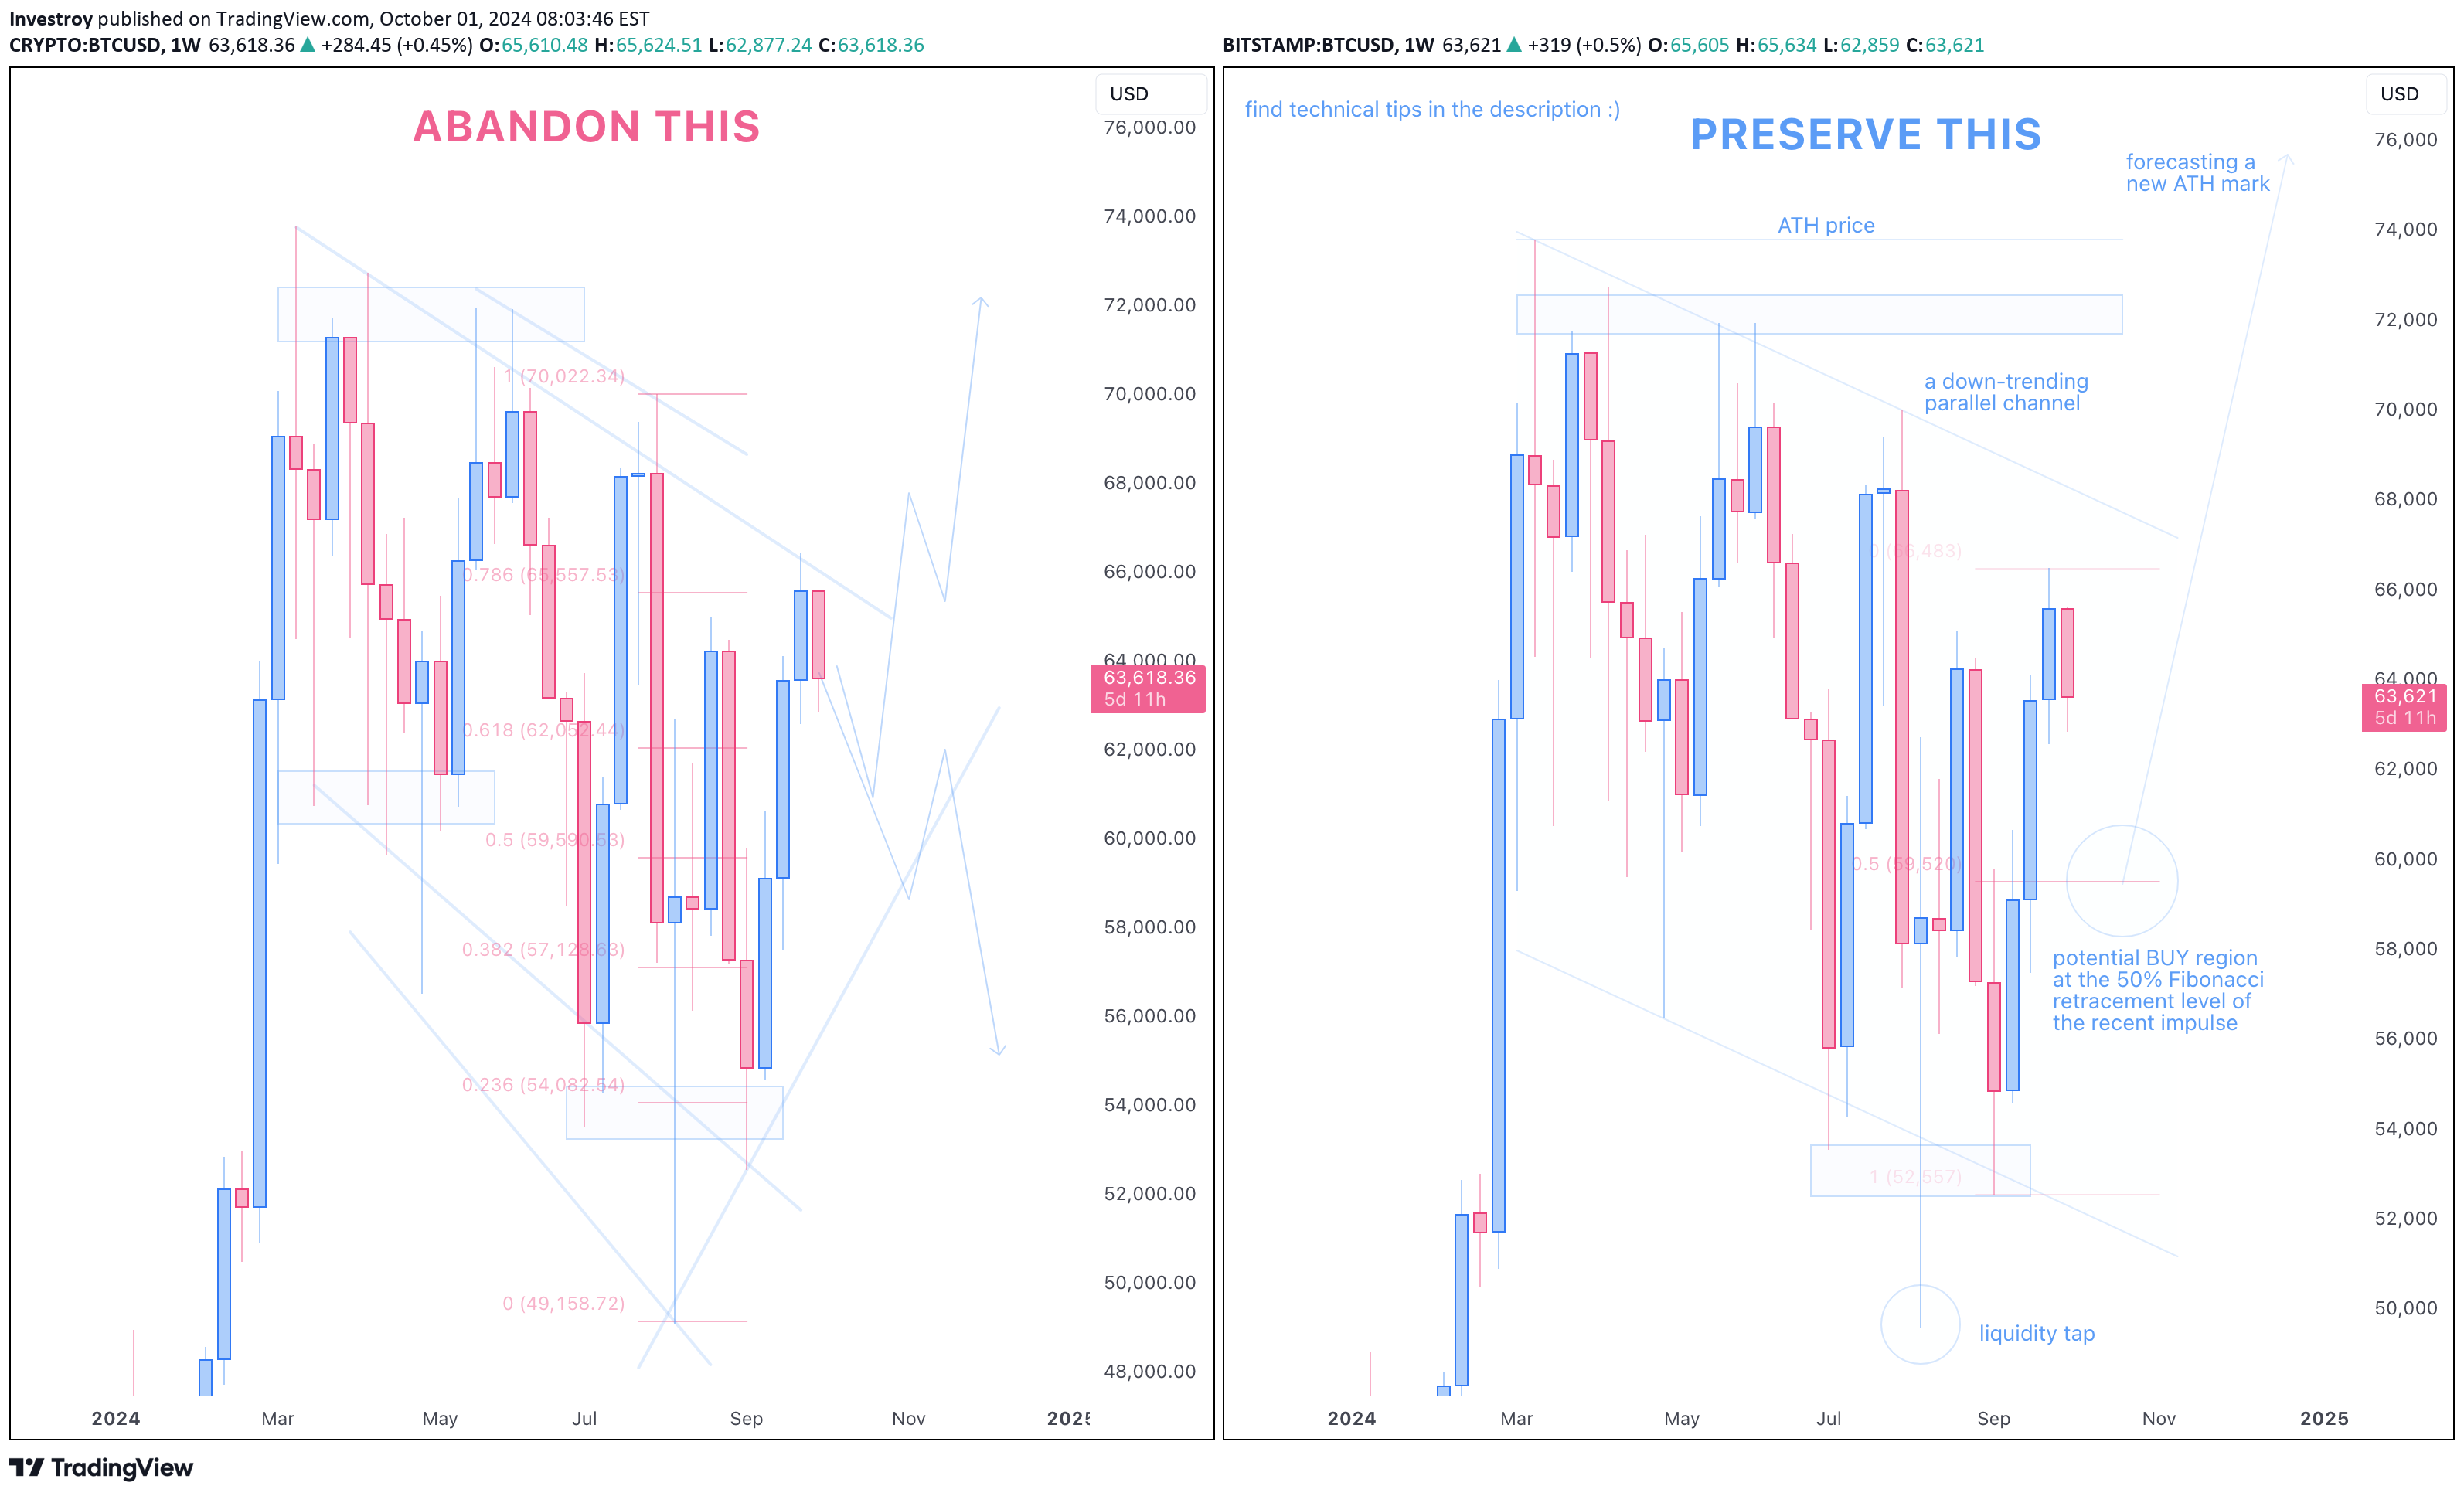
One of my favourite activities during my free time is sitting on the sofa and finding analyses on TradingView that resemble the one portrayed on the left-hand side of the illustration. My goal is to try deciphering what a given author is trying to convey to us, the audience. As you know, the more noise there is on the charts, the blurrier the picture becomes. The blurrier the picture, the more there is room for curiosity and discovery. Over the years, I’ve become more convinced that less is more and that you don’t need to clutter your charts with an abundance of instruments while conducting a technical orchestration. In fact, most people have false expectations regarding how proper technical analysis should be conducted. Many think TA is all about lines and boxes when, in reality, it’s about understanding price behaviour and making educated guesses with pre-calculated risk. Therefore, the aim of this brief educational article is to contrast two types of traders – let’s call them Average Joe and Experienced Joe – and provide professional insights into how technical analysis really functions and should be practiced. Let’s start by scrutinising the scenario on the left. The author has identified some critical regions, drawn a few lines, and highlighted a Fibonacci retracement level of importance. Then, they sketched a game plan using arrows to indicate how the price might behave next. What’s wrong with this approach? In short, everything. The longer answer: there’s a lack of necessary technical interpretation combined with unnecessary efforts. Although some analytical tools are present, they don’t offer any depth in terms of what the price behaviour might be orchestrating. Nor do most of these instruments serve any purpose when applied in a scattered manner. Now, let’s analyse what Experienced Joe – the trader behind the right-hand side of the screen – has put together. He has identified key regions and utilised a few tools for mapping purposes. However, his primary focus is understanding price behaviour by interpreting movements on the weekly-timeframe chart. Since he has traded the same handful of financial securities for years, he is experienced in reading charts like a book and grasping the logic behind price action. After understanding what’s unfolding, the trader finalises his game plan and executes positions. Comparing the two traders, we can see a significant difference between using technical instruments in abundance without comprehension, and using them in moderation with the real goal of understanding price behaviour. With that said, here is a 3-step guide on how to properly utilise technical analysis when studying a financial instrument and entering trade positions: Step #1 - Read the chart like a book. Where is the price potentially headed? What has been happening recently? What economic event caused the massive candle spike? Does it look like the price is correcting a recent impulse? Take a glance at the graph and try to understand the overall situation. Step #2 - Highlight key zones and sketch a game plan. This is a crucial level that the price has respected for a significant amount of time. Here, the price printed a liquidity grab, so I’ll mark that. The price is forming a reversal bottom, so I’m preparing to go long from here. The 0.84 region looks like a solid initial target. Sketch a preliminary game plan based on your analysis and focus on execution. Step #3 - Execute a trade position at pre-calculated risk (usually, 1-2%). Set your entry. Place your Stop Loss. Execute the trade. In conclusion, technical analysis is not just about drawing some lines and shapes. It’s time to change the stereotype and emphasise the real utility of technical analysis. After all, trading without trying to understand price dynamics—especially if you are a technical trader—is like blindly memorising driving rules without understanding their purpose. Of course, there’s no secret recipe that works 100% of the time, including technical analysis. However, by sticking to a consistent approach and being patient, we can aim toward achieving long-term profitability.
Investroy
The Crucial Nature of Risk Management | Risk-Reward > Win Rate
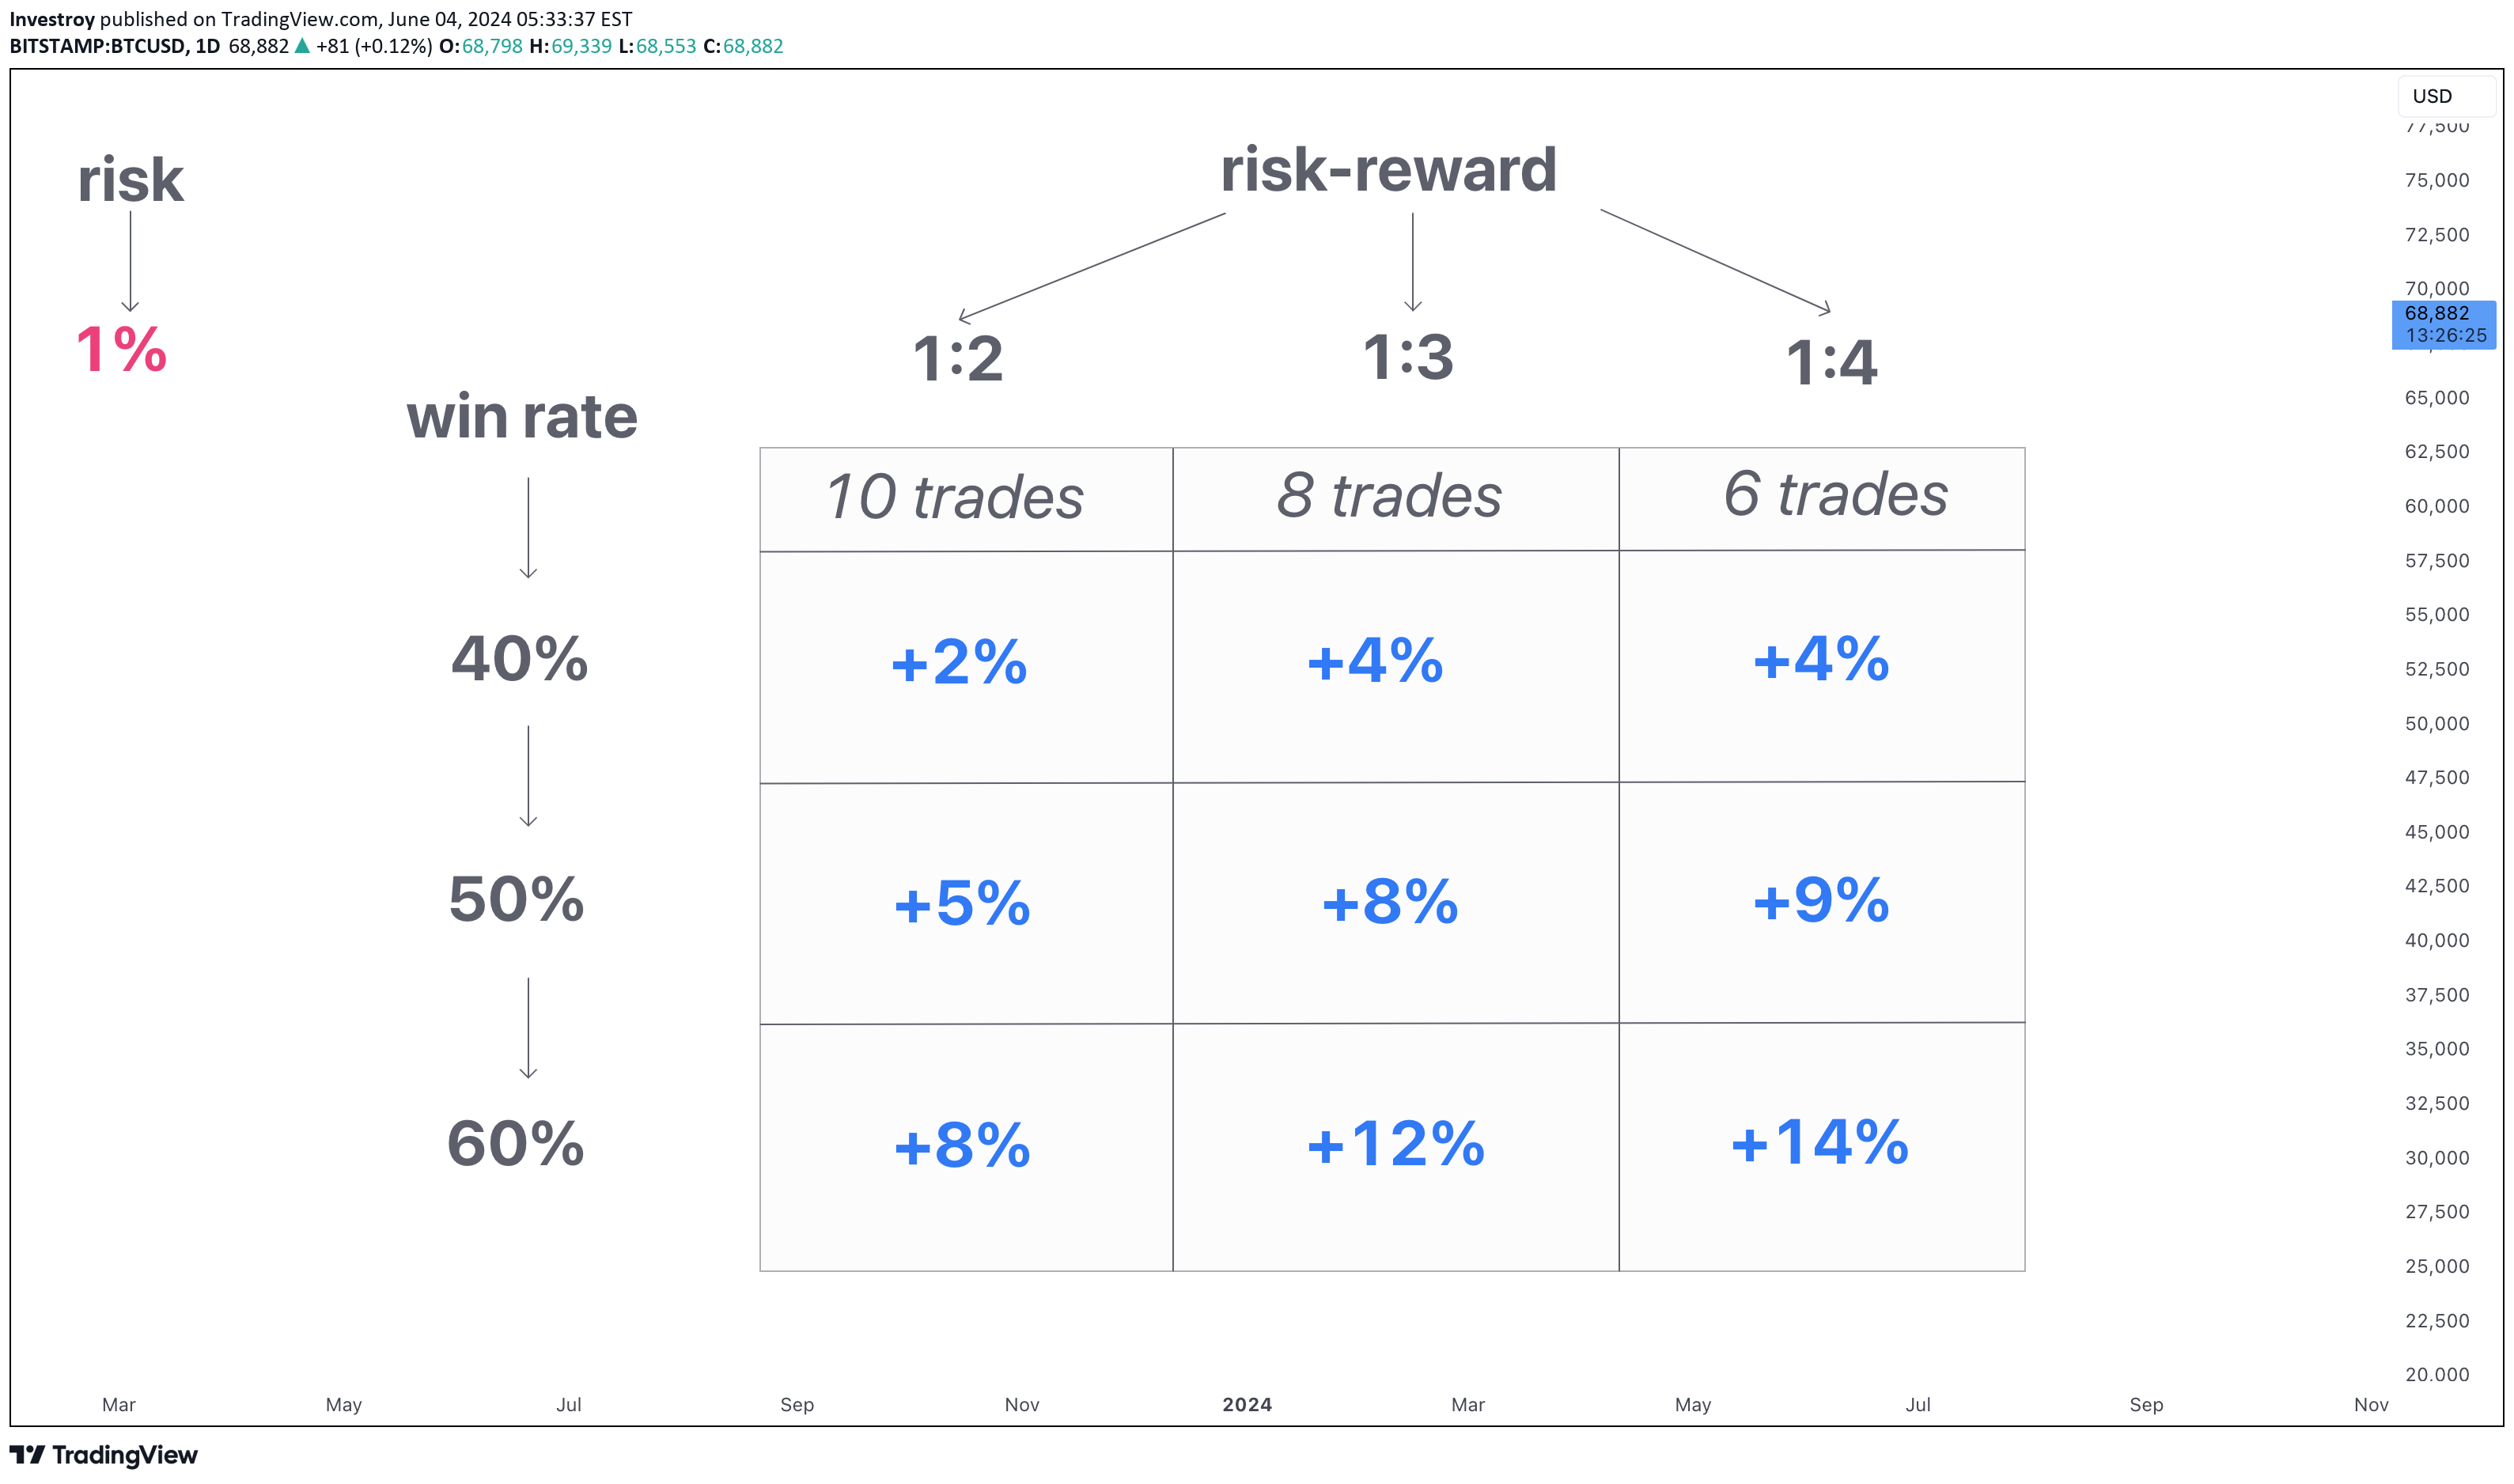
Within financial markets, the crucial thing to bear in mind is the need for reliance on proper risk management, and the prioritisation of the 'risk-reward' mechanism over the notion of 'win rate'. By risking only 1% of our total trading capital per trade and refraining from putting all eggs in the same basket, we are retaining consistent profitability in the long run through the law of big numbers and with the aid of the 'risk-reward' principle. As it could be inferred from the illustration, by risking only 1% of the total capital per trade, with an average of 1:3 risk-reward and a win rate of 40%, it is possible to generate a return of +4% by executing eight trade positions only.
Investroy
BTC/USD (bitcoin): the multi-timeframe outlook

Initially, looking at the Weekly timeframe chart, it could be noted that the price has been unable to continue pushing in the upside destination for more than 2 weeks now. Leaving huge wick candles in the upward direction, the market structure is making it relatively evident that bearish waves could kick in and drive the price towards the target region mapped on the graph. Zooming into the Daily-timeframe graph, we may witness some sort of a triangle pattern formulation. With the upward slope getting steeper after every touch, there is a big chance that the lower barrier will get penetrated and the price will keep pushing in the downside destination towards the pre-projected target region. Thus, we have orchestrated a preliminary trade idea with the Stop Loss set above the upper barrier of the formed triangle and the target placed at the Weekly-timeframe key region. Making an execution at the market price, we are aiming towards capturing a steady 1:3 risk-reward trade.
Investroy
ETHEREUM (ETH/USD): a potential correctional move is inbound

Just like the textbook states, an impulse is followed by a correction. Examining the recent build-up, we might infer that the price has been soaring in the upside direction after having broken out of the descending trend-line mapped on the graph. At the moment, however, we are witnessing obvious signs of a potential bearish reversal and, if bearish moves kick in, we might expect for the price to impulse in the destination of the $3,4k level, that lines up with the 50% Fibonacci retracement level as identified by connecting the start and the finish of the recent impulse.
Investroy
GOLD (XAU/USD): what does the MTF view orchestrate?

Initially, taking a look at the Monthly-timeframe development, it could be noted that the price is printing huge wick candles, which emphasises the inability to continue pushing in the upside destination. Identifying all crucial key zones and levels of decision, we may point out the importance of the 2.07 key region, the borders of which could be visited in the upcoming middle to long run if our game-plan plays out as desired. Zooming into the Weekly-timeframe chart to locate probable entry areas, the right shoulder zone of the currently forming Head&Shoulders pattern could be held under the radar. If the price manages to bounce off the neckline highlighted on the graph and reach the right shoulder zone as orchestrated, we might look into taking short positions and aim for the 2.07 destination in the upcoming long run.
Investroy
The Art of Trading: Parallel Between Master Artists and Traders
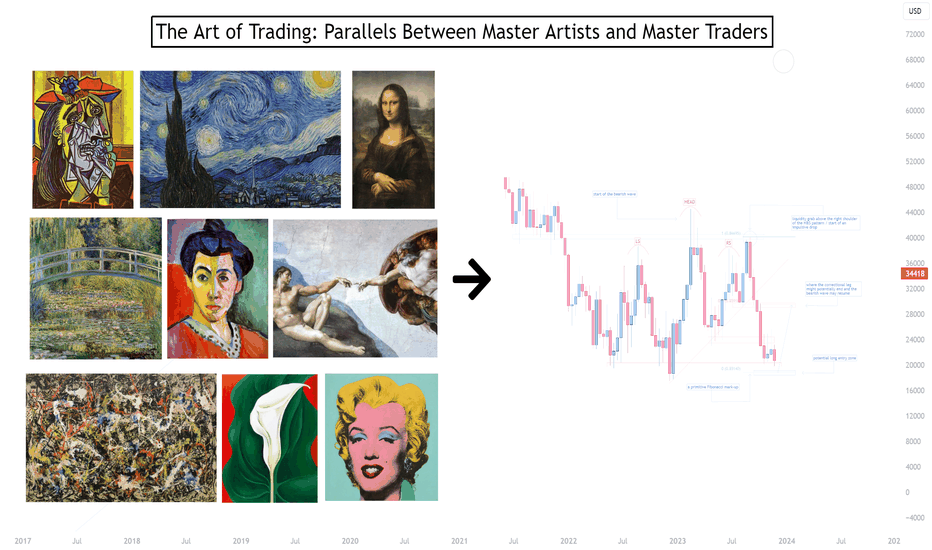
The world of trading, much like the realm of art, is filled with uncertainty, complexity, and the need for creativity. Both traders and artists embark on journeys of discovery, seeking to master their crafts and find a unique approach in their respective fields. Without further due, let’s delve into the fascinating parallels between the practices of famous artists and the strategies employed by successful traders, uncovering lessons that can be applied to excel in the volatile world of trading. 1.The Picasso Perspective: Pablo Picasso, a pioneer of modern art, was never afraid to take risks and break away from conventional artistic norms. His innovative spirit led to the creation of Cubism, a radical departure from traditional art forms. Trading Lesson: Just as Picasso embraced risk to innovate in art, traders should cultivate a willingness to take calculated risks and explore unconventional strategies. The key is to manage risk effectively, ensuring that potential rewards justify the risks taken (we would strongly encourage 1% risk with risk/reward ratio of 1:3.5+). 2.The Van Gogh Paradox: Patience in the Midst of Turbulence Vincent van Gogh’s life and work exemplify the importance of patience and perseverance. Despite facing rejection and lack of recognition during his lifetime, Van Gogh continued to paint, ultimately leaving behind a legacy of masterpieces. Trading Lesson: We can learn from Van Gogh’s unwavering commitment to his art, understanding that success in trading often requires patience and resilience. Even in turbulent markets, maintaining a long-term perspective and sticking to one’s trading plan can lead to eventual success. Although it is pretty common to see backlash from family and friends, if you stick to your goals and passion, there is no doubt you can be the next Van Gogh of trading. 3.The Da Vinci Code: Leonardo da Vinci, a true Renaissance man, was known for his disciplined approach to art and his insatiable curiosity. He meticulously studied various subjects, from anatomy to aerodynamics, to enhance his artistic abilities. Trading Lesson: Traders can draw inspiration from Da Vinci’s disciplined nature and commitment to continuous learning. Staying informed about market trends, refining trading strategies, and maintaining discipline in executing trades are crucial for trading success. As cliché as it sounds, consistency is the key. Creating the trading plan is not that hard, sticking to it is what makes the real difference. 4.The Monet Method - The Beauty in Patterns and Trends: Claude Monet, a founding father of Impressionism, was renowned for his ability to capture the subtle nuances of light and color, often painting the same scene multiple times to depict different lighting conditions. Trading Lesson: Just as Monet focused on patterns and trends in his artwork, traders should develop a keen eye for recognizing market patterns and trends. Technical analysis can be a powerful tool in a trader’s arsenal, helping to predict future price movements based on historical patterns. 5.The Matisse Approach - Simplicity and Clarity: Henri Matisse was known for his use of bold colors and simple shapes, stripping away unnecessary details to focus on the essential elements of his compositions. Trading Lesson: In trading, simplicity can be a virtue. Traders can learn from Matisse’s approach by simplifying their trading strategies, focusing on key indicators, and avoiding unnecessary complexity. A clear and straightforward trading plan can lead to more consistent results. 6.The Michelangelo Mindset - Mastery Through Practice: Michelangelo, one of the greatest artists of all time, spent countless hours perfecting his craft, from sculpting masterpieces like David to painting the Sistine Chapel ceiling. Trading Lesson: Trading mastery, much like artistic mastery, requires extensive practice and dedication. Traders should commit to honing their skills, practicing their strategies, and learning from both successes and failures. The journey to trading excellence is a marathon, not a sprint. Try having small positive months in a row, instead of 1 month with +100% return and account blown right after. 7.The Pollock Principle - Embracing Uncertainty: Jackson Pollock, famous for his abstract expressionist drip paintings, embraced randomness and uncertainty in his creative process, allowing the paint to fall where it may. Trading Lesson: The financial markets are inherently uncertain, and traders must learn to embrace and navigate this uncertainty. Developing a robust risk management strategy and maintaining a balanced portfolio can help traders manage uncertainty and protect their capital. As you have probably heard from many other specialists: “Trading is the game of probability”. 8.The O’Keeffe Outlook - A Unique Perspective: Georgia O’Keeffe is celebrated for her distinctive style and her ability to see beauty in the simplest of forms, often magnifying flowers and other natural elements in her artwork. Trading Lesson: Developing a unique trading perspective can give traders an edge in the markets. Traders should strive to think independently, conduct their own analysis, and avoid getting swayed by the crowd. A unique and well-informed perspective can lead to more profitable trading decisions. There is nothing wrong with being inspired by a post made by a well-known TradingView author, but that shouldn’t prevail over your own common sense and judgement. 9.The Warhol Way: Capitalizing on Trends: Andy Warhol was a master of identifying and capitalizing on cultural trends, turning everyday objects like Campbell’s soup cans into iconic works of art. Trading Lesson: Identifying and capitalizing on market trends is a key skill for traders. By staying attuned to economic indicators, news events, and market sentiment, traders can position themselves to profit from prevailing trends. Just as Warhol transformed ordinary objects into valuable art, traders can turn market movements into trading opportunities. Don’t fight the trends, it’s a losing battle you don’t want to be a part of. In the fast-paced world of trading, the ability to adapt to changing market conditions is vital. Put the ego aside, if the trade is going against your initial plan, close it, reevaluate, and make proper adjustments. If you made it all the way here, we would like to thank you for taking the time and reading our write-up all the way and we hope you have a wonderful trading week ahead!
Investroy
BITCOIN(BTC/USD): targeting $13k - $14k as our next destination?

As it can be inferred from the Monthly timeframe graph, the price of Bitcoin has rejected the area of resistance located at the $30-31K price region that lines up with the 50% Fibonacci retracement level of the 04/2022 - 12/2022 bearish run. Hence, judging by the formation, we remain positive about the fact that the price might experience further drop and reach new low levels.
Investroy
Avoid getting trapped and hunted by market sharks!
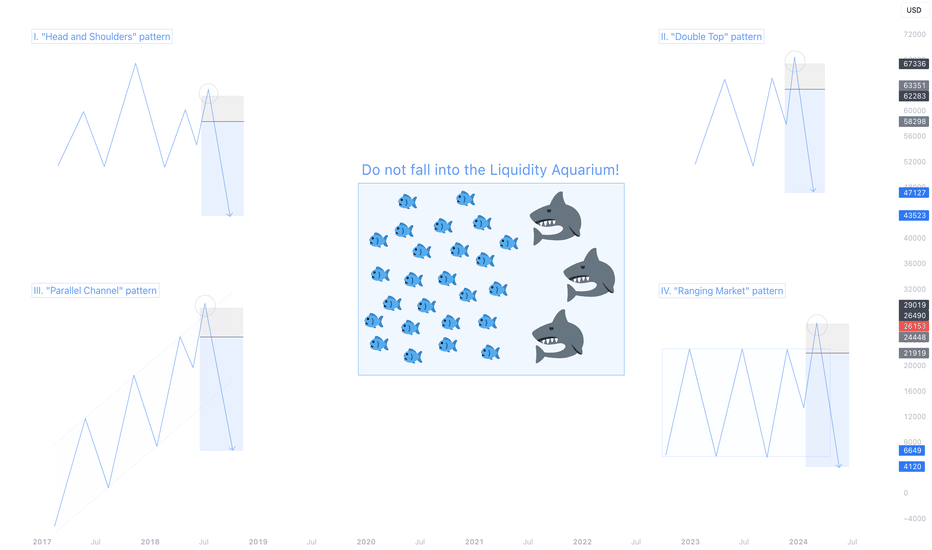
Stop Loss Hunt, Liquidity Sweep, Market Manipulation - all of these are fancy names of a highly frequent act performed by big sharks of the market to target the retailers. - "Oh, do you think they care about my 0.01 lot size?" Individually, not. In big volumes, yes. Textbook chart patterns that are so prominent to us are all subject to going through a liquidation phase. Hence, let's look at some graphical examples that will also be supported by real-market instances: 1) "Head&Shoulders" liquidation Upon forming a right shoulder and showing initial bearish moves, market participants tend to execute short positions and place their Stop Loss order above the freshly formed shoulder. In that case, there is a high probability that the price will get driven towards the Stop Loss pool, grab liquidity, then continue impulsing in the pre-determined destination. A live-market example: EUR/GBP Daily Timeframe (period: 28/06/2023 - 16/08/2023) 2) Double Top liquidation Similar to the previous point, upon forming two tops/heads/reversal points, the price shows some bearish moves and invites sellers to take action before we witness the price impulse towards the upside and grab liquidity where masses have set their Stop Loss levels before resuming its bearish moves A live-market example: USD/CHF Weekly Timeframe (period: 09/05/2022 - 07/11/2022) 3) Parallel Channel liquidation Trading within two boundaries of a parallel channel, oftentimes, we may witness how wick spikes are printed and liquidity is grabbed. A live-market example: USD/CHF Weekly Timeframe (period: 16/01/2023 - 21/08/2023) 4) Ranging Market liquidation Being stuck in a sideways-moving liquidation box, it is commonly evident how the price triggers the sea of retail Stop Loss orders to both sides of the rectangle with a sole purpose of taking out early entrants before moving in the pre-orchestrated destination. A live-market example: USD/CHF 8H Timeframe (period: 16/06/2023 - 10/07/2023) To put all in a nutshell, be careful in order to not fall into the Liquidity Aquarium.
Investroy
12 Habits of a Successful Trader
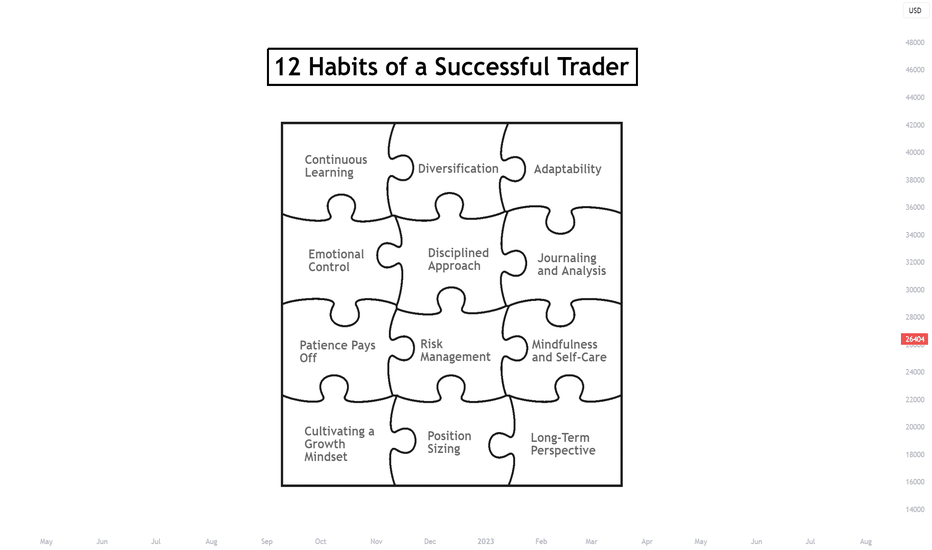
Hey, TradingView community! In this article we are going to go over 12 things that complete our trading style here at Investroy. Navigating in financial markets can be highly rewarding, but it also comes with its fair share of challenges and risks. Successful traders are not only armed with a deep understanding of market dynamics but also possess certain habits that contribute to their consistent success. Whether you're a novice or a seasoned trader, incorporating these habits into your trading routine can significantly enhance your chances of achieving your financial goals. Without further due, let's get started! 1. Continuous Learning: Successful traders are lifelong learners. They dedicate time to stay updated with the latest market trends, economic news, and trading strategies. They are open to learning from both their successes and failures, constantly refining their skills to adapt to changing market conditions. 2. Disciplined Approach: Discipline is the cornerstone of successful trading. Establishing a well-defined trading plan, setting clear entry and exit points, and adhering to them helps traders avoid emotional decisions driven by fear or greed. 3. Risk Management: Prudent risk management is non-negotiable for successful traders. They never risk more than a small percentage of their trading capital on a single trade. This approach safeguards their accounts from catastrophic losses and allows them to weather market fluctuations. 4. Patience Pays Off: Impulsive trading rarely leads to success. Successful traders exercise patience, waiting for high-probability trade setups that align with their strategy. This prevents them from overtrading and falling into traps set by the market's volatility. 5. Emotional Control: Controlling emotions like fear and greed is a critical habit. Successful traders remain level-headed, even in the face of unexpected market moves. They make decisions based on analysis and logic rather than succumbing to emotional impulses. 6. Adaptability: Markets are dynamic, and successful traders know how to adapt. They recognize that what works in one market condition might not work in another. Being flexible and open to adjusting their strategies helps them stay ahead of changing trends. 7. Journaling and Analysis: Keeping a trading journal is a habit embraced by top traders. They meticulously record their trades, including entry and exit points, reasoning, and outcomes. Regularly reviewing this journal helps them identify patterns, strengths, and weaknesses, facilitating continuous improvement. 8. Mindfulness and Self-Care: Trading can be stressful, and successful traders prioritize self-care. Engaging in activities like exercise, meditation, and spending quality time with loved ones helps them maintain a healthy work-life balance and reduces burnout. 9. Long-Term Perspective: Successful traders don't get discouraged by short-term setbacks. They have a long-term perspective and focus on consistent, incremental growth. This perspective helps them navigate through losses and keeps them motivated during winning streaks. 10. Cultivating a Growth Mindset: Successful traders embrace challenges as opportunities for growth. They see losses as lessons rather than failures and are always seeking ways to improve. This growth mindset helps them adapt to changing markets and fosters resilience in the face of setbacks. 11. Diversification: Top traders don't put all their eggs in one basket. They diversify their portfolio across different assets and industries, reducing the impact of a single market's volatility on their overall capital. 12. Position Sizing: Successful traders adjust their position sizes according to market conditions. During high volatility, they reduce their position sizes to manage risk, while during calmer periods, they may increase exposure (within 1-2% obviously). Becoming a successful trader requires more than just understanding market mechanics. It's about cultivating the right habits that promote discipline, continuous learning, and emotional resilience. By incorporating these 12 habits into your trading routine, you'll be better equipped to navigate the complex world of trading and increase your chances of achieving your financial goals.
Investroy
BTC/USD: zone-to-zone trading. Are the bulls ready?

BTC/USD: zone-to-zone trading. Are the bulls ready? Looking at the DAILY-timeframe graph, we might observe that the price has yet again bounced off the ascending trend-line that is portrayed on the graph (impulse that started on 15/06). At the moment, we are sitting at a crucial area of resistance and some sort of a "Top Reversal" pattern can be identified. As our bias remains bullish, we are looking into entering long positions at an appropriate level and riding the probably upcoming bullish wave. The "appropriate level" that we have our eyes on is set at the $28k region that corresponds with the 50% Fibonacci retracement level of the recent bullish impulse. Once the price reaches the highlighted level, we will look for our entry criteria to be met (formation of a bottom reversal, wick rejections etc.) before entering long positions and aiming for the upside.
Disclaimer
Any content and materials included in Sahmeto's website and official communication channels are a compilation of personal opinions and analyses and are not binding. They do not constitute any recommendation for buying, selling, entering or exiting the stock market and cryptocurrency market. Also, all news and analyses included in the website and channels are merely republished information from official and unofficial domestic and foreign sources, and it is obvious that users of the said content are responsible for following up and ensuring the authenticity and accuracy of the materials. Therefore, while disclaiming responsibility, it is declared that the responsibility for any decision-making, action, and potential profit and loss in the capital market and cryptocurrency market lies with the trader.