
ImmaculateTony
@t_ImmaculateTony

What symbols does the trader recommend buying?
Purchase History
پیام های تریدر
Filter
ImmaculateTony
تحلیل تکنیکال سولانا: قیمت در منطقه تخفیف (Wholesale Zone) چه میگوید؟
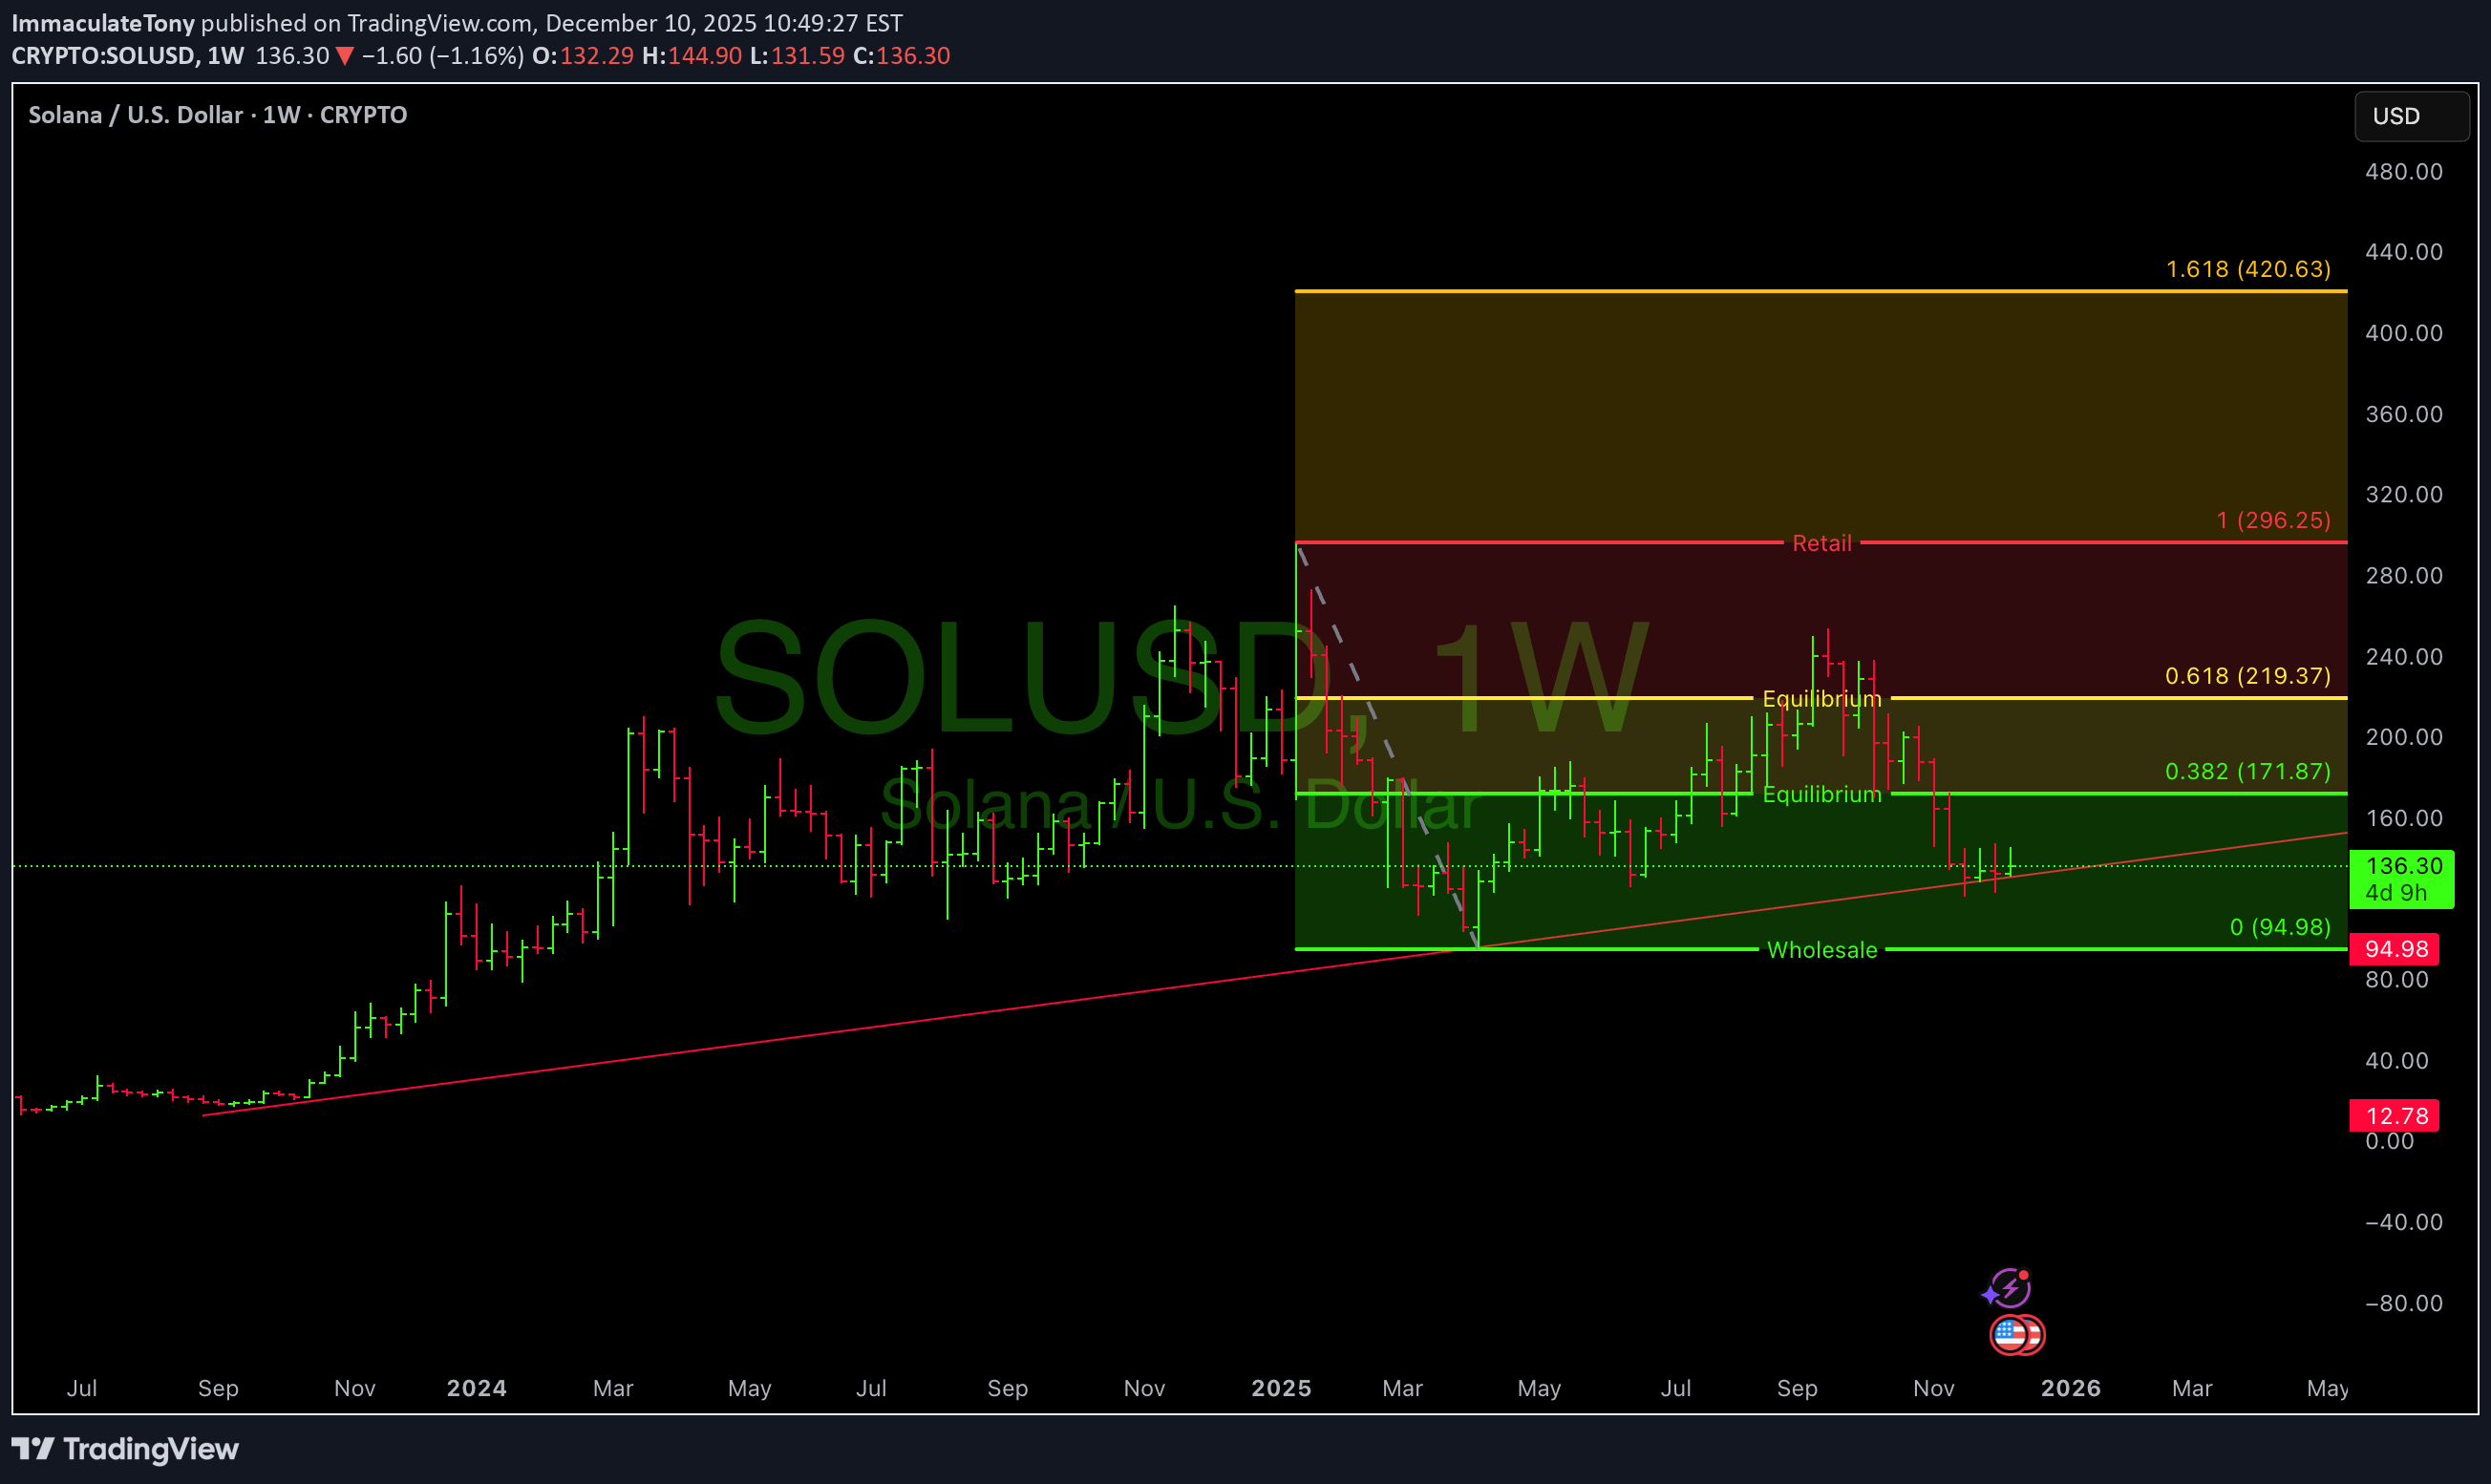
A **Fibonacci retracement** from ~95 (0 level) to ~296 (1.0 level). The major levels highlighted: 0.382 ≈ 171.87 0.618 ≈ 219.37 1.0 ≈ 296.25 1.618 ≈ 420.63 Price currently around 135–136 Region coloring: Wholesale zone** (green, ~95–140) Equilibrium zone** (yellow/green, ~170–220) Retail zone** (red, ~296+) The dotted trendline beneath price suggests long-term support rising over time. 🧠 What This Chart Appears to Communicate (Educational Interpretation) 1. **Price is currently in the “Wholesale” or Discount Zone Visually, this means: According to the chart’s structure, this is the lower end of the recent multi-year range. This part of the chart is often interpreted as the “accumulation” region. This is NOT advice, just a description of how the chart is labeled. Equilibrium Levels Above Price (171–220 Zone) These levels are often seen as: Areas where previous sellers and buyers met Places where price consolidates before choosing direction 3. Retail Zone (296+) This is where: Prior highs exist Buyers in that zone historically may have been late Higher risk of reversal historically in charts marked this way Again, not advice, just technical labeling. 4. The 1.618 extension (≈420) marks the aggressive upside target This is a classic Fib extension often referenced in trend-continuation models. 💡 Neutral, Educational “Trade Idea Structure” Based on the Chart 🟩 Scenario A: Range Reversion Toward Equilibrium (Educational) If price stays above the rising trendline near ~130: Hypothetical target zones: First structural zone: **0.382 (~171.87)** Secondary zone: **0.618 (~219.37)** Reasoning (educational only): Price often revisits equilibrium after spending time in deep discount zones. 🟧 Scenario B: Midrange to High-End Rotation (Hypothetical) If price breaks above ~220 and holds weekly structure: Targets shown on chart: 1.0 Fib (~296) 1.618 extension (~420) This represents a trend-continuation idea. 🟥 Scenario C: Breakdown of Wholesale Zone If the weekly structure fails and price falls below ~95: Risk zone technically identified: Price could revisit prior demand zones not shown on this chart. This is what invalidation could look like from a purely chart-structural perspective. Observations (No prediction) Solana's weekly structure has made *higher lows since Oct/Nov*, which can indicate strengthening relative structure. Price is currently sitting on trendline-like support. The 171–220 band is a major pivot region visible on the chart.
ImmaculateTony
بیت کوین روی خط حمایت تاریخی: آیا جهش بزرگ بعدی آغاز شده است؟ (اهداف تا ۱۵۰ هزار دلار)
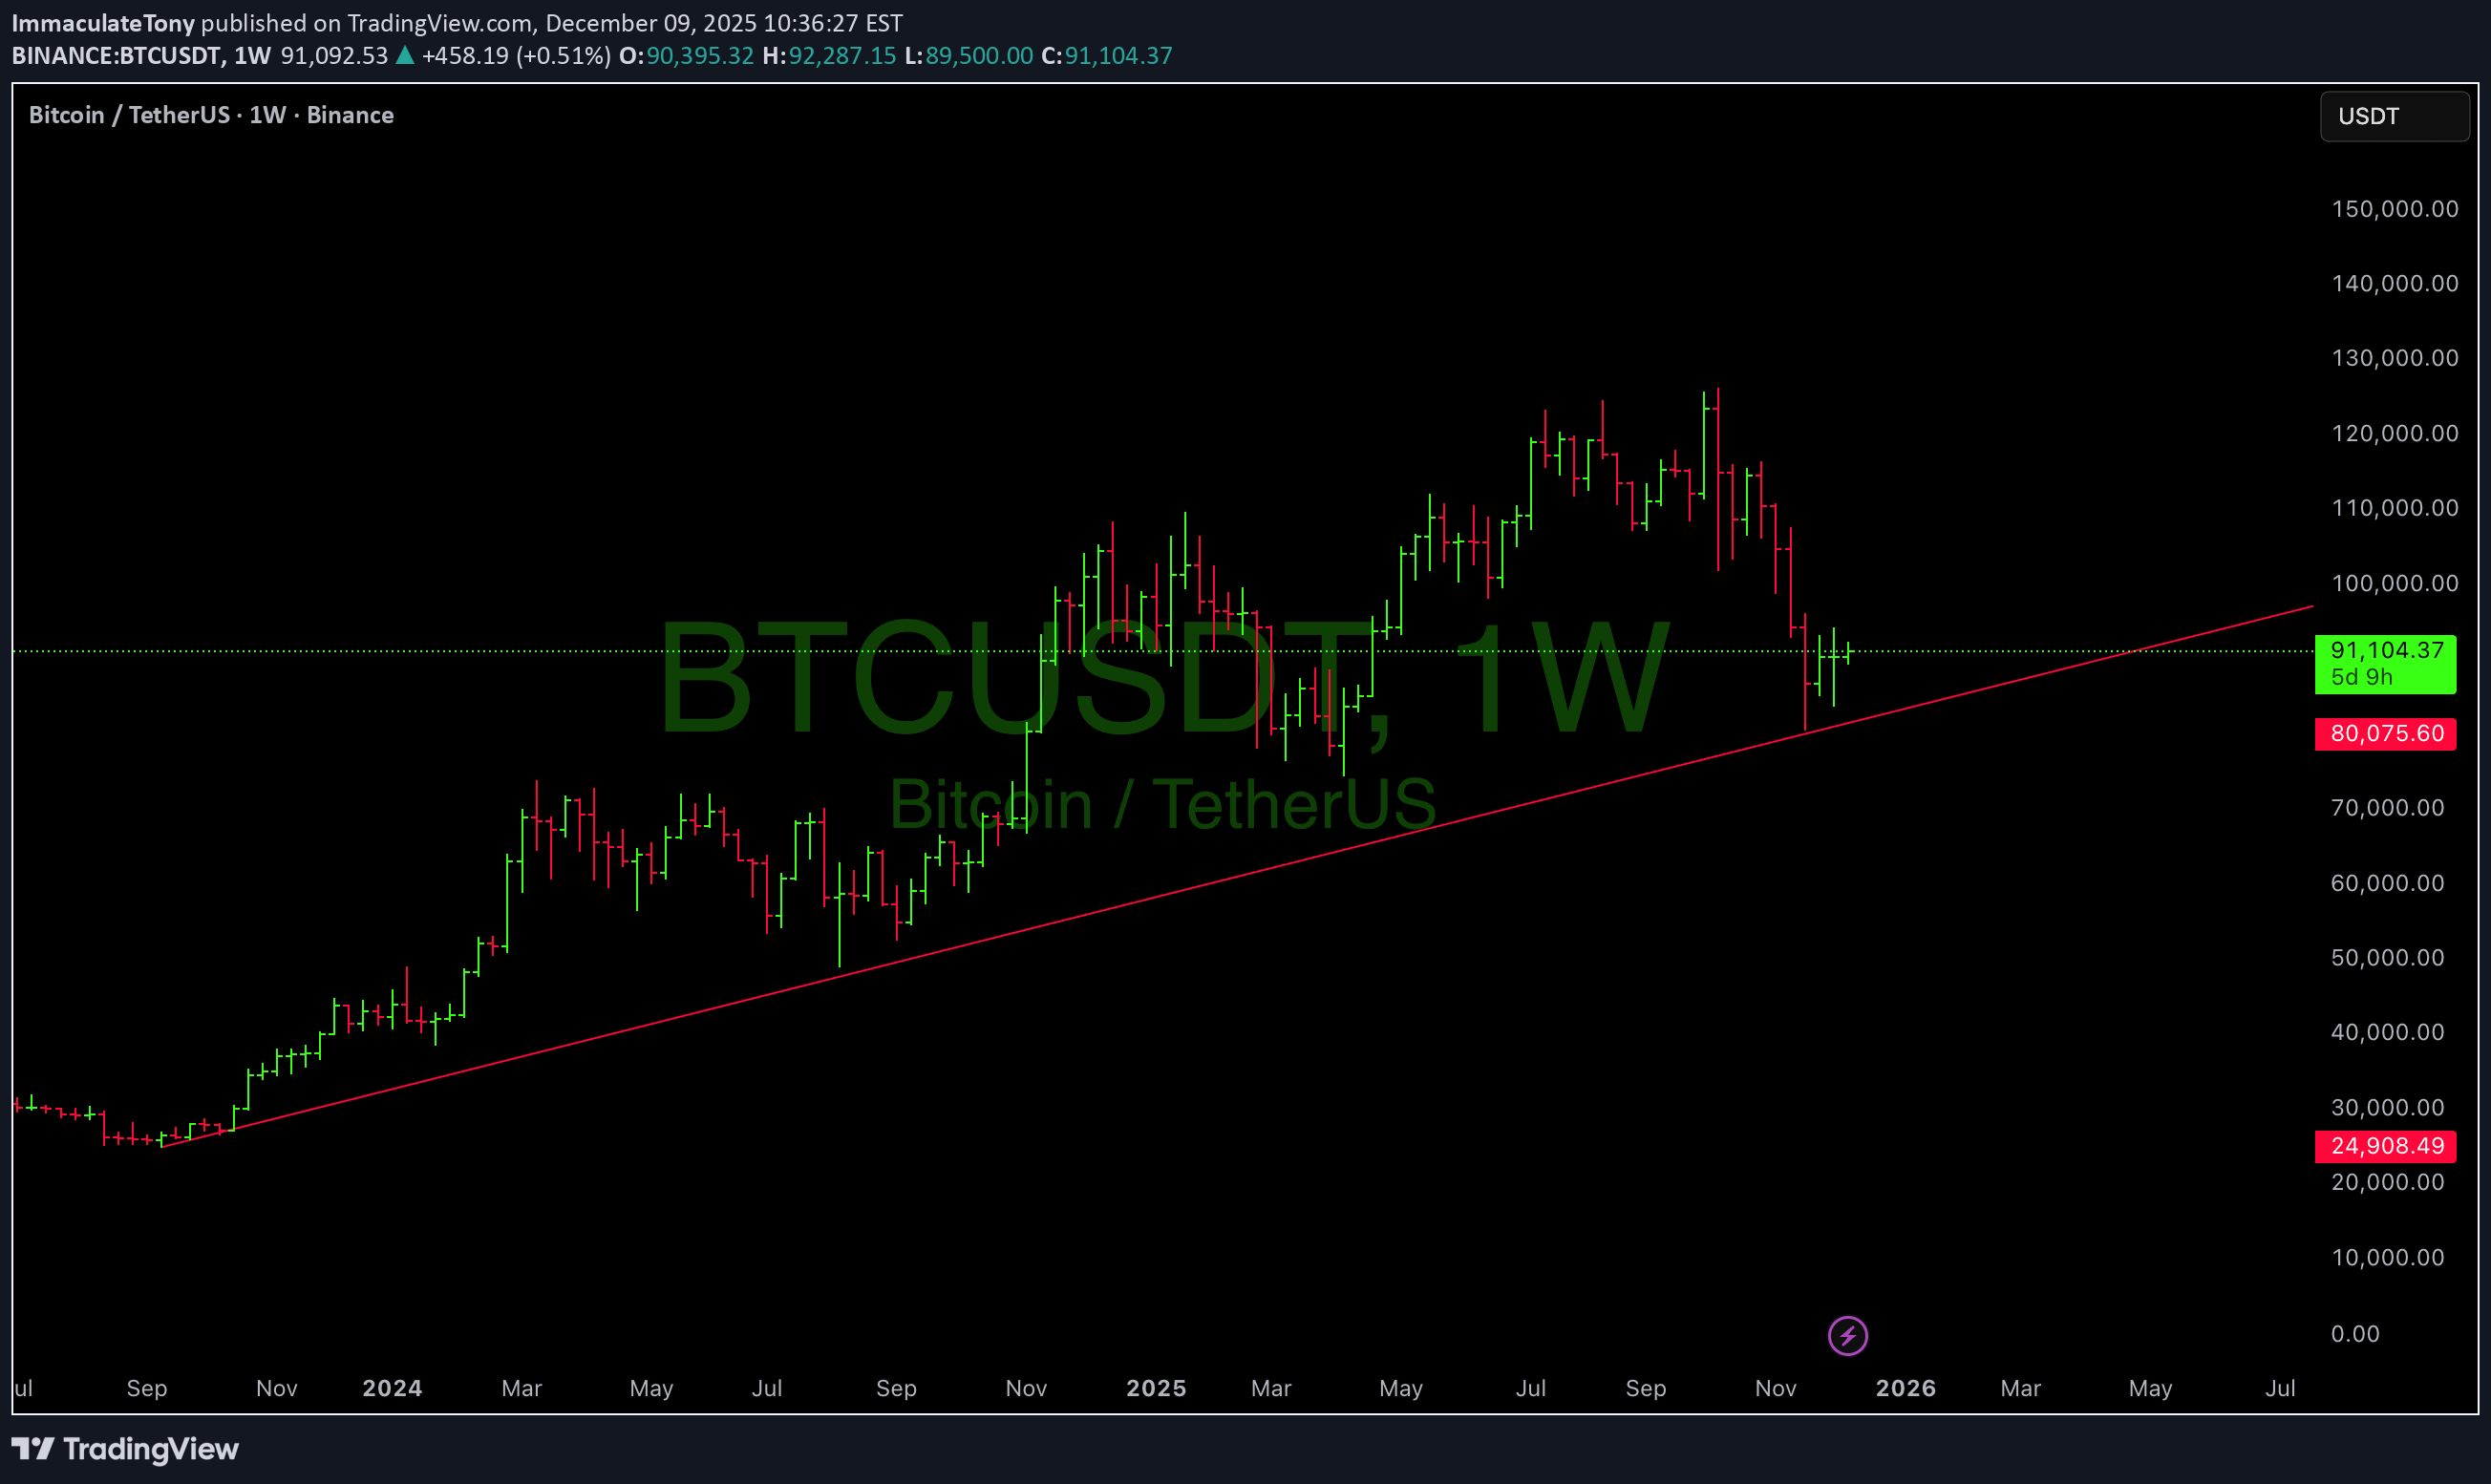
Bitcoin just completed a clean retest of its multi-year rising trendline, a structural level that has guided institutional accumulation since 2023. Price wicked below, tagged liquidity, and closed back above a classic bullish deviation → reclaim. This type of structure historically marks the end of corrective phases and the beginning of new expansions. 📌 Key Bullish Factors 1. Long-Term Trendline Respect Your chart shows a trendline starting from late 2023. Price tapped it perfectly and is now holding above $80,000–$82,000, confirming: Buyers stepped in where they were supposed to Smart money defended the bullish structure Heavy liquidation likely cleared weak longs 2. Weekly Candle Structure Turning The last 2–3 weekly candles show: Downward momentum slowing Smaller bodies Long wicks → buying from lower levels A potential swing low forming at the trendline Bitcoin is showing the early signs of seller exhaustion you typically see before a weekly reversal. --- 👉 The move tends to trap sellers before a strong leg up. --- 📈 Upside Targets (Weekly) If BTC continues holding above trendline: 1. $98,000 – $102,000 → First major liquidity pocket / inefficiency 2. $112,000 – $120,000 → Prior breakdown zone + weekly imbalance 3. $135,000 – $150,000 → Trend extension target / potential new ATH expansion These are not promises they are structural destinations based on the weekly map. --- ## **🔻 Downside Invalidation** The bullish thesis remains valid as long as Bitcoin doesn’t close a weekly candle below $80,000. Break + close below would open deeper retracement into mid-70Ks. But right now? The trendline holds strong. --- 🧠 Holistic Trader Insight Institutional players accumulate on weakness, not strength. When retail panics, smart money buys structure. This entire move fits the textbook rules: Trend intact Liquidity swept Structural level reclaimed Momentum slowing into support This is what early expansion phases look like.
ImmaculateTony
رمز ارز CELO: نقطه انباشت دو ساله و اهداف نجومی برای جهش بزرگ!
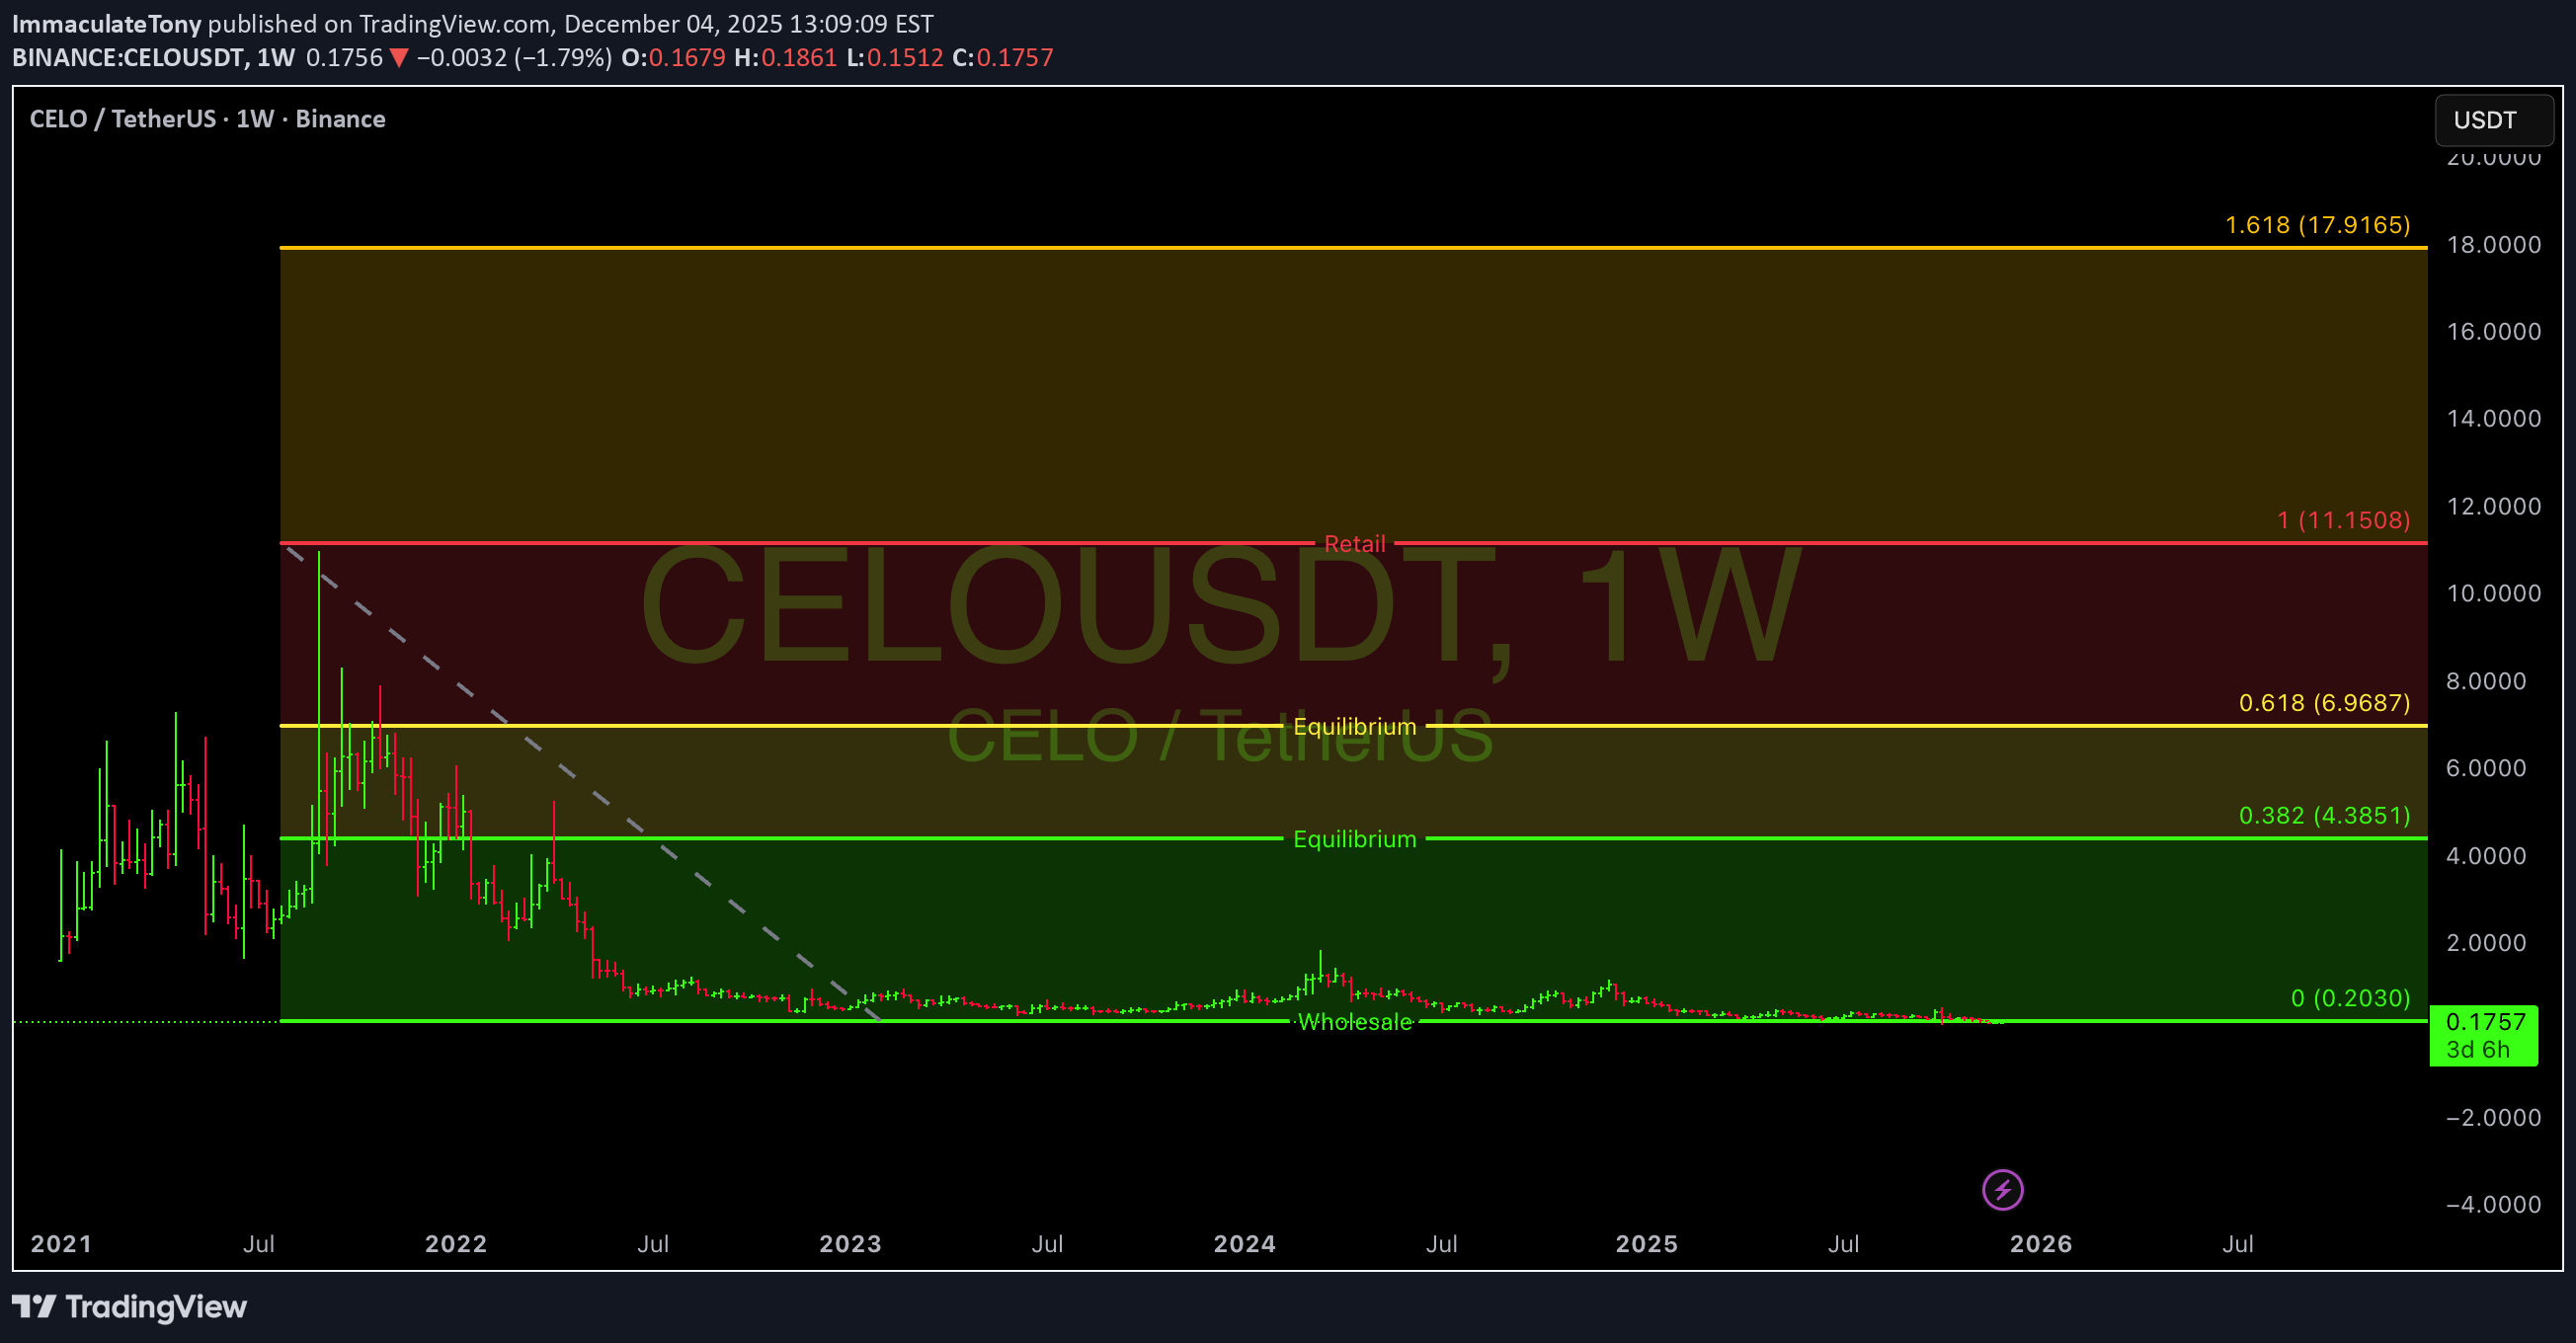
CELO/USDT – Accumulation Base + Multi-Target Upside My Favorite Speculation Crypto... Life Changer Thesis: Celo offers real-world financial access with mobile-first crypto UX, low fees, and stablecoin remittance tools. If mass adoption resumes or alt-season returns, CELO is structurally positioned for asymmetric upside. "Banking the unbanked... or quietly accumulating moonshots?" **Chart Type:** Weekly (1W) **Exchange:** Binance **Current Price:** $0.176 (as of Dec 4, 2025) --- **Wholesale Zone (Accumulation Base)** * Range: $0.15–$0.33 * Price has ranged sideways for nearly 2 years. * Smart money may be accumulating “base-building” pattern. * Historical demand zone (buyers keep stepping in here). **Equilibrium Levels (Potential Swing Targets)** These are Fibonacci retracement levels from the macro swing high to low. * 0.382 = $4.3851 * 0.618 = $6.9687 These are logical mid-cycle targets if CELO breaks out of the base. Price often reacts strongly to 0.382–0.618 zones in crypto cycles. **Retail Zone / Full Retracement** * 1.0 Fib = $11.1508 * Heavy supply and potential retail exit zone. * Unrealistic near-term but viable in full bull run extensions. --- **1.618 Extension = $17.9165** * Blue-sky breakout level * Would represent full euphoric move * 90–100x from current levels (only for long-term vision or micro-cap speculators) --- **Key Levels** | Zone | Price | Action | | Base Support | $0.15–$0.33 | Accumulation | | First Target | $4.38 | Mid-Cycle Resistance | | Next Target | $6.97 | Strong Resistance | | Final Target | $11.15–$17.91 | Speculative Extension |
ImmaculateTony
تحلیل TAO: پایان روند نزولی هفتگی و مسیر صعودی احتمالی به سمت 1000 دلار!
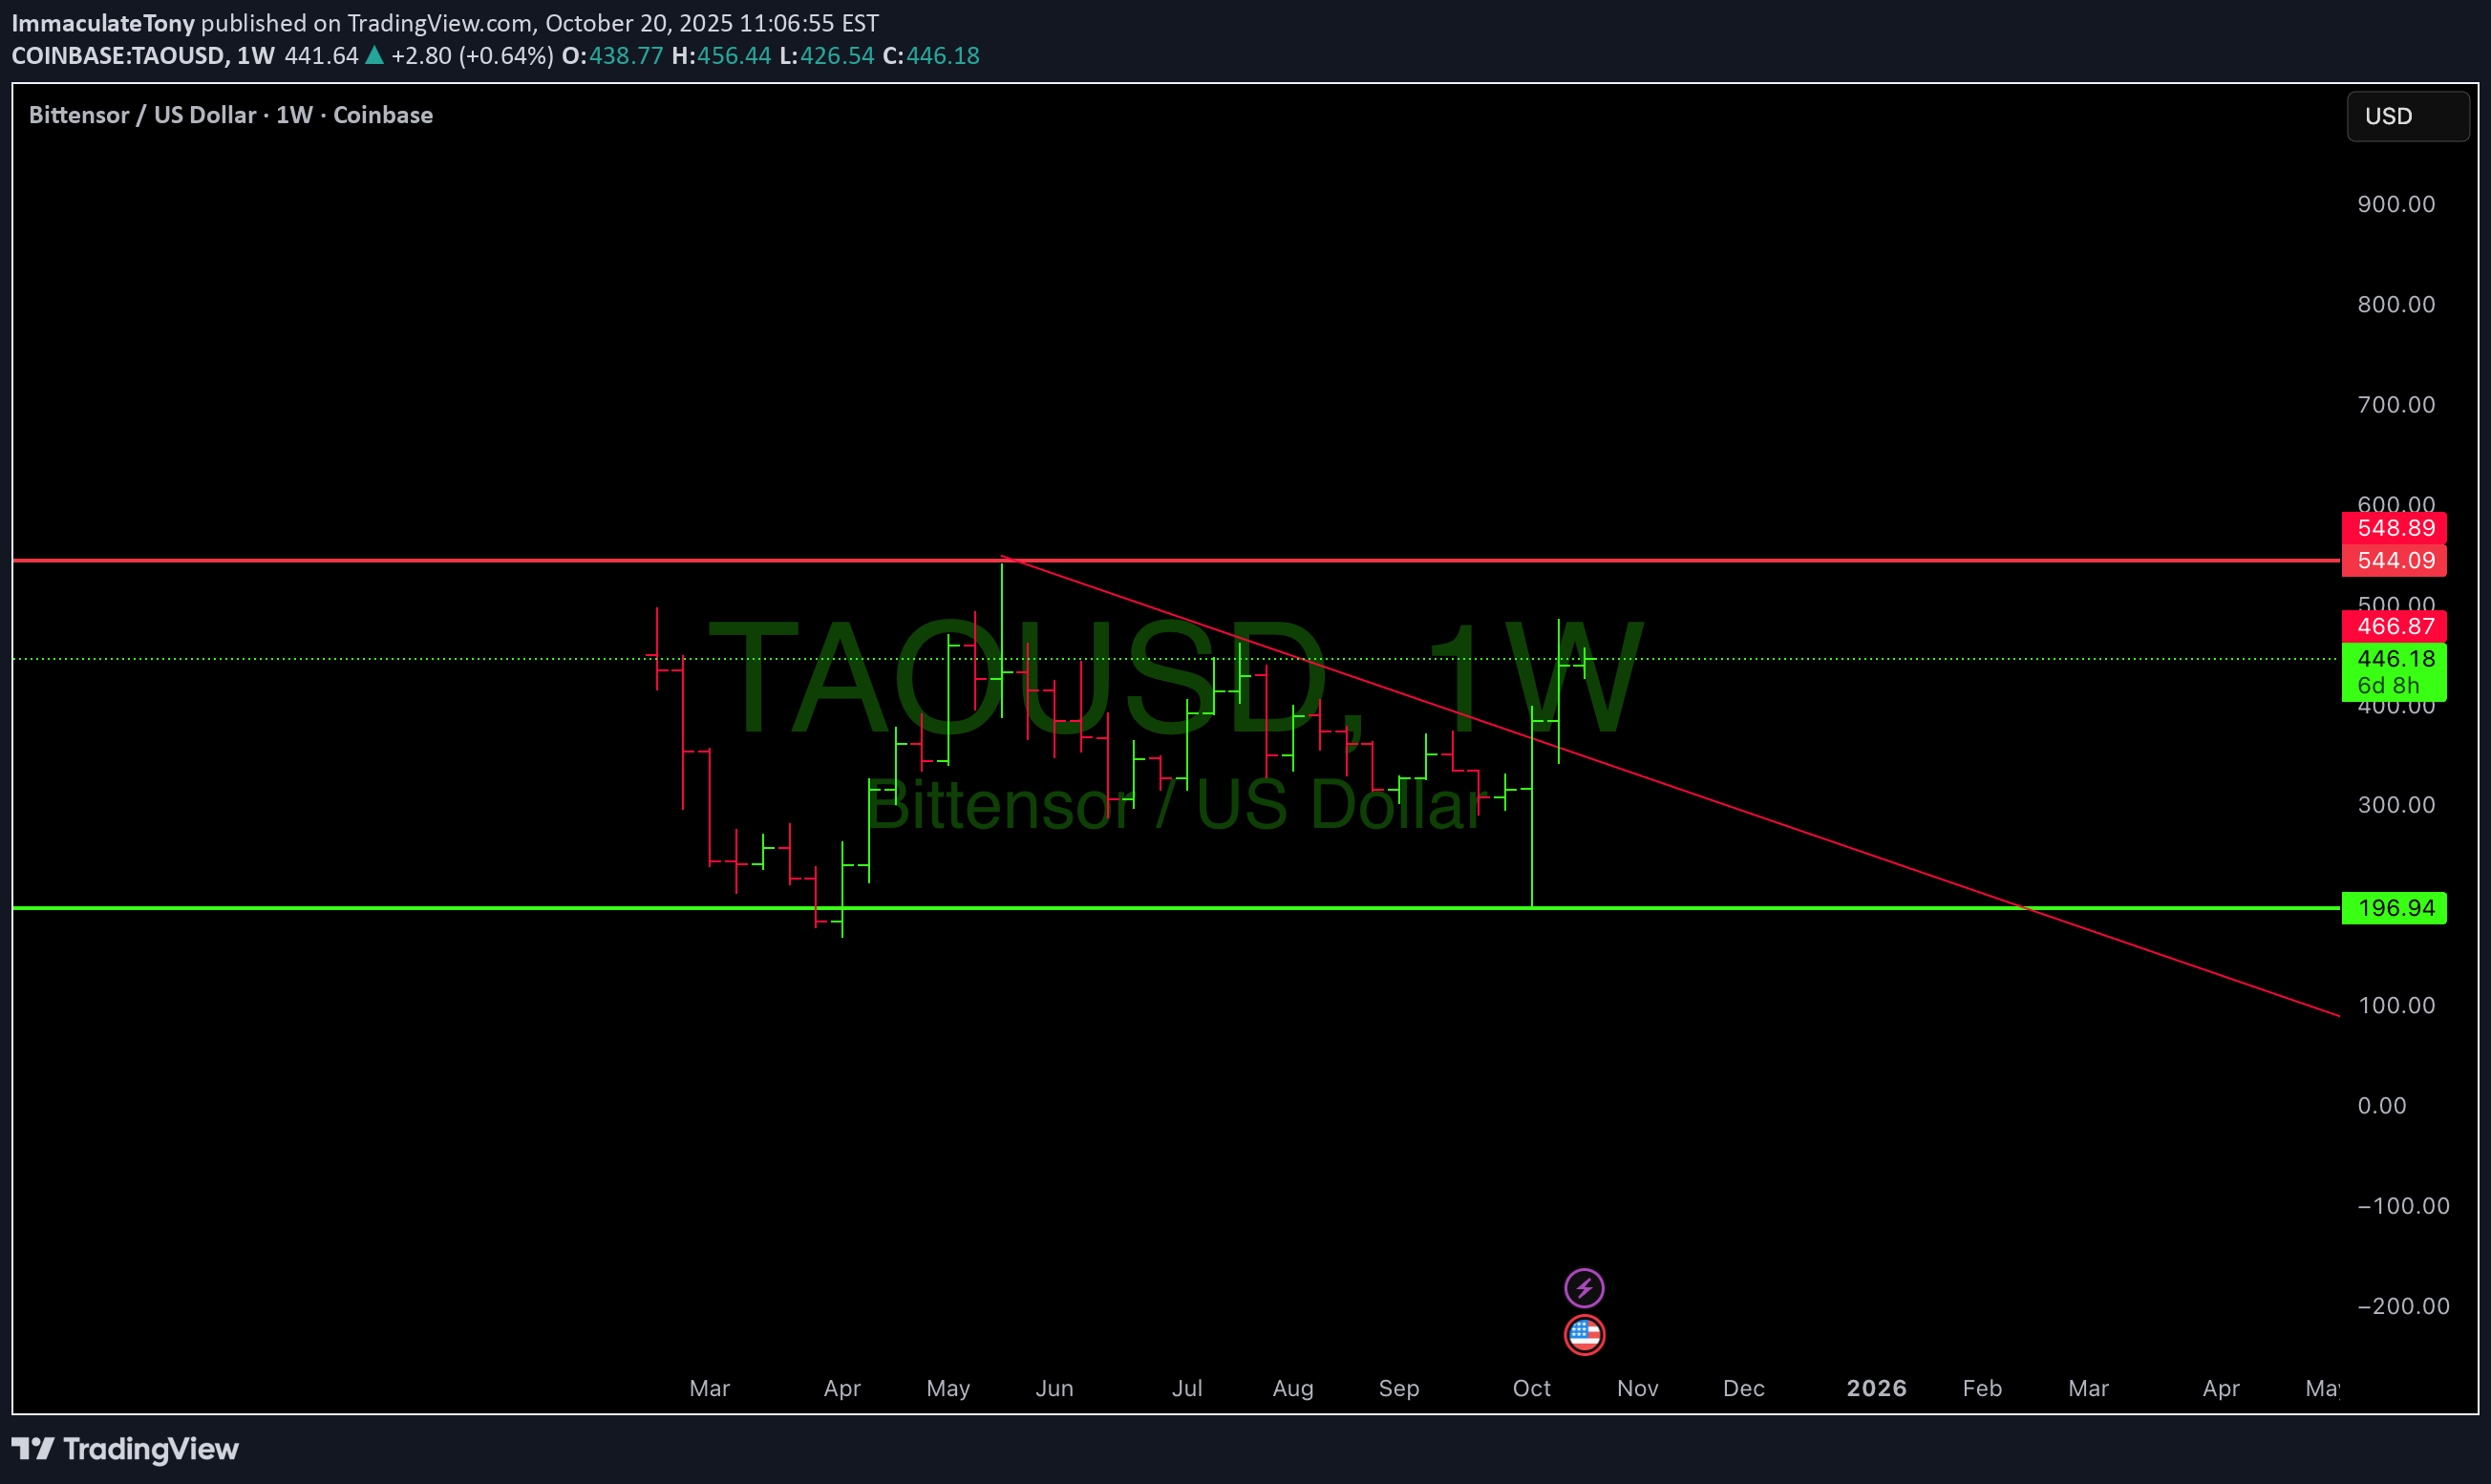
Weekly chart shows a clean break above the descending trendline, followed by a swift reclaim of the range. Price is now pressing the $350–$400 breakout band. Holding this area on higher timeframes flips the bias decisively up. With AI narrative strength and the halving ahead, the path of least resistance is higher while key supports hold. Support: $300 (major), then $296 (prior range floor). Pivot/Acceptance Zone: $373–$400 (win the weekly close here = momentum leg). Resistance/Targets: $500 first, then $704 extension; $700–$1,000 on continued trend. Invalidation: Weekly close back below $350 = momentum stalls; below $300 = back to value. Expect volatility; size with respect to invalidation, not hope.
ImmaculateTony
انرژی ماه کامل انویدیا (NVDA): آیا این هیجان قبل از جهش بزرگ بعدی است؟

🟩 190 — resistance zone 🟪 194 — potential breakout 🟥 153 — mid-range support 🟨 127 / 112 — deep demand zones Momentum still strong but slowing near highs… like energy you can still feel, even when it’s pulling back that “missing you” I do mean you! phase before momentum returns.
ImmaculateTony
BEARISH CASE: NVDA SHOWING CLASSIC PARABOLIC EXHAUSTION

BEARISH CASE: NVDA SHOWING CLASSIC PARABOLIC EXHAUSTION 📉 After an unsustainable 300%+ rally since Q3 2023, NVDA is displaying textbook parabolic blowoff characteristics. Weekly chart shows fractal trend violation with price touching upper resistance for first time since 2023. 4-hour chart reveals rapid breakdown below parabolic SAR support - a key reversal signal after extended uptrends. RSI at weekly overbought levels (70+) for prolonged period, historically precedes significant corrections. Multiple Fibonacci retracement levels ($110-130) now acting as downside targets, representing 30-40% correction potential from all-time highs. Institutional rotation away from AI premium already in progress. Extremely elevated valuation metrics combined with technical exhaustion pattern suggests profit-taking accelerating. The AI narrative has pushed NVDA's market expectations beyond reasonable execution capabilities. Watching for confirmation at $150 support level - a break there opens path to much larger correction. NVDA #TechnicalAnalysis #BearishSetup
ImmaculateTony
$AMZN Bear Case Study...

AMZN BEAR CASE THREAD 🧵 Amazon's weekly chart reveals a critical technical breakdown. After failing to sustain momentum above key resistance at $223, price is now forming what appears to be a double top pattern. The downtrend line from recent highs is firmly intact with accelerating downside momentum on multiple timeframes. RSI showing weakness without reaching overbought territory - bearish divergence forming. With parabolic SAR now flipped bearish on the 4H chart and stochastic signaling overbought conditions, downside targets include $215 and potentially $200 if selling intensifies. Earnings optimism priced in, but macro headwinds mounting. Position accordingly. #Bearish #technicalanalysis
ImmaculateTony
$TSLA Bullish Wedge

Weekly Chart Consolidation Pattern: TSLA has formed a clear triangle consolidation pattern after the significant pullback from its 2025 highs around $440. Price is currently testing the upper boundary of this triangle at $329.65, suggesting potential for a breakout. Key Support Levels Holding: The stock has established strong support at $273.38, which has been tested multiple times and held firmly. This creates a solid foundation for a bullish move. Momentum Shift: TSLA recently breaking above its descending trendline resistance, indicating a shift in short-term momentum from bearish to bullish. Higher Lows: On both daily and weekly charts, TSLA has been forming higher lows since April 2025, suggesting accumulation and strengthening bullish sentiment. Fundamental Catalysts Several fundamental factors support a bullish outlook: Robotaxi Progress: Recent news confirms TSLA received a Texas Robotaxi permit (August 9th), allowing it to launch a ride-hailing service with safety drivers, competing directly with Uber and Lyft in the autonomous vehicle space. Q2 Earnings Beat: The July 23rd earnings report showed TSLA beating expectations with EPS of $0.40 (14.29% above estimates) and revenue of $22.5B (slightly above estimates), demonstrating the company's resilience despite challenging market conditions. Production Plans on Track: During the earnings call, Tesla confirmed "plans for new vehicles that will launch in 2025 remain on track, including initial production of a more affordable model in 1H25." This addresses a key market concern about Tesla's product roadmap. Strong Analyst Support: Despite mixed ratings, several prominent analysts remain highly bullish, with Wedbush maintaining a $500 price target (approximately 52% upside from current levels). RBC Capital also raised their price target from $319 to $325 recently. AI and Technology Leadership TSLA's AI initiatives offer significant upside potential: FSD Progress: Elon Musk stated during the earnings call that "unsupervised FSD likely to be available for personal use by end of year," which could be a major competitive advantage. Samsung Partnership: The company secured a $16.5 billion chip deal with Samsung for next-gen AI chips, positioning Tesla for continued leadership in autonomous driving technology. Supply Chain Resilience: Tesla is "localizing supply chains to mitigate geopolitical risk," making it the only automaker sourcing batteries at scale through non-Chinese routes, according to Piper Sandler. Price Action and Potential Targets The recent price action suggests TSLA is preparing for a potential upward move: Immediate Resistance: The $340.24 level shown on your chart represents the first significant resistance. A decisive break above this level could trigger a run toward the $400 psychological level. Intermediate Target: If momentum continues, the next target would be a retest of the 2025 high near $440. Current Price Action: The stock has recently crossed above the descending trendline that had been in place since January 2025, which is typically a bullish signal. Risks to Monitor While maintaining a bullish bias, it's important to acknowledge potential risks: AI Team Changes: Recent news indicates Tesla scrapped its Dojo Supercomputer AI team, which could impact some AI development initiatives. Competition: Chinese EV makers and traditional automakers are intensifying efforts in both EV and autonomous driving spaces. Technical Support: The $275-280 zone remains critical - a break below could invalidate the bullish thesis. In conclusion, TSLA's technical setup across multiple timeframes, combined with positive fundamental developments in robotaxi, AI initiatives, and upcoming product launches, creates a compelling bullish case for the stock in the near to medium term. The stock appears positioned for a potential upside move as it tests key technical resistance levels with strong support established below current prices.
ImmaculateTony
$RNDR bullish momentum?
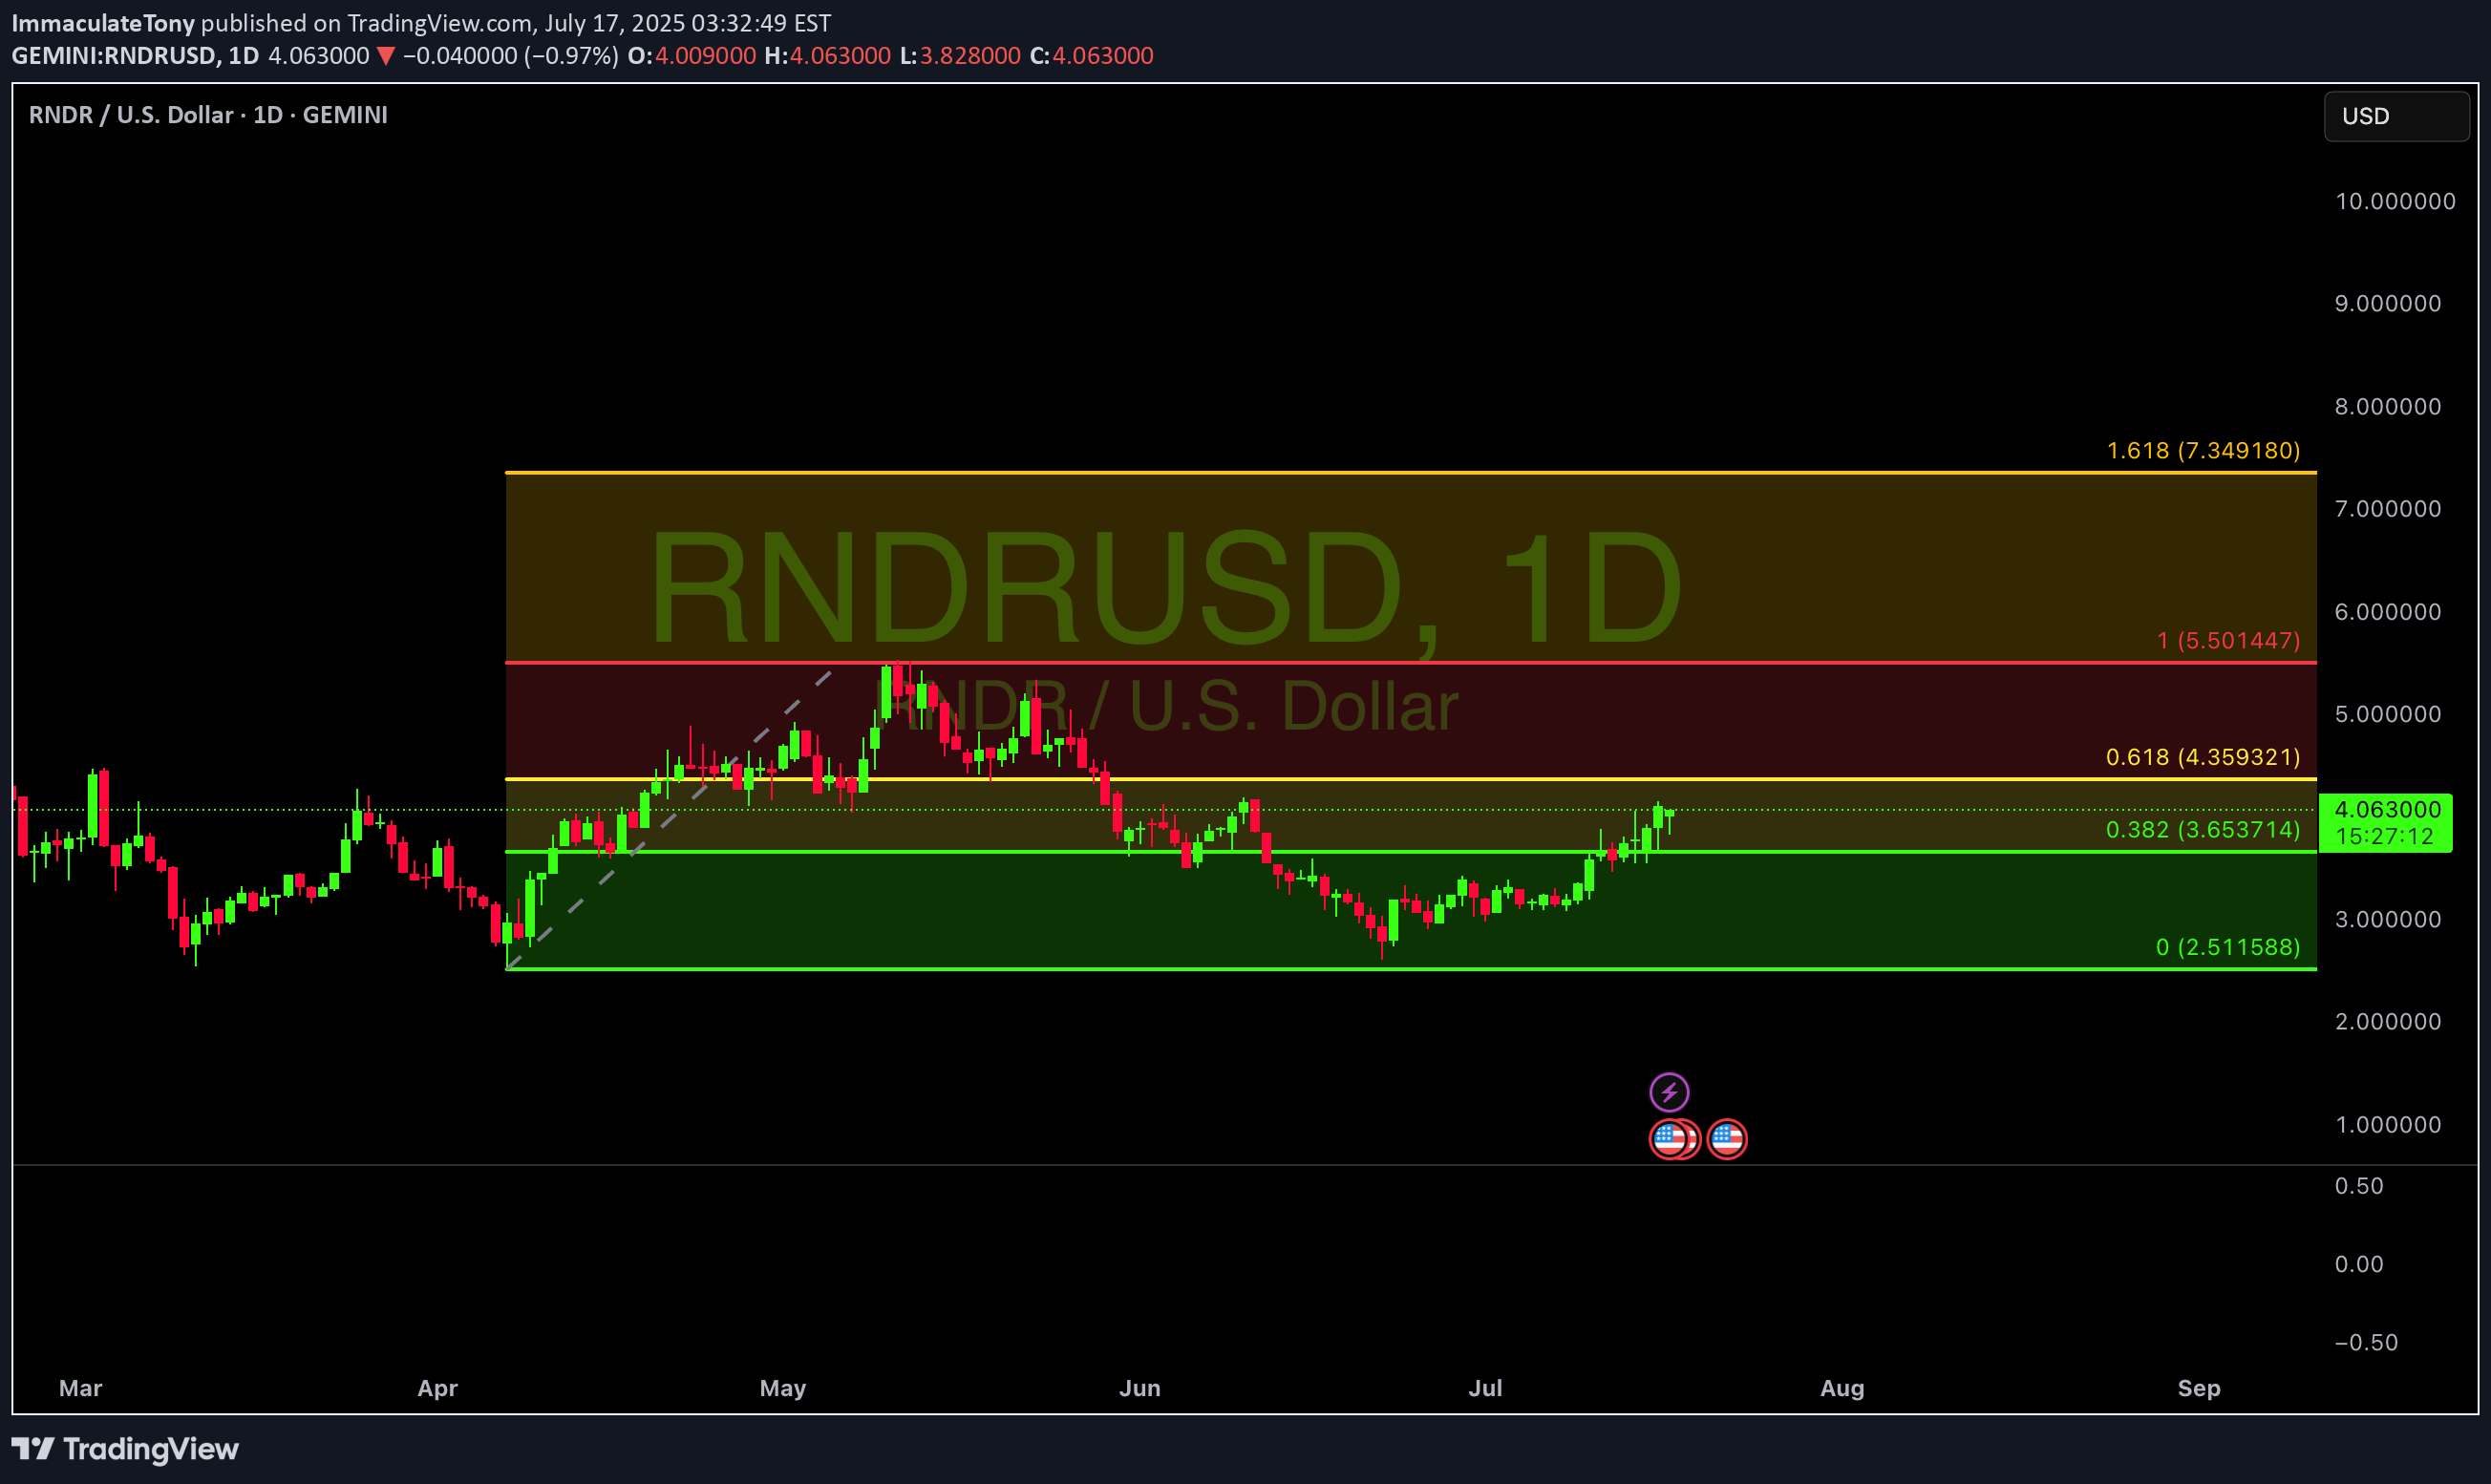
RNDR is showing signs of life at a major support level. After a significant pullback, RNDR is finding solid ground in the $2.90 range, a critical area that previously acted as resistance. The 4-hour chart is flashing a bullish divergence on the Stochastic oscillator, suggesting the downward momentum is fading. This could be the accumulation zone before the next major rally. #RNDR #Render #CryptoTrading #TechnicalAnalysis #Bullish
ImmaculateTony
$NVDA - Yes Cookie

NVDA’s timing area might stay long-term, but it could also be a taken profit area here.
Disclaimer
Any content and materials included in Sahmeto's website and official communication channels are a compilation of personal opinions and analyses and are not binding. They do not constitute any recommendation for buying, selling, entering or exiting the stock market and cryptocurrency market. Also, all news and analyses included in the website and channels are merely republished information from official and unofficial domestic and foreign sources, and it is obvious that users of the said content are responsible for following up and ensuring the authenticity and accuracy of the materials. Therefore, while disclaiming responsibility, it is declared that the responsibility for any decision-making, action, and potential profit and loss in the capital market and cryptocurrency market lies with the trader.