
Hossein_Fatapour_IRAN
@t_Hossein_Fatapour_IRAN

What symbols does the trader recommend buying?
Purchase History
پیام های تریدر
Filter
Hossein_Fatapour_IRAN
BTC (+)
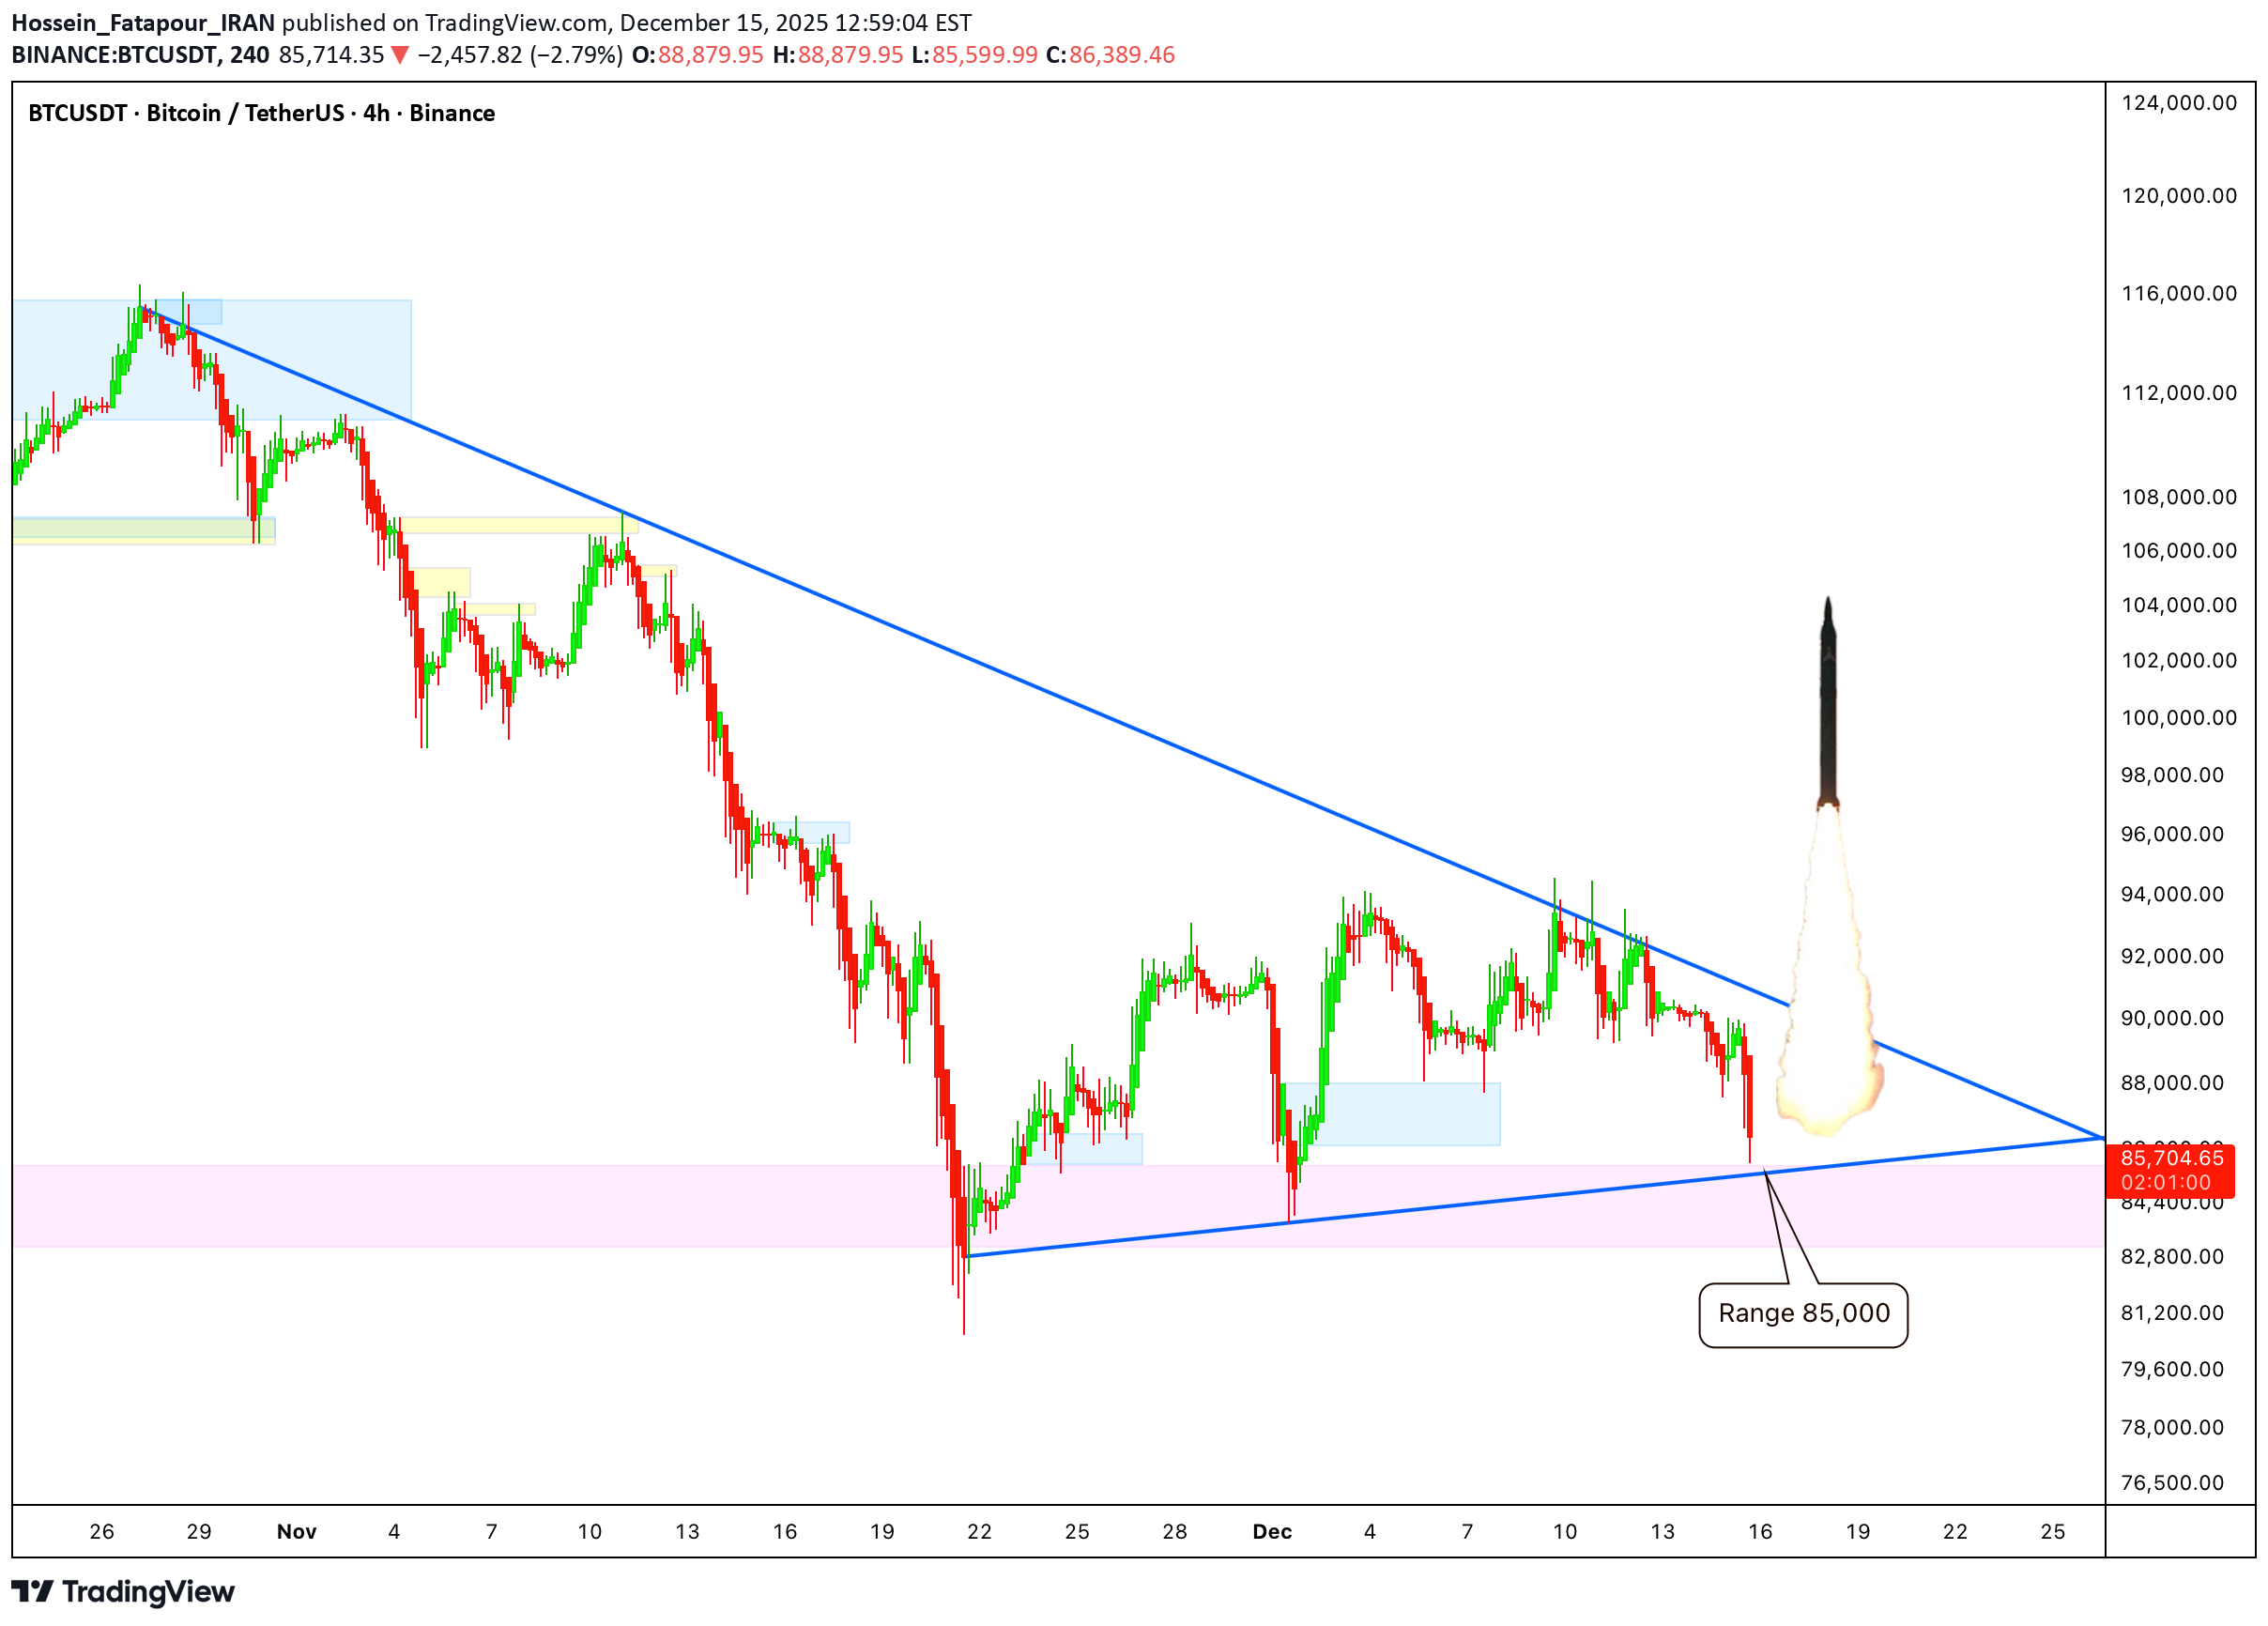
In the range of 85,000, it will have its last stop, although exactly the reverse of this process has occurred for the Tether market, and we must use the last opportunities to rise.
Hossein_Fatapour_IRAN
آیا ارز دیجیتال پی (Pi) آماده انفجار است؟ کلید صعود بزرگ در این ابر سبز!
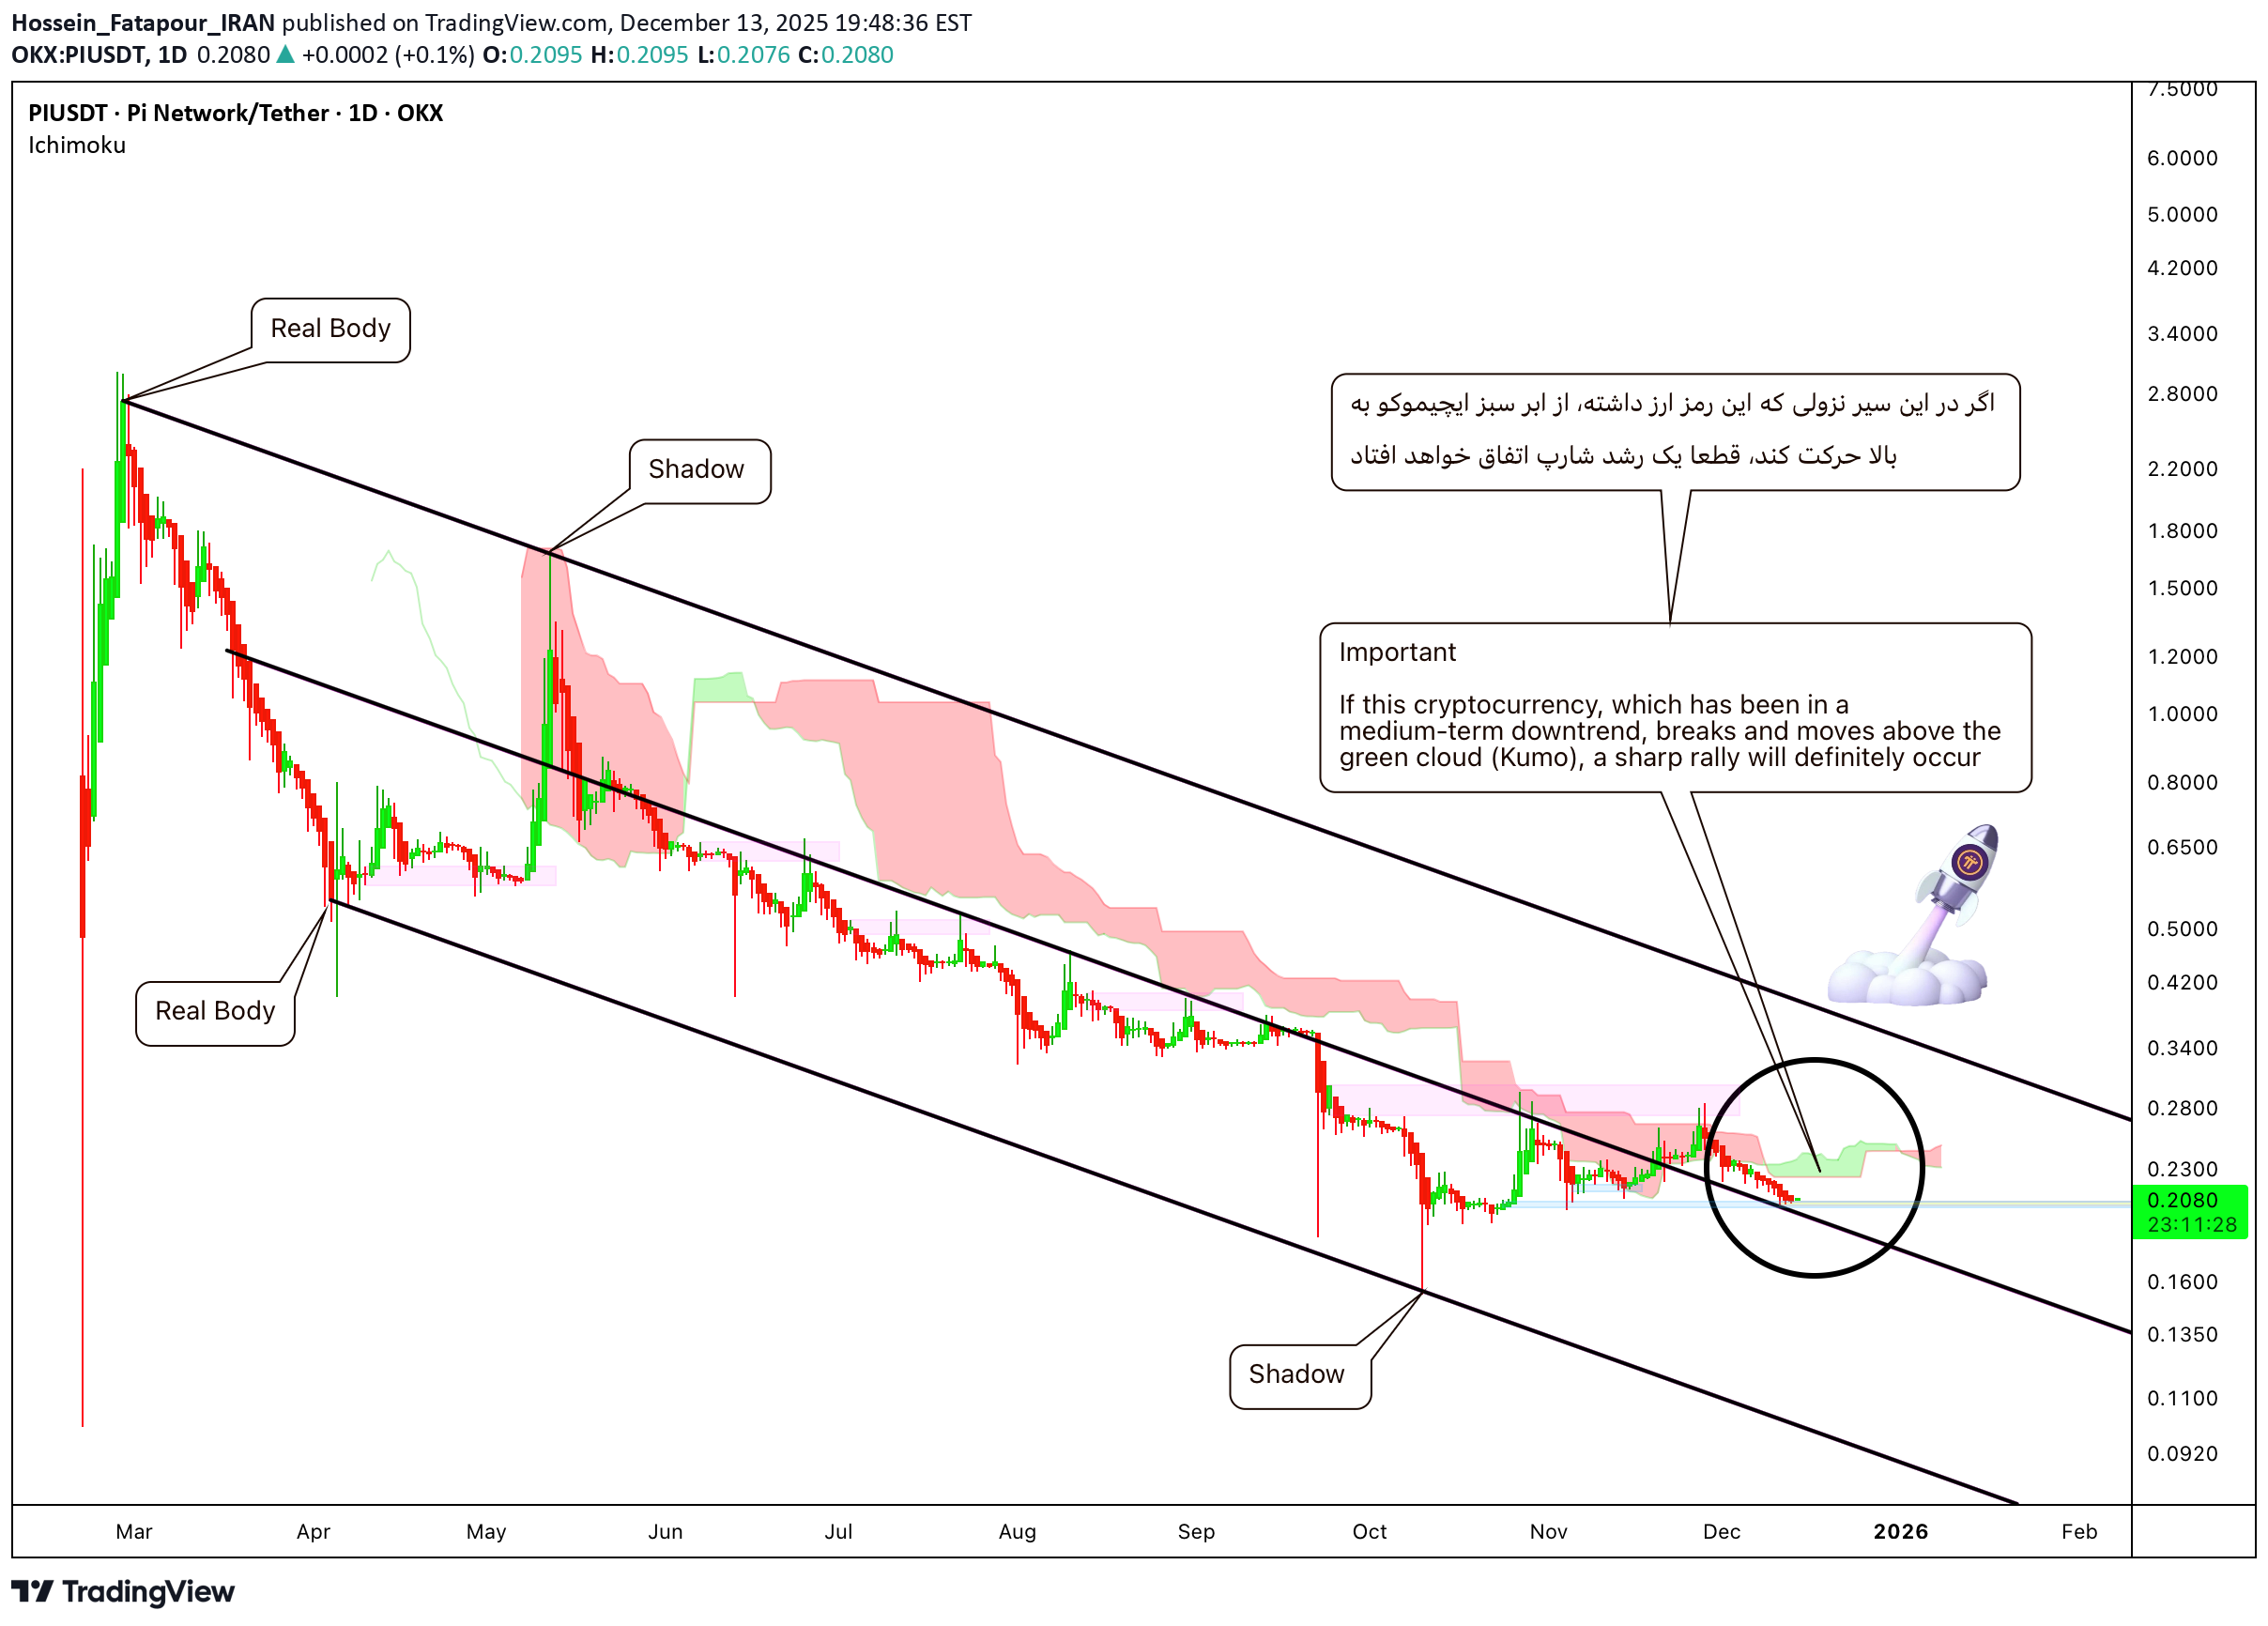
If this cryptocurrency, which has been in a medium-term downtrend, breaks and moves above the green cloud (Kumo), a sharp rally will definitely occur.
Hossein_Fatapour_IRAN
فرصت طلایی خرید ارز دیجیتال: ورود به منطقه سودی با پتانسیل رشد انفجاری!

The price range of 0.25 to 0.26 is the best entry point for this cryptocurrency. It also has a positive divergence and has been in a correction for a long time. It is highly, highly prone to a very good growth spurt.
Hossein_Fatapour_IRAN
Destiny BTC 4H
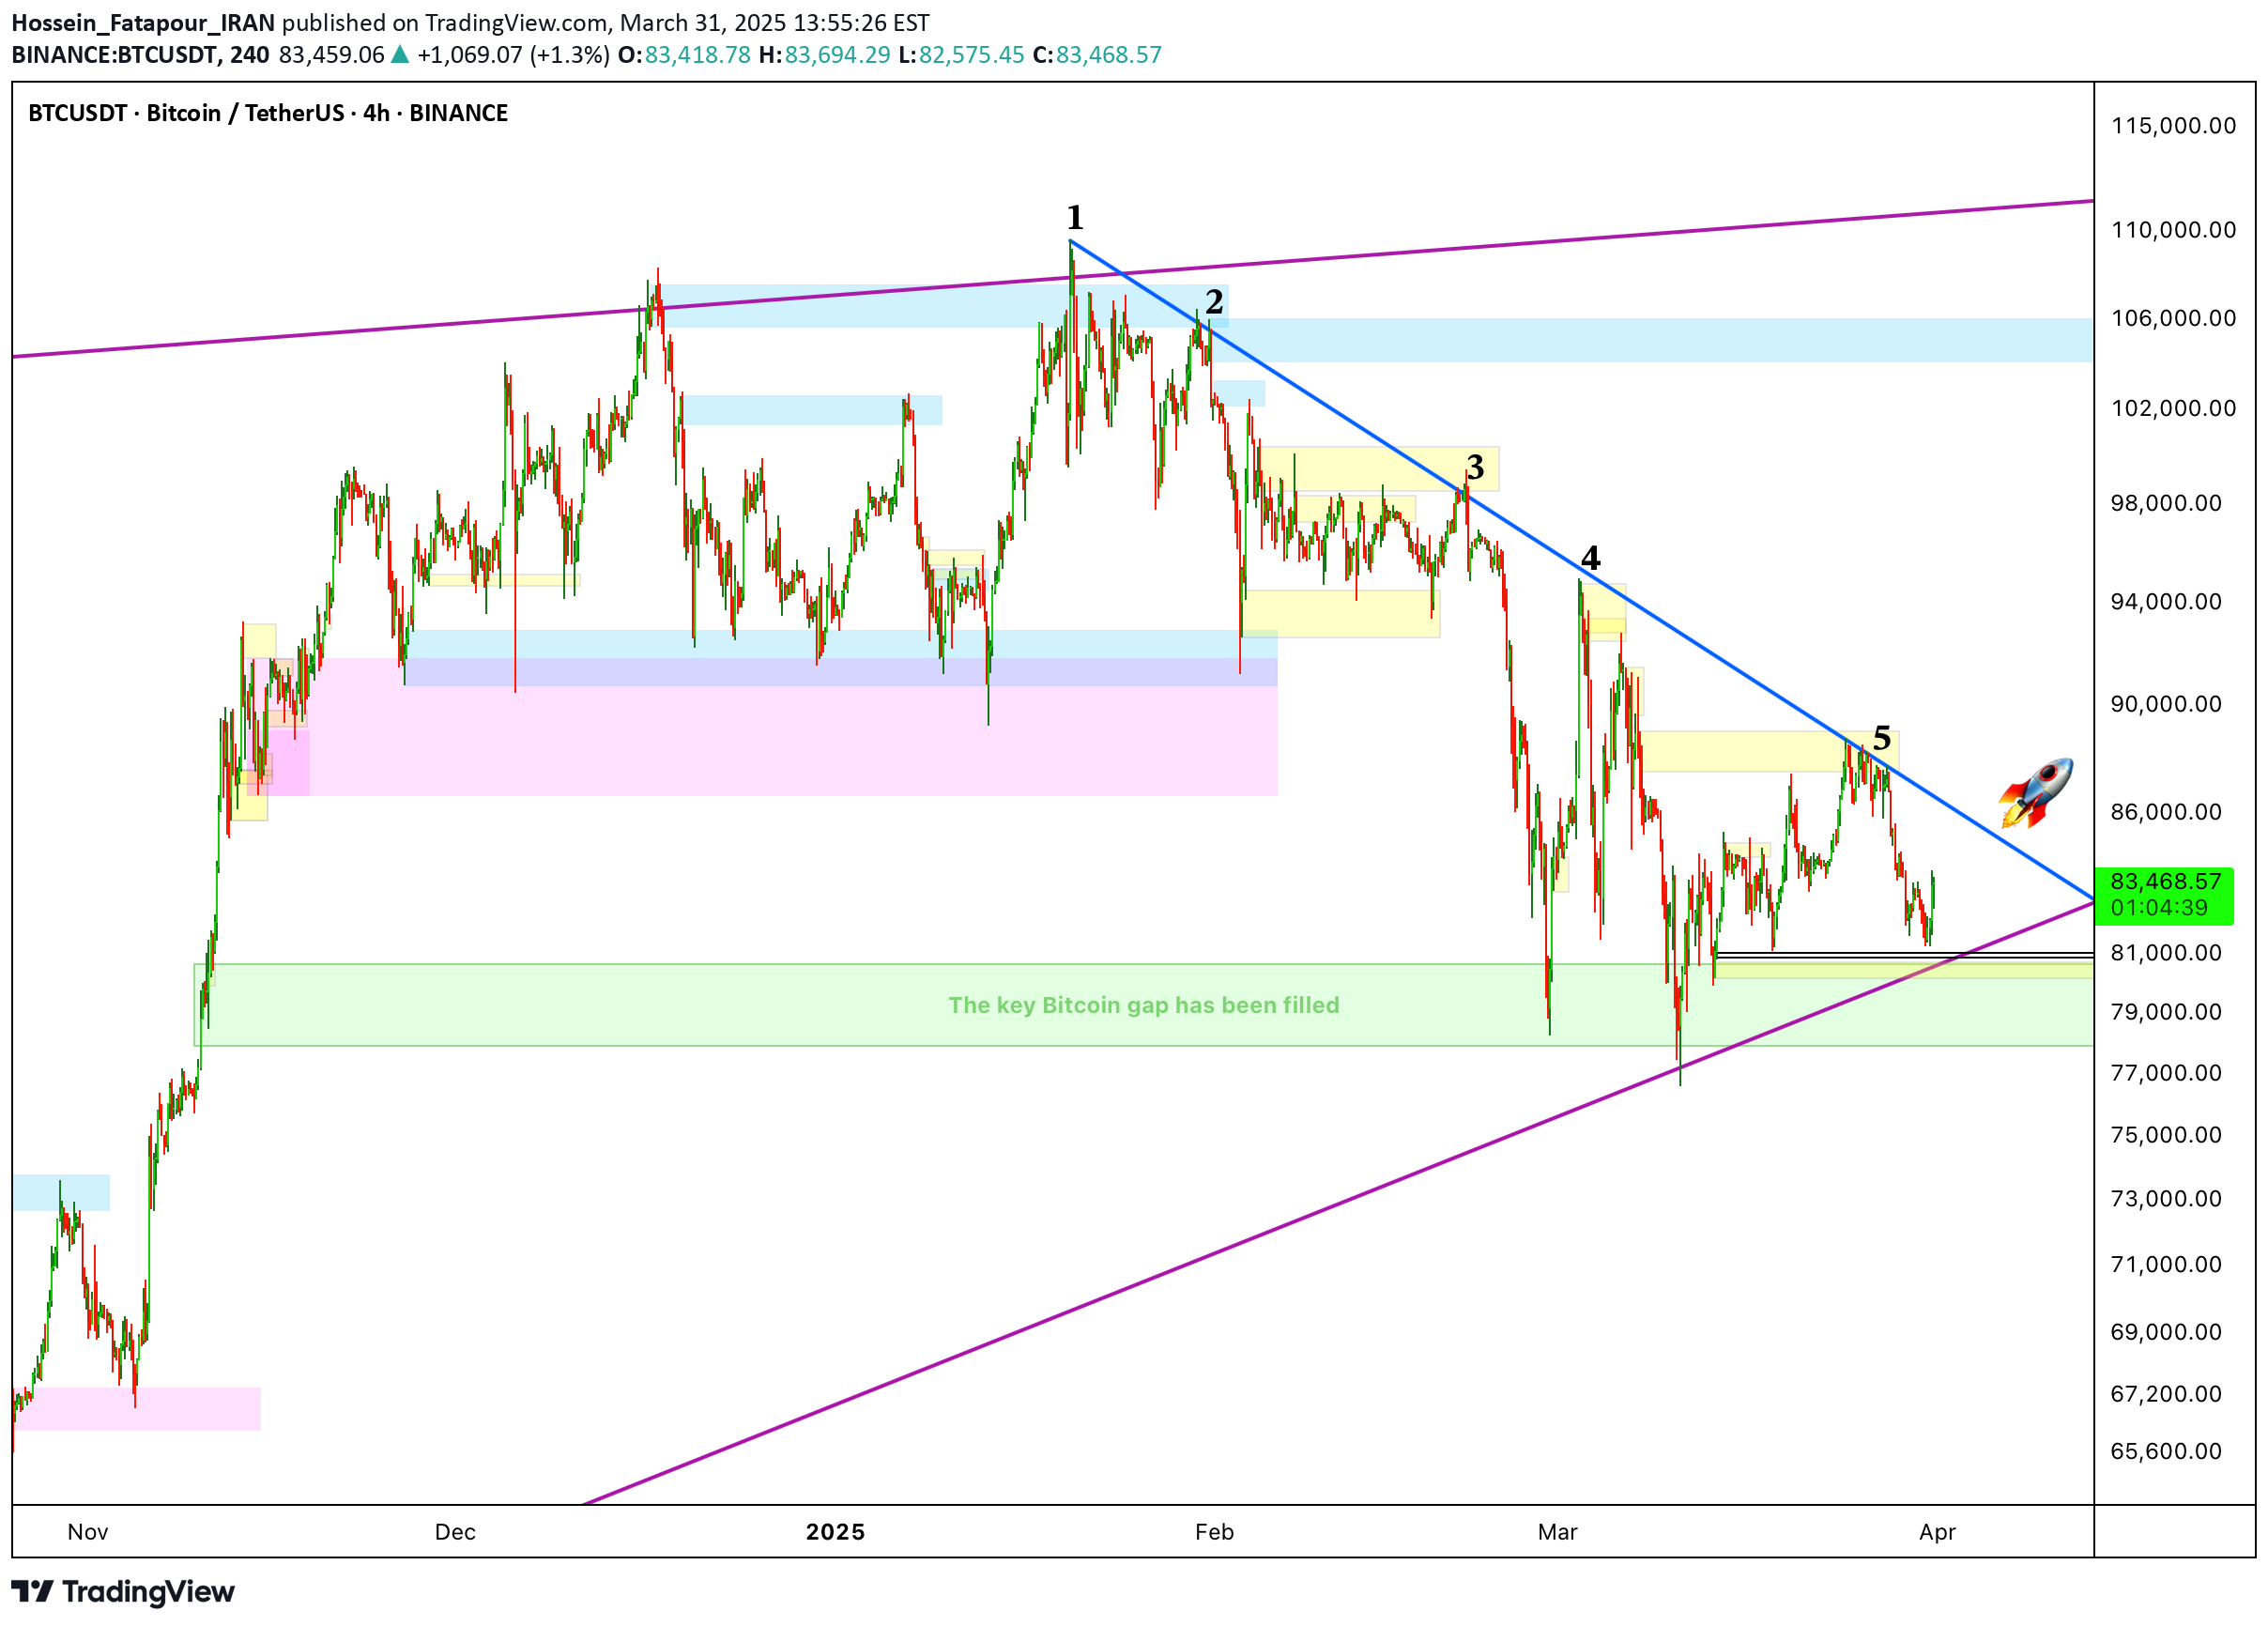
On the 4-hour timeframe, we can clearly see that the downtrend line has been tested multiple times, so the probability of a breakout is very high. Of course, price tolerance should always be considered. My guess is that from the current price or around $81K, Bitcoin has likely bottomed.
Hossein_Fatapour_IRAN
Destiny BTC Daily

The Bitcoin chart clearly shows trendline support from the bottom, and the gap has been filled. I’m gradually expecting growth now.
Hossein_Fatapour_IRAN
Destiny 1H SOL

According to the daily analysis where a breakdown has occurred, the daily breakdown point must be touched, meaning the range of $180. In this one-hour chart, my perception is that beautiful patterns like triangles and channels are forming, and given the very clear negative divergence, it is evident that it will break from the bottom.
Hossein_Fatapour_IRAN
Destiny 1H ETH

It is in a one-hour channel, and based on the daily time analysis, I expect a drop to the $2900 range. We are in a time when most traders mistakenly think we are in the ALT season, but before that, we will have a drop because the negative divergence is very clear to everyone.
Hossein_Fatapour_IRAN
Destiny 1H ADA

The negative divergence is very clear; in the previous analyses I sent, I explained that it has broken the daily trend line and is currently at another trend line resistance, which is the current point. My expectation as a technician is a drop in the price of ADA to the $0.5 range.
Hossein_Fatapour_IRAN
Destiny ADA Daily

The daily trend line has been broken, and until the trend line drawn from the minor highs is reached, I currently expect a very sharp correction to the $0.55 area, which will be exactly 55%.
Hossein_Fatapour_IRAN
Destiny ADA

It should have a correction to the range of 0.555, both due to the correction after breaking the daily trend line, and because of the support from the Tether market, as well as reaching the dynamic resistance.
Disclaimer
Any content and materials included in Sahmeto's website and official communication channels are a compilation of personal opinions and analyses and are not binding. They do not constitute any recommendation for buying, selling, entering or exiting the stock market and cryptocurrency market. Also, all news and analyses included in the website and channels are merely republished information from official and unofficial domestic and foreign sources, and it is obvious that users of the said content are responsible for following up and ensuring the authenticity and accuracy of the materials. Therefore, while disclaiming responsibility, it is declared that the responsibility for any decision-making, action, and potential profit and loss in the capital market and cryptocurrency market lies with the trader.