
GustavoCastaneda1
@t_GustavoCastaneda1

What symbols does the trader recommend buying?
Purchase History
پیام های تریدر
Filter
GustavoCastaneda1
بیت کوین آماده پرواز: هدف نهایی ۱۳۰ تا ۱۴۰ هزار دلار کجاست؟
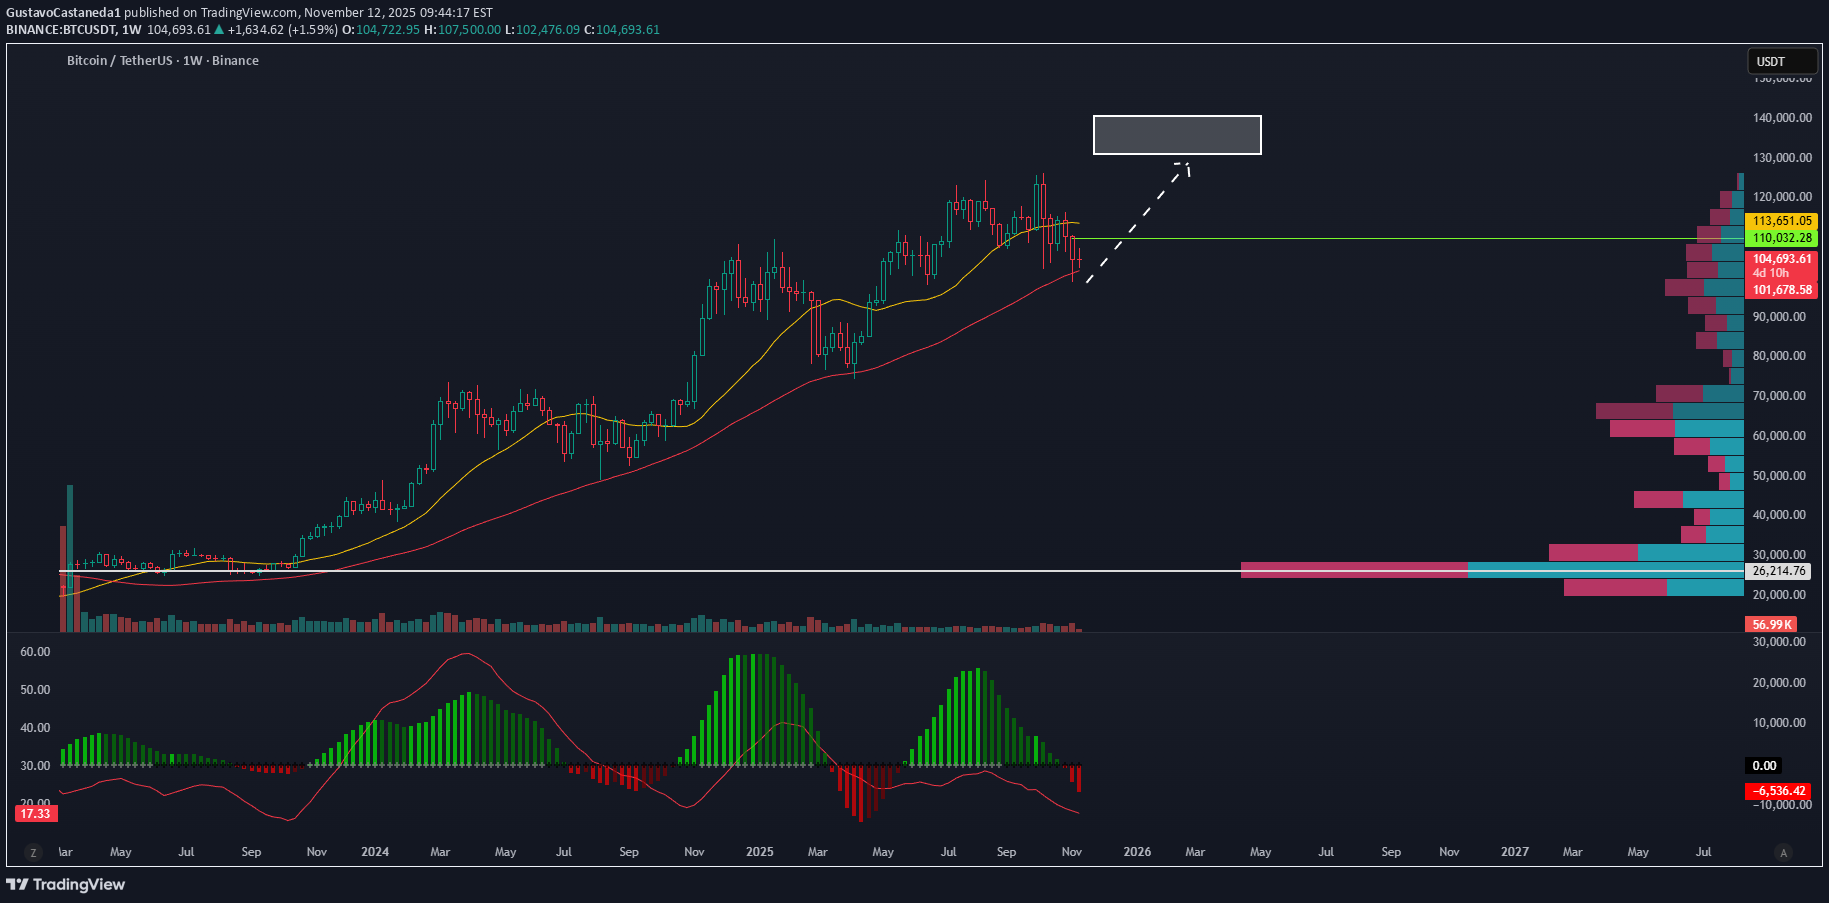
Hello! It's me again! My friends, it seems that BTC's price action is clearly indicating its trend and direction. Of the last five candles on the weekly chart, four have shown a very clear indication: there are buyers on the downside, it has remained above the 55-week moving average, and we've seen very strong support around $103,000. It's also true that the uptrend on the weekly chart is already quite worn out. It has been quite long and has remained solid until now; however, this could be the bullish move that ends the trend. At the moment, the technical analysis is simple and very clear: we are within the lower range of an upward move (I bought at $109,900 six weeks ago and I plan to hold since the movement is clear). In conclusion, Bitcoin will be looking for the $130,000 range and, at most, $140,000. The final upward move is about to begin. See you later! And remember, this isn't advice, it's just an opinion.
GustavoCastaneda1
BITCION TO $112,000

Hello! Analyzing the Bitcoin price again. BTC's price action has remained in a very good consolidation zone, where it has shown strength and a real intention to remain bullish. Currently, Bitcoin is declining slightly, attempting to capture the latest liquidations to launch a strong bullish movement. The area of greatest interest is near the previous high. Volume and buying interest remain stable, and therefore, on a daily chart, the projection would remain bullish, without ruling out liquidity draws near $100,000.Disclaimer: This is solely the opinion of a trader. It is not an investment recommendation.
GustavoCastaneda1
DOUBLE BOTTOM IN ETH / ETH TO $2,500

Hello! We have confirmation of a double bottom. Eth has a bullish pattern, the price reached the liquidity zone at $1,780, took positions, and the price began to form a double bottom. The price of Eth has already gained liquidity, and on a weekly and daily chart, the price will be looking at $2,500. Remember that a weekly chart is for seeing results between 20-30 days and a weekly chart will be seeing results over a period of 3 months. It is not ruled out that the price remains in its range. However, the indicators, price action, and market sentiment tell us that Eth is suitable for long positions.
GustavoCastaneda1
BTC TO $91,000!!

Hello! Today we're going to analyze Bitcoin's price action. It's currently rebounding. The movement doesn't seem to have much strength. However, let's not forget that on a weekly chart, Bitcoin is at the end of wave 4 of Elliott's theory.We have a very clear scenario: a rebound to $91,000, which is an area with a lot of shorts and liquidity. If buying pressure is greater, it's logical that Bitcoin could break out strongly to the upside, because price action always seeks out areas of less pressure, that is, it will always seek liquidity.On 4-hour charts, we can see a lot of volatility, however, any purchases below $84,000-$87,000 can be considered conservative because it is a good buying zone. After all, you are buying at the end of wave 4 on a weekly chart, therefore, liquidations below $84,000 are not ruled out, but the short and medium-term trend is bullish.Disclaimer: This is only an opinion; it should not be used as investment advice or recommendation.Double absorption candle in the $86,000 area, this is an excellent signal, the price will strongly seek $91,000
GustavoCastaneda1
MicroStrategy To $370?
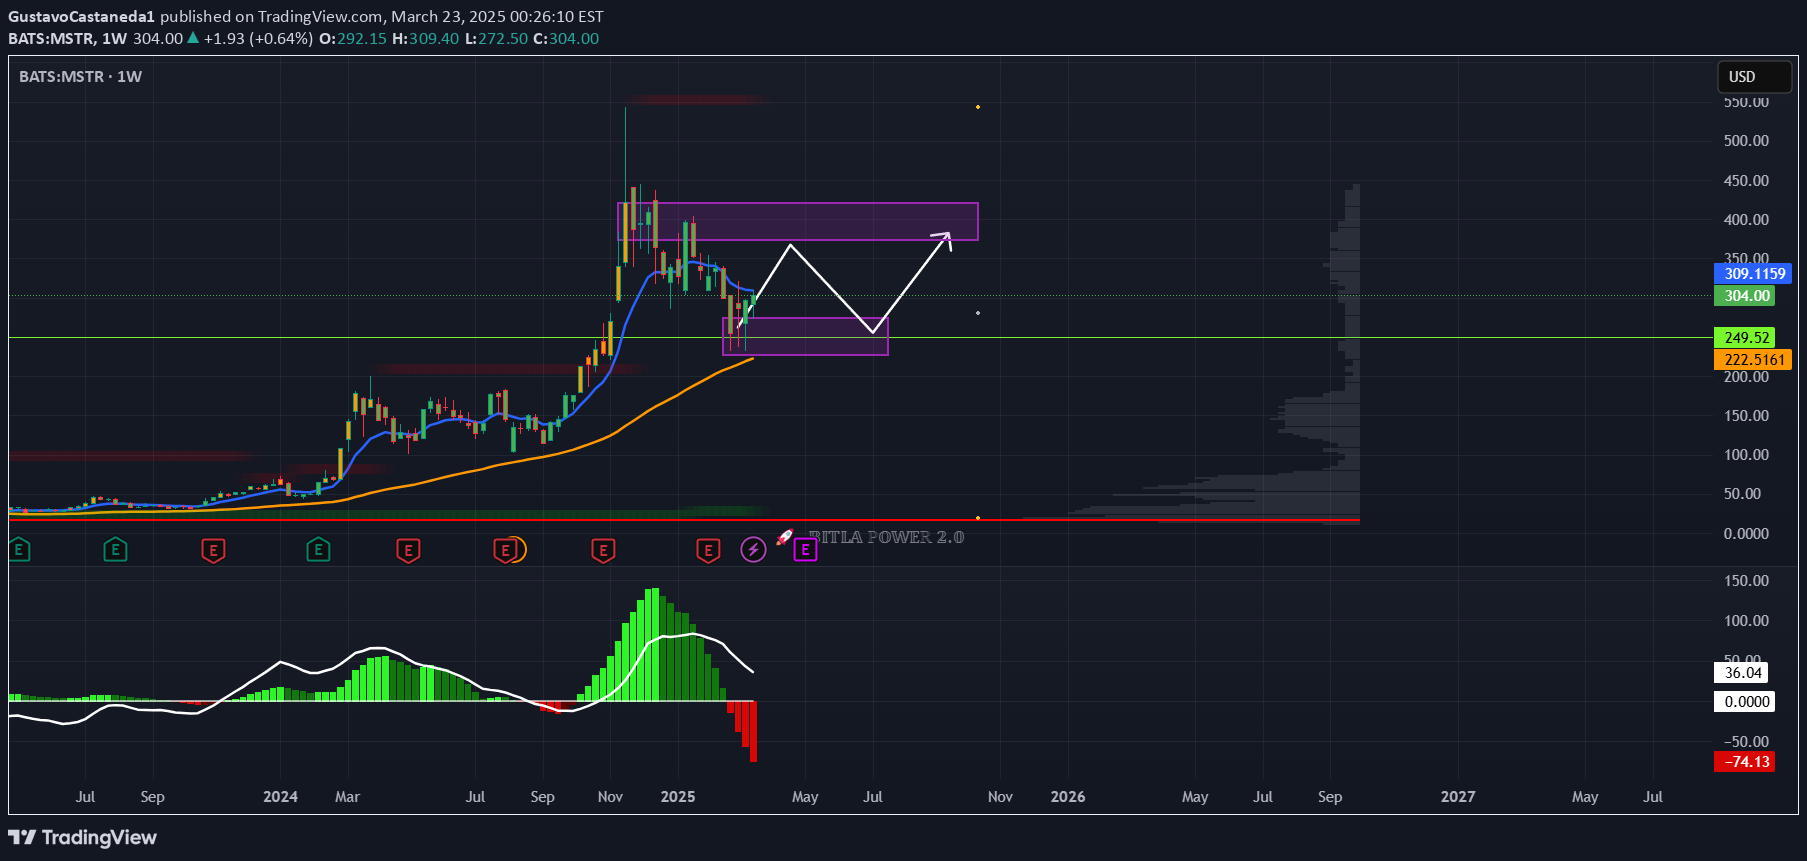
Hello friends! I'm back with an analysis of MSTR. As we can see, the price had a significant drop of 57% from November 2024 to March 2025. The price is highly correlated with Bitcoin, and said cryptocurrency is in a wave 4 within an Elliott wave pattern. Therefore, Bitcoin will be returning to test $110,000. Therefore, MSTR, holding 499,096 bitcoins, will see a very significant rise in its price. In the short term, MSTR will be going to test its luck at $370 per share. However, it is highly likely that it could return to $410 per share. MSTR has many technical and fundamental indicators in its favor to be a highly profitable value asset. The best buying zones are below $300 per share. Disclaimer: This is only an opinion; it should not be used as investment advice or recommendation.
GustavoCastaneda1
Eth to $2,500?

Hello friends! Well, I'm sharing my opinion. Eth is feeling boring. There isn't much volatility, however, the rebound is clear. It's clear that it will be testing the $2,250 area. However, there are two scenarios:A) A brief approach with a very sharp rejection.B) A strong upward breakout to use the $2,250 area as support and reach the famed $2,500, which is a highly liquid area.In conclusion, the price will seek the $2,250 area early in the week, and buying pressure will determine the final direction.Disclaimer: This is only an opinion; it should not be used as investment advice or recommendation.
Disclaimer
Any content and materials included in Sahmeto's website and official communication channels are a compilation of personal opinions and analyses and are not binding. They do not constitute any recommendation for buying, selling, entering or exiting the stock market and cryptocurrency market. Also, all news and analyses included in the website and channels are merely republished information from official and unofficial domestic and foreign sources, and it is obvious that users of the said content are responsible for following up and ensuring the authenticity and accuracy of the materials. Therefore, while disclaiming responsibility, it is declared that the responsibility for any decision-making, action, and potential profit and loss in the capital market and cryptocurrency market lies with the trader.