
GoodTarget
@t_GoodTarget

What symbols does the trader recommend buying?
Purchase History
پیام های تریدر
Filter
GoodTarget
IOTAUSD - 4H Timeframe: Long Position Opportunity
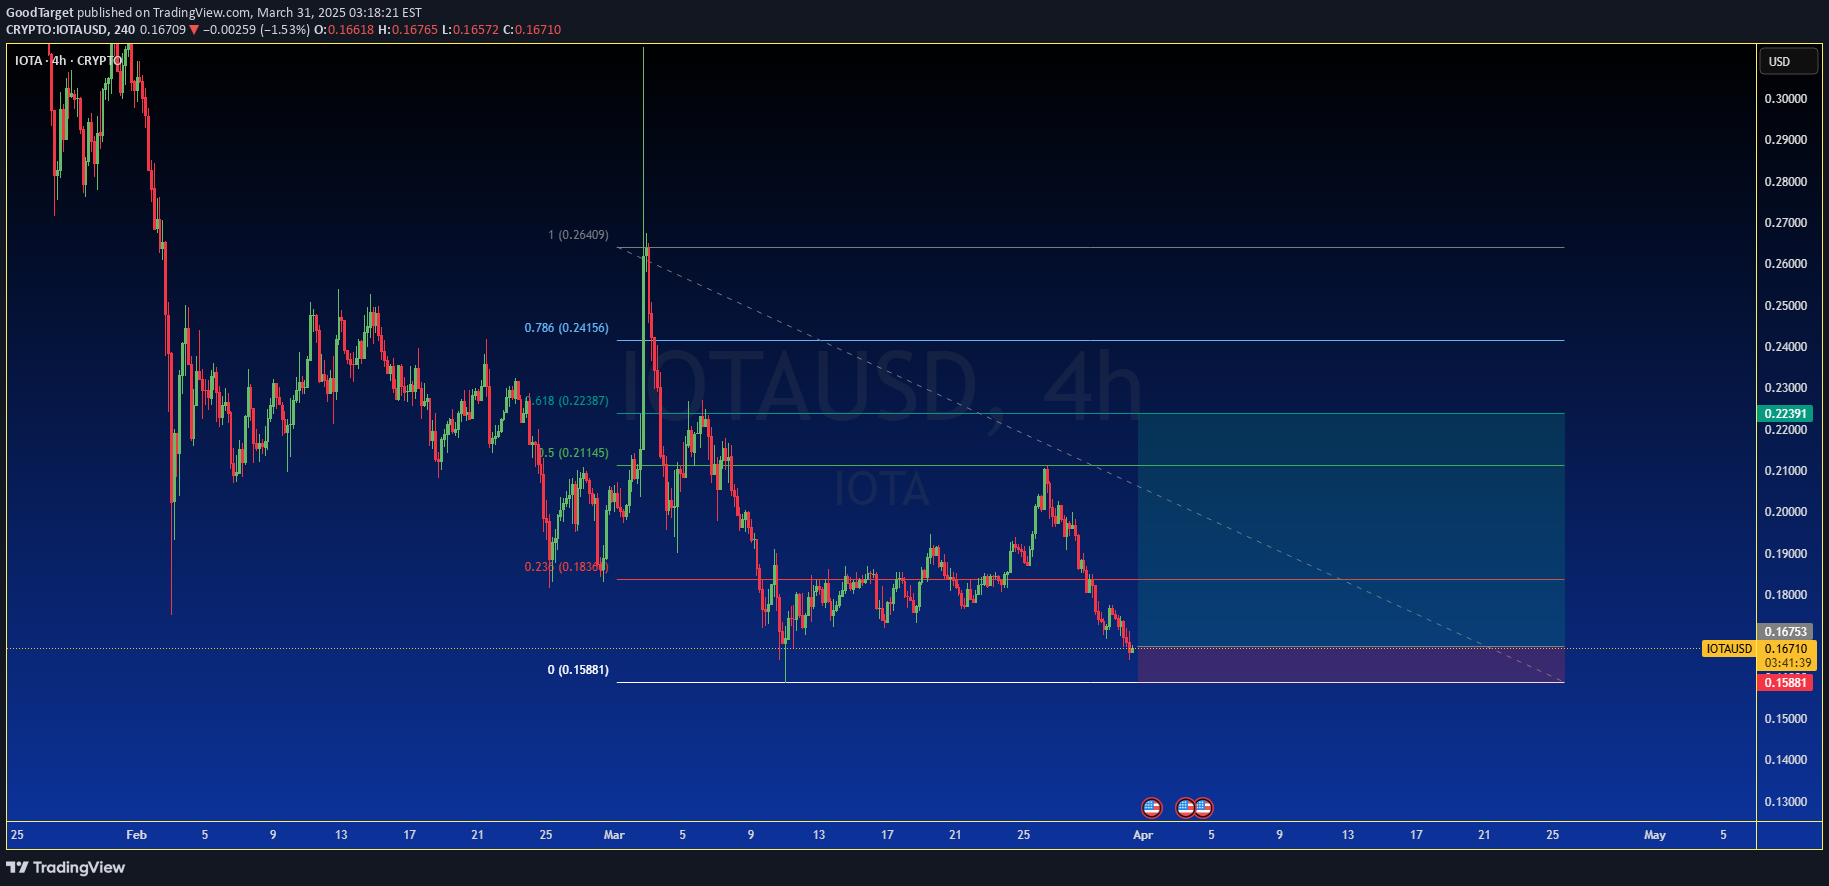
Key Observations: Price at a Strong Support Zone: The current price is at 0.16754, which is within a well-defined support zone between 0.15881 and 0.1850 (blue shaded area). This zone has acted as a significant support in the past, particularly in early March, where the price bounced multiple times. The price has just tested the lower boundary of this support zone (0.15881) and is showing signs of stabilization, suggesting buyers are stepping in to defend this level. Potential Reversal Setup: After a sharp downtrend from late February (where the price dropped from 0.24649 to 0.15881), the price has entered a consolidation phase within the support zone. The sharp decline likely exhausted selling pressure, and the price’s failure to break below 0.15881 indicates strong buying interest at this level. The chart shows a potential double-bottom pattern forming around 0.15881 (early March and late March), a bullish reversal pattern that often signals the end of a downtrend. Resistance Levels and Upside Potential: The chart marks several resistance levels that could serve as take-profit targets for a long trade: Level 1: 0.21415 (27.8% gain from 0.16754) Level 2: 0.22377 (33.5% gain) Level 3: 0.24505 (46.2% gain) Level 4: 0.24649 (47.1% gain, the previous high) These levels provide clear targets for a bullish move, with the first target at 0.21415 offering a solid 27.8% gain, making this an attractive risk-to-reward setup. Volume and Momentum: While volume isn’t directly shown, the sharp drop in late February likely came with high selling volume, which has since tapered off as the price consolidates in the support zone. This suggests selling pressure is diminishing. The consolidation phase, with smaller candlestick ranges, indicates reduced volatility and a potential buildup for a breakout to the upside. Descending Trendline: A descending trendline (white dashed line) has acted as resistance throughout the downtrend, with the price rejecting this line multiple times (e.g., at 0.24649, 0.22377, and 0.21415). The price is currently below this trendline, but a break above it (around 0.1850–0.1900) would confirm a trend reversal and signal a strong bullish move. Broader Market Context: IOTA is a cryptocurrency focused on the Internet of Things (IoT), often influenced by developments in IoT, blockchain adoption, and broader crypto market trends. As of March 30, 2025, if the crypto market is showing signs of recovery (e.g., Bitcoin or Ethereum trending upward), this could provide a tailwind for IOTA to rally. The price being at a multi-month low within a historical support zone suggests it may be undervalued, attracting value buyers or swing traders looking for a bounce. Long Trade Recommendation: Entry: Enter a long position at the current price of 0.16754, as the price is testing a historically strong support level with signs of a potential reversal. Alternatively, wait for a break above the upper boundary of the support zone (0.1850) or the descending trendline for confirmation of bullish momentum. Stop Loss: Place a stop loss just below the support zone at 0.15881 to protect against a breakdown. This keeps the risk at 5.2% (0.16754 - 0.15881 = 0.00873 / 0.16754 = 0.052). Take Profit: Conservative Target: Take partial profits at 0.21415 (27.8% gain), which aligns with the first resistance level. Primary Target: Aim for 0.22377 (33.5% gain), a key resistance level that has been tested multiple times. Stretch Target: If momentum picks up and the price breaks above the descending trendline, hold a portion of the position for 0.24505 (46.2% gain) or 0.24649 (47.1% gain, the previous high). Risk Management: Risk 1-2% of your account on this trade. For example, with a $10,000 account, risking 1% ($100) means your position size should be adjusted so that a 5.2% drop (from 0.16754 to 0.15881) equals $100. This would allow a position size of approximately $1,923 (since $1,923 * 0.052 = $100). Trade Management: If the price breaks above 0.1850 and the descending trendline, this confirms the bullish setup. Consider trailing your stop loss to lock in profits as the price hits each resistance level (e.g., move the stop to breakeven after hitting 0.21415). Why Long?: The price is at a strong support zone (0.15881–0.1850), with historical evidence of bounces from this level. A potential double-bottom reversal pattern is forming at 0.15881, signaling the end of the downtrend. The risk-to-reward ratio is excellent, with a 5.2% risk for a potential 27.8%–47.1% reward. The consolidation in the support zone suggests selling pressure is fading, and buyers may step in to push the price higher. A break above the descending trendline would confirm a trend reversal, potentially leading to a significant rally. If the broader crypto market is bullish or IOTA announces positive developments (e.g., IoT partnerships or network upgrades), this could act as a catalyst for a rally.
GoodTarget
WUSD/T (Wormhole Token/Tether) - 4H Timeframe: Long it

Key Observations: Price at a Critical Support Zone: The current price is at 0.08320, sitting squarely within a well-defined "Buy Zone" between 0.08320 and 0.09263 (blue shaded area). This zone has acted as a strong support in the past, as evidenced by the price bouncing off this level multiple times in mid-March. The price has just touched the lower boundary of this buy zone, which historically has been a springboard for upward moves, making it an ideal entry point for a long position. Potential Reversal Setup: After a significant downtrend from late March (where the price dropped from 0.1400 to 0.08320), the price has consolidated in this buy zone, showing signs of stabilization. The sharp decline appears to have exhausted selling pressure, and the lack of further breakdown below 0.08320 suggests buyers are stepping in to defend this level. The chart shows a potential double-bottom pattern forming around 0.08320, a bullish reversal pattern that often signals the end of a downtrend. Take-Profit Levels (TP) and Risk-Reward: The chart marks several take-profit levels for a long trade: TP1: 0.09546 (just above the buy zone, a 14.8% gain from 0.08320) TP2: 0.1000 (20.2% gain) TP3: 0.11629 (39.8% gain) TP4: 0.12438 (49.5% gain) The stop-loss level is marked at 0.07265 (purple shaded area), which is 12.7% below the current price. This provides an excellent risk-to-reward ratio, especially if targeting TP2 or higher (e.g., 20.2% gain vs. 12.7% risk for TP2, a 1.6:1 R:R). Volume and Momentum: While volume isn’t directly shown, the sharp drop in late March likely came with high selling volume, which has since tapered off as the price consolidates in the buy zone. This suggests selling pressure is diminishing. The consolidation phase in the buy zone, with smaller candlestick ranges, indicates reduced volatility and a potential buildup for a breakout to the upside. Broader Market Context: Wormhole Token (W) is a cross-chain protocol token, often influenced by DeFi and interoperability trends in the crypto space. As of March 30, 2025, if the broader crypto market is showing signs of recovery (e.g., Bitcoin or Ethereum trending upward), this could provide a tailwind for smaller altcoins like Wormhole to rally. The price being at a multi-month low (0.08320) suggests it may be undervalued, attracting value buyers or swing traders looking for a bounce. Long Trade Recommendation: Entry: Enter a long position at the current price of 0.08320, as the price is testing a historically strong support level with signs of a potential reversal. Stop Loss: Place a stop loss just below the marked stop-loss level at 0.07265 to protect against a breakdown. This keeps the risk at 12.7%. Take Profit: Conservative Target: Take partial profits at TP1 (0.09546) for a 14.8% gain. Primary Target: Aim for TP2 (0.1000) for a 20.2% gain, which is a realistic target given the price’s historical resistance at this level. Stretch Target: If momentum picks up, hold a portion of the position for TP3 (0.11629) or TP4 (0.12438) for gains of 39.8% or 49.5%, respectively. Risk Management: Risk 1-2% of your account on this trade. For example, with a $10,000 account, risking 1% ($100) means your position size should be adjusted so that a 12.7% drop (from 0.08320 to 0.07265) equals $100. This would allow a position size of approximately $787 (since $787 * 0.127 = $100). Trade Management: If the price breaks above 0.09263 (upper boundary of the buy zone), this confirms the bullish setup. Consider trailing your stop loss to lock in profits as the price hits each TP level. Why Long?: The price is at a strong support level (0.08320–0.09263), with historical evidence of bounces from this zone. A potential double-bottom reversal pattern is forming, signaling the end of the downtrend. The risk-to-reward ratio is highly favorable, with a 12.7% risk for a potential 20.2%–49.5% reward. The consolidation in the buy zone suggests selling pressure is fading, and buyers may step in to push the price higher. If the broader crypto market is bullish or Wormhole announces positive developments, this could act as a catalyst for a rally.
GoodTarget
Hedera (HBAR) Breakdown: Short It

Hedera (HBAR) is flashing bearish signals on the 4H chart! With price rejecting resistance and failing to hold key support, a major downside move could be incoming. The 200 MA continues to trend down, acting as strong resistance, while price struggles to gain momentum. Traders eyeing short positions should watch for rejection near $0.182 and target potential downside levels at $0.127 or lower. The risk-to-reward setup looks favorable, with a tight stop above the rejection zone. 📉 Key Levels: 🔴 Resistance: $0.182 🟢 Support Target: $0.127 📊 200 MA Resistance: $0.203 If bearish momentum continues, HBAR could break lower, making this a strong short opportunity! #Hedera #HBAR #CryptoTrading #ShortTrade #Bitcoin #BearishSignal
GoodTarget
SUI/USDT Price Action & Trade Setup – Key Support & Resistance L

This 1-hour chart of SUI/USDT showcases a significant price drop, with the price currently testing a key support level around $2.275. The highlighted red zone represents a resistance area near $2.345, while the blue zone indicates a potential downside target if the bearish momentum continues. The 200-period moving average (MA) at $2.4416 suggests that the price is trading below a key dynamic resistance level. Traders should watch for potential rejection at resistance or a breakdown below support to confirm further movement.
GoodTarget
Render (RNDR) Price Breakout: Is a Rally to $5+ on the Horizon?
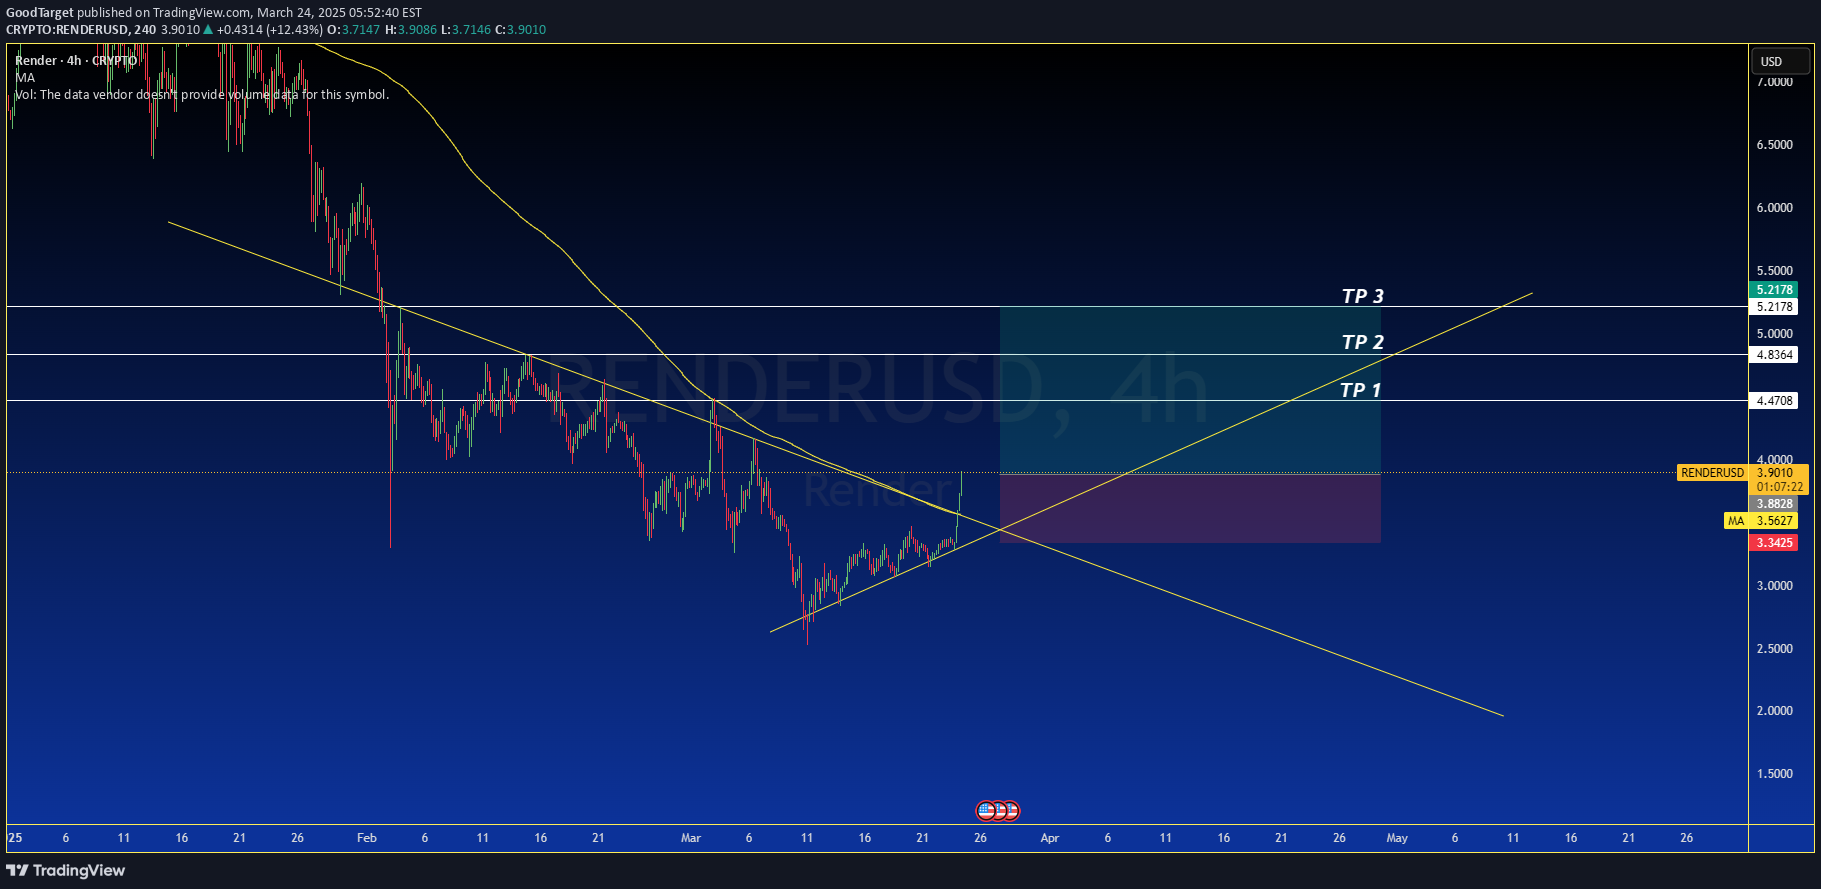
RNDR/USD 4H Chart Analysis – Strong Bullish Breakout Ahead? Render Token (RNDR) has just broken a key trendline resistance, signaling a potential strong uptrend. Here’s why traders should pay close attention to this breakout. 🔥 Key Insights: ✅ Breakout Confirmation: The price has pushed above a long-term descending trendline, indicating bullish momentum. ✅ Retest & Continuation? A successful hold above the $3.90 - $4.00 zone could confirm the breakout and lead to higher price targets. ✅ Key Targets (Take Profits): 🎯 TP1: $4.47 – First resistance level. 🎯 TP2: $4.83 – Major resistance zone. 🎯 TP3: $5.21 – Strong psychological level. ✅ Moving Average Support: Price is now trading above the MA (3.56), acting as dynamic support. 📈 Trading Outlook: If RNDR holds above $3.90, buyers could push the price towards the $4.50 - $5.20 range in the coming sessions. A rejection here may lead to a retest around $3.50-$3.60 before another push higher. 🚨 Bullish or Bearish? This is a strong bullish setup, but confirmation above $4.00 with volume is key for sustained momentum. Keep an eye on Bitcoin and market sentiment!
GoodTarget
Ethereum Classic (ETC) Breakout Alert: Is $20+ the Next Stop?
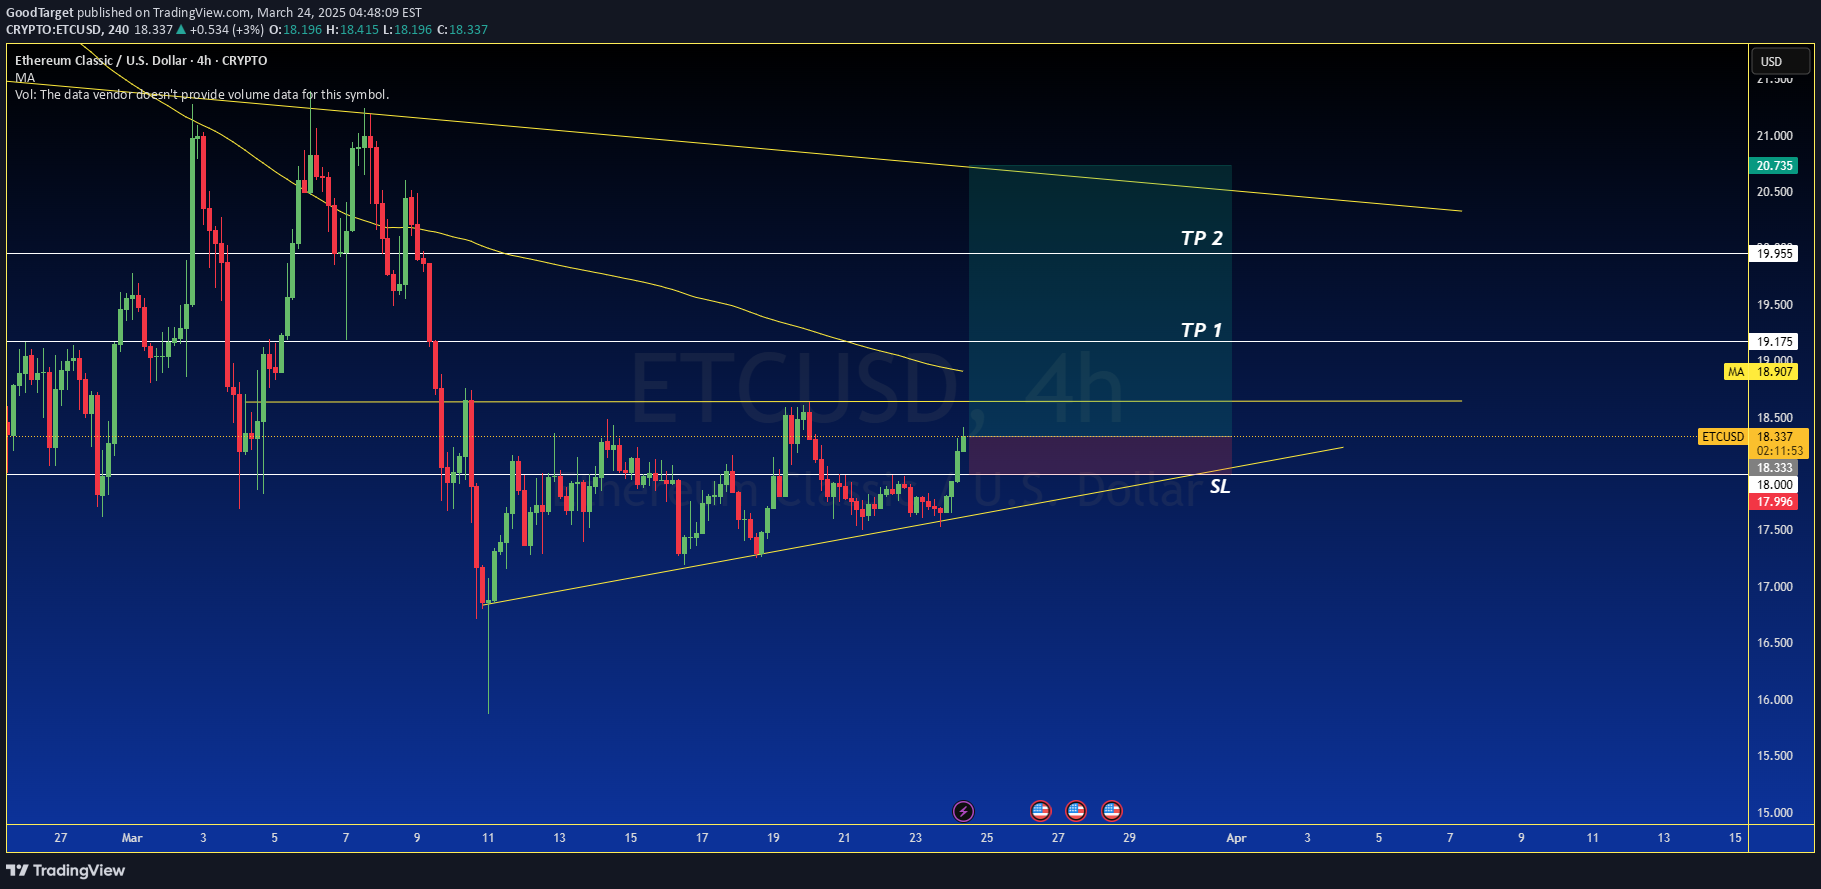
ETC/USD 4H Chart Analysis – Bullish Momentum Incoming? Ethereum Classic (ETC) is showing signs of a potential breakout, as seen in the 4-hour chart. Here’s a deep dive into the technical setup and what traders should watch for in the coming sessions. 🔥 Key Takeaways: ✅ Ascending Triangle Formation: A strong bullish pattern, indicating possible upside continuation. ✅ Breakout Confirmation: Price has pushed above a key resistance level, suggesting buyers are stepping in. ✅ Targets in Sight: 🎯 TP1: Around $19.17 (previous resistance) 🎯 TP2: Around $19.95 (strong historical supply zone) ✅ Support & Risk Management: Stop-Loss (SL): Placed around $18.00, ensuring a good risk-to-reward ratio. ✅ Moving Averages: Price is approaching the 200MA, a key dynamic resistance around $18.90—a break above this would confirm further bullish momentum. 📈 Trading Outlook: If ETC holds above $18.30 and successfully flips $18.90 into support, we could see a quick move towards $19.95+. However, rejection at this level could lead to a pullback towards the $18.00 region. 🚨 Bullish or Bearish? This setup leans bullish, but confirmation of a clean breakout above $19.00-$19.20 will be key. Keep an eye on volume and overall market sentiment! 📊 What’s your take? Are you long or waiting for more confirmation? Drop your thoughts below! 🔥
GoodTarget
SOL/USD 4H Short Setup – Rejection at Resistance

Taking a short position here on SOL/USD as price taps into the upper resistance of the ascending channel. We’re seeing a strong reaction off the trendline, indicating potential downside movement. My stop loss is set just above at $142.34, keeping risk controlled. First target is around $130.43, followed by additional take-profit levels at $128.36, $125.92, $124.00, and $122.54. If price breaks lower, final TP sits at $118.12. Moving average at $141.07 could act as dynamic resistance, further strengthening the short setup. Watching closely for a confirmation rejection before adding more size. Let's see how this plays out.
GoodTarget
XRP/USD 15-Minute Scalping Setup – Bullish Breakout in Play

Alright, here’s my current scalp setup for XRP/USD on the 15-minute chart. Price is respecting the trendline, and we’re seeing a nice bounce off support. I’ve entered around $2.4588, with a stop set at $2.3916 to manage risk properly. Targeting $2.6436 for a solid 7.52% move, giving me a 2.76R setup—worth the shot. The moving average at $2.4022 is acting as dynamic support, and as long as price stays above, I’m holding this position. If we break higher, momentum should push us toward the target. If it rejects, I’m out with minimal damage. Let’s see how this plays out.
GoodTarget
Ethereum (ETH/USD) Price Analysis: Breakout Potential

This Ethereum (ETH/USD) 4-hour chart from TradingView presents a technical analysis focused on a potential breakout. The chart incorporates Fibonacci retracement levels, trendlines, and moving averages to identify key price levels. The price of Ethereum is currently testing a breakout above a descending trendline, suggesting a bullish reversal. Key Fibonacci levels are highlighted, with the 0.236 level at $2,120.21, 0.5 at $2,158.8, and 1.0 at $2,519.19, indicating potential resistance and support zones. The chart also outlines two take-profit (TP) targets, with TP1 around $2,321.80 and TP2 near $2,518.49. A major moving average (MA) at $2,200.00 acts as an additional resistance level. Ethereum's price is currently at $2,092.75, with bid-ask values matching at $2,092.95. The market is reacting to key support at approximately $1,996.99. A successful breakout above resistance could confirm an upward trend, while failure might lead to a retest of lower support zones. This technical setup is essential for traders monitoring ETH/USD, as it provides insight into price action, key support and resistance levels, and potential breakout opportunities based on Fibonacci retracements and trendline analysis.
GoodTarget
Solana (SOL/USDT) Scalping Strategy – Key Support Breakout & Tra

This Solana (SOL/USDT) scalping trade on the 5-minute chart highlights a high-probability long setup following a breakout above a key resistance level. After bouncing off the 129.12 moving average (MA) and holding support at $129.01, SOL is showing bullish continuation. The trade plan includes an entry at $130.31, with a stop-loss set below support at $129.01 to minimize downside risk. The take-profit target is positioned at $135.94, aligning with previous resistance and liquidity zones, ensuring an optimal risk-to-reward ratio. This setup leverages momentum trading and breakout confirmation for short-term gains. Stay updated on Solana price action, market structure, and technical indicators to refine your crypto trading strategy. #Solana #SOLUSD #CryptoScalping #BreakoutTrade #TechnicalAnalysis #CryptoTrading
Disclaimer
Any content and materials included in Sahmeto's website and official communication channels are a compilation of personal opinions and analyses and are not binding. They do not constitute any recommendation for buying, selling, entering or exiting the stock market and cryptocurrency market. Also, all news and analyses included in the website and channels are merely republished information from official and unofficial domestic and foreign sources, and it is obvious that users of the said content are responsible for following up and ensuring the authenticity and accuracy of the materials. Therefore, while disclaiming responsibility, it is declared that the responsibility for any decision-making, action, and potential profit and loss in the capital market and cryptocurrency market lies with the trader.