
Golden_Spur
@t_Golden_Spur

What symbols does the trader recommend buying?
Purchase History
پیام های تریدر
Filter
Golden_Spur
معامله در محدوده طلا (GOLD): راز ترید روزانه با استراتژی POC و سطوح دقیق خرید و فروش
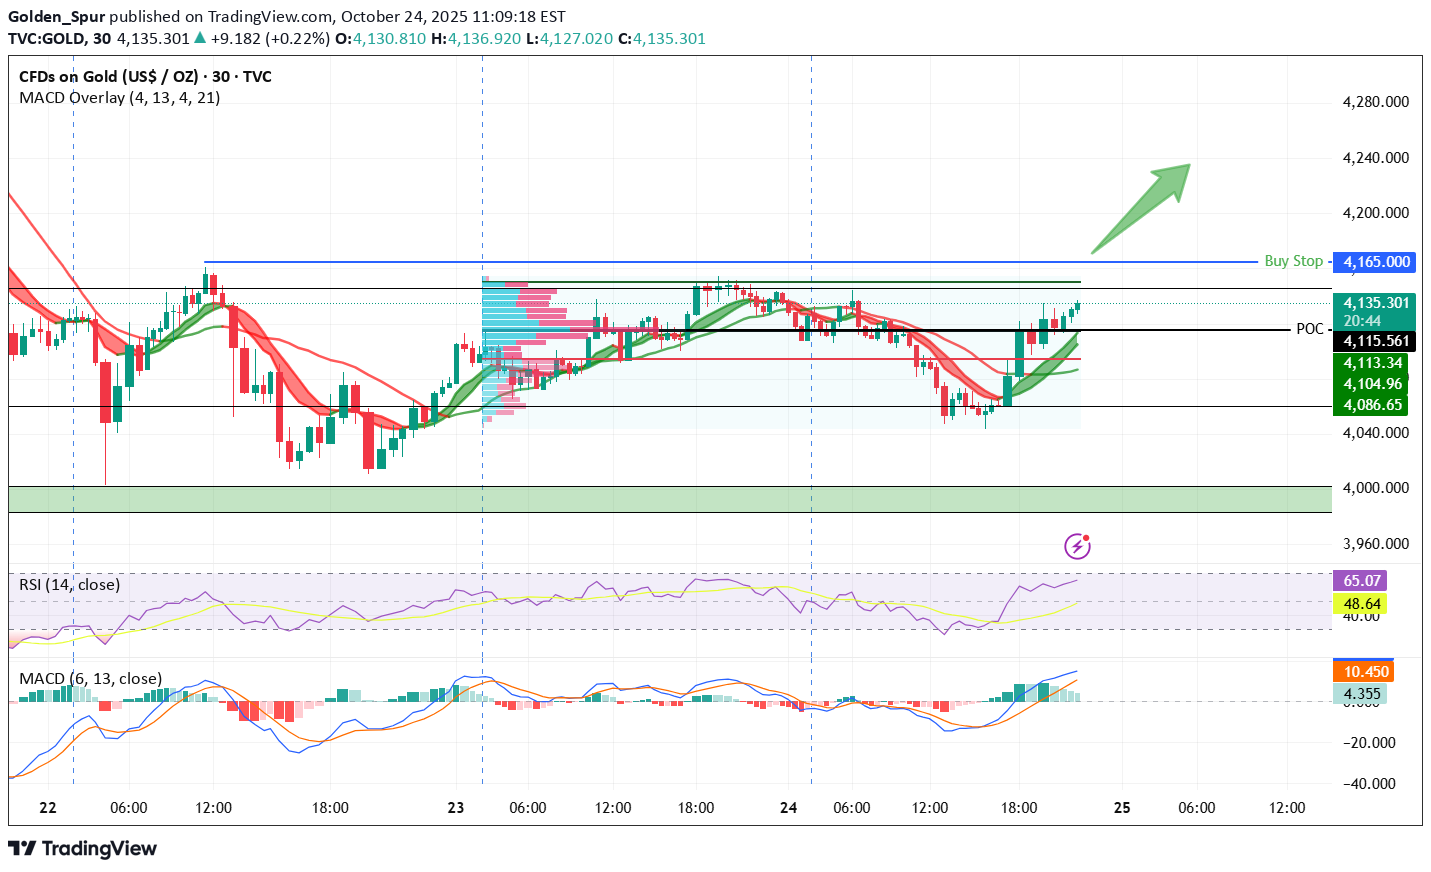
FRVP has been drawn from 0300 Hrs PST on Thursday 23 Oct 2025 till 0300 Hrs on Friday 24 Oct 2025. This is done to identify POC. The center black line is POC. The price will always come back to test POC till it is range bound in box. Therefore, for day trading just place a Buy order at bottom of box or sell order at top of box. Trade Plan 1: Sell Limit : 4146 SL: 4165 TP: 4115 Buy Limit: 4060 SL: 4040 TP: 4115 If Price goes above 4165 then Buy Stop order should be executed with SL at 4140. Then TP can be expected at previous ATH.
Golden_Spur
BTCUSD - Buy Trade Call

On daily TF, since 20 Jan 2025 BTC was in downtrend following regression channel.MACD also was mostly indicating short trade. However, now MACD is showing likely upward movement. Moreover, Williams Alligator also suggesting a likely change of trend to bullish.Coupling that with USA falling stocks, BTC is a gaining attraction of US investors. Therefore, one may take a BUY trade now or technically very correct entry would be after price crosses the resistance level ($ 88,950) which is also previous Lower High.
Golden_Spur
ETHUSDT - BUY Call- Technical Analysis- Daily TF

This pair has been seen respecting Fib retracement of 61.80%.Therefore, it is expected that it should retrace from its current bull run again to 61.80% (2770).Once, it reaches there then a BUY should be the way to go.Trade Values :-BUY Limit: 2766SL: 2335TP1: 3680TP2: 3840
Golden_Spur
XAUUSD (GOLD) - SHORT (Sell) Trade Call - Daily TF

Gold is going in bearish trend after a long bull run since June 2024. Simple Fib retracement has been drawn to identify the likely TPs.SHORT Trade CallEntry Sell:2585SL: 2608TP1: 2558TP2: 2512TP3: 2484A safer approach for this trade for those have not taken it yet is to Enter through Sell Stop at price $2577.TP1 reached; however, then trend reversed to bullish. Therefore, it triggered Stop Loss which I had manually moved to Breakeven after hitting TP-1. Therefore, trade closed without any gain or loss. Now trend is making a Bullish Pole & Flag pattern OR one may consider it making AB=CD pattern.
Golden_Spur
XAUUSD (GOLD) - Buy Trade Call 4h

After a bull run, Triangle formation has been formed. It is a prominent sign of continuation of the bull run. If bull run begins then it may go till 2892; however, a cautious approach is taken while setting TPs.Buy : 2740SL: 2723TP1: 2762TP2 : 2784I'm adding a TP at 2757 to book some profit at a major resistance zone.All TPs hit. Trade closed successfully.
Golden_Spur
ETHUSD- Swing Trade - Long Buy Call

On Daily TF Bearish Reversal Butterfly pattern has been drawn. $3000 mark is beginning of key reversal zone. No divergence on RSI is present and momentum indicator suggests that trend will continue upwards.Entry : 2600SL: 2400TP1: 2800TP2: 3000
Golden_Spur
XAUUSD - SHORT Trade Call - Bearish Butterfly Harmonic Pattern

XAUUSD- Sell Call Daily TFBearish Butterfly Harmonic pattern has been drawn. After following the pattern, it is expected that price will retrace till Fib 0.68 ($2429.30) or even further to Fib 0.786 ($2400.11). Trade values are depicted below:Entry : Instant Sell ($2482)SL : $2530TP1: $2430TP2: $2400The price has respected the Support Zone and could not break through it. Therefore, at the moment it is printing HHs and HLs indicating continuation of Bull run. It is expected to touch 2545 level. Therefore, if one wants, one can enter in LONG trade now ( around 2508 to 2512 level) with Stop Loss at 2493 and TP1 as 2530 and TP2 as 2540 respectively.For my followers, please understand that in harmonic pattern there is not a fixed retracement or projection value, rather a range is given. Therefore, in Bearish Butterfly Harmonic pattern range of point "D" is from "1.27" to "1.618" . If we draw the pattern up to 1.618 then price value comes out to be $ 2564.400 . Which conclude that the price in bullish trend will reverse Bearish around $ 2564 . That is why I have suggested taking LONG trades' TP at 2530 and 2540 to be on safer side. However, on can apply trailing stop and ride the trend at higher values even.
Golden_Spur
XAU/USD - LONG Trade Call - Pole & Flag

On 1D scale, Pole & Flag pattern has been drawn. Within Flag, Elliot wave has been drawn which is in fifth leg which may touch 2285. Also keep in mind that 5th leg is usually the weakest (shortest) and 3rd is always strongest, therefore, since 5th leg has already tested 2293 level, it may not come down any further and breakout upwards. For swing traders, 2800 is likely target for 3 months trade.Therefore, take trade on breakout of flag at around 245 or if you want to be doubly sure then at crossing of previous LH at 2368. Keep S/L at previous LL. TP can be set as per 1:2 or 1:3 RRR even.As expected, Gold price chart is retracing from the resistance zone 2361~2367. It may fall till support level 2336~2338. Therefore, Day traders may enter on SHORT position right now. However, for Swing traders, I still recommend taking LONG trade after it crosses 2368.
Golden_Spur
XAUUSD- SHORT Trade Call -4 H - Swing Trading

After systematically analyzing the Gold chart on a weekly and Daily basis, I marked the liquidity area. After tracing down the Fib, I noticed that my preferred entry at Fib 0.72 has already breached (going down). Therefore, I entered the trade at Fib 0.618.I expect the price to go down till 2300 and even may touch 2287. I will reenter if price chart breaks 2285 level. Remember it is a swing trade so it will take 2 to 5 days at least, be patient and do not disturb the values once trade is taken. My trade values are:-SHORT Trade Call -4 H - Swing TradingEntry (Sell Limit or Markt Order): 2358S/L : 2388TP1: 2330TP2: 2300TP1 has been hit.Now going for TP2.I forgot to mention that S/L for second trade has to be moved down to entry price. But I have even decided to put it at 2330 which was TP1 so that if trend starts to go up over all I end up in twice the profit if not three times.
Golden_Spur
GOLD- LONG Trade Call, Harmonic Pattern AB=CD

On 1D scale, AB=CD has been drawn. Once previous HH is broken then take Entry through Buy Stop at 2399 . Keep Stop Loss at previous Higher Low at 2277. Set TPs as per risk reward.My values are depicted on chart. At 2670 tp 2790 is Potential Reversal Zone (PRZ). One may be mindful to be vigilant of reversal.As analyzed earlier, Entry has been triggered through Buy Stop and now moving towards TP1.
Disclaimer
Any content and materials included in Sahmeto's website and official communication channels are a compilation of personal opinions and analyses and are not binding. They do not constitute any recommendation for buying, selling, entering or exiting the stock market and cryptocurrency market. Also, all news and analyses included in the website and channels are merely republished information from official and unofficial domestic and foreign sources, and it is obvious that users of the said content are responsible for following up and ensuring the authenticity and accuracy of the materials. Therefore, while disclaiming responsibility, it is declared that the responsibility for any decision-making, action, and potential profit and loss in the capital market and cryptocurrency market lies with the trader.