
Gold_Dominator333
@t_Gold_Dominator333

What symbols does the trader recommend buying?
Purchase History
پیام های تریدر
Filter
Signal Type

Hello trader, Gold (XAU/USD) has shown a powerful breakout above key resistance, signaling strong bullish momentum in the market. After a period of consolidation, price surged higher, confirming buyers’ dominance and opening the way for further upside potential. With the breakout holding firm, the market is eyeing higher targets as momentum builds, making this move an important signal of strength in the ongoing uptrend.

Hello traders, This chart of ETH/USD captures the way Ethereum flows through phases of expansion, correction, and renewed momentum. Break of structures (BOS), retests, and consolidations highlight how price action respects both upward drives and corrective pullbacks. Instead of focusing on a single move, the perspective emphasizes Ethereum’s evolving rhythm — where each rise and retracement reflects the balance between buyers and sellers in the market.

Hello traders, From this perspective, BTC/USD reflects how market structure evolves through break of structures (BOS), pullbacks, and shifting momentum. The chart highlights phases of expansion followed by correction, showing how buyers and sellers contest key zones. Instead of focusing on signals, this view captures the broader rhythm of Bitcoin’s movement, where every push and retracement tells the story of changing sentiment and market flow.350 pips covered wait for other.

Hello traders, From this perspective, XAU/USD shows how market structure shifts over time. The chart highlights break of structures (BOS), retests, and the transition from downward pressure to upward momentum. It reflects how price action respects key zones, retesting old levels before expanding into new ranges. This visualization offers a broader outlook on market behavior rather than a signal, giving a clear view of how trends and corrections unfold.almost we cover over target.

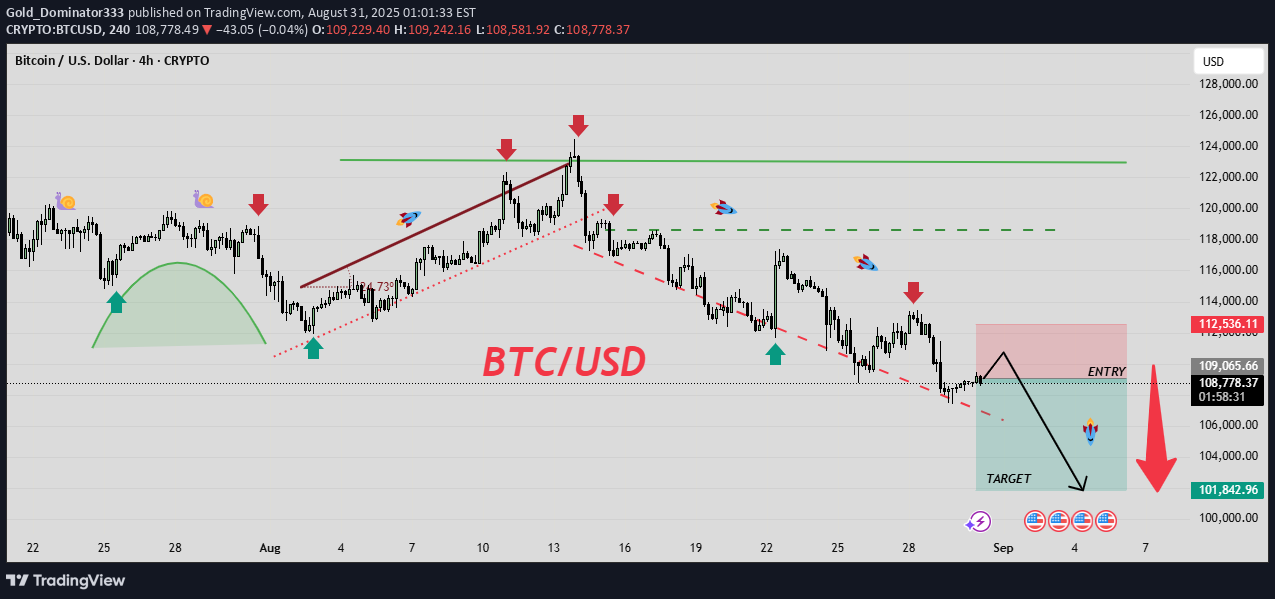
Bitcoin (BTC/USD) is struggling below key resistance after a downward trend. The setup shows a potential rejection at the entry zone, downside movement. With clear support levels marked as target, sellers could gain momentum if price fails to break higher, offering a bearish trading opportunity.almost we covered our target.250 pips coverd.

Hello traders, Gold (XAU/USD) has successfully broken above key resistance after a period of consolidation, showing strong bullish momentum. Price action suggests a potential retest near the breakout zone before continuing higher toward the target zone. The structure highlights accumulation at the lows, a clean breakout, and clear upside potential, offering traders a favorable risk-to-reward setup. likee or share your opinions.300 pips runned wait for other400 pips covered wait for other

Hello traders, Ethereum is currently facing resistance after its recent recovery attempts. Despite breaking past earlier structures, the market momentum appears to be slowing, leaving price action in a vulnerable zone. The broader outlook shows that sellers are gradually applying pressure, and unless stronger buying interest steps in, Ethereum could be heading toward a deeper corrective phase. This stage reflects how the market often consolidates before deciding its next significant direction. like and share your opinions.
Hello traders, Bitcoin is showing signs of weakness after failing to sustain its recent highs. The overall structure suggests that momentum is fading, and the market could be preparing for another leg down. While short-term fluctuations may appear, the broader outlook indicates pressure building on the downside as buyers lose control. This phase highlights how Bitcoin often struggles after extended rallies, reflecting the natural cycle of correction before stability returns. like or share your opinion about this chart.

Gold is currently moving in a strong uptrend, respecting the descending trendline. The chart highlights a clear entry zone for buyers, with a safe target zone marked for potential profit. 👉 bulliesh momentum is dominant – once the entry is confirmed, price could push smoothly toward the target. 👉 The setup offers a balanced risk-to-reward ratio, making it a safe and professional trade idea.we get our target

Gold (XAU/USD) is showing a strong downtrend move, respecting the descending trendline. After a continuous bearish wave, price has now entered a potential reversal zone. The chart highlights a clean entry point with risk well-defined below recent lows, targeting the next bullish push toward upper resistance. If the market respects this zone, we can expect a bullish correction rally toward the target area. However, if the level breaks down, further downside continuation is possible. As always, risk management is key – let the price action confirm before jumping in.200-pips-coveredwe get our target
Disclaimer
Any content and materials included in Sahmeto's website and official communication channels are a compilation of personal opinions and analyses and are not binding. They do not constitute any recommendation for buying, selling, entering or exiting the stock market and cryptocurrency market. Also, all news and analyses included in the website and channels are merely republished information from official and unofficial domestic and foreign sources, and it is obvious that users of the said content are responsible for following up and ensuring the authenticity and accuracy of the materials. Therefore, while disclaiming responsibility, it is declared that the responsibility for any decision-making, action, and potential profit and loss in the capital market and cryptocurrency market lies with the trader.