GoldSight_Signals
@t_GoldSight_Signals

What symbols does the trader recommend buying?
Purchase History
پیام های تریدر
Filter
Düşüş trend çizgisi yakınında Bitcoin

Bitcoin son dönemde net bir destek bölgesinden tepki aldı ve kısa vadeli alım ilgisi gösterdi. Ancak fiyat şu anda düşüş trend çizgisinin altında işlem görüyor, bu da satıcıların kontrolü elinde tuttuğunu gösteriyor. Fiyat bu çizginin altında kaldığı sürece geri çekilme olasıdır. Price action açısından BTC önce 87.000 civarındaki destek bölgesine düşebilir. Bu seviye kırılırsa, izlenecek bir sonraki önemli alan 84.500 civarındaki talep bölgesidir. Bu analiz yalnızca price action ve piyasa yapısına dayanmaktadır. Eğitim amaçlıdır, yatırım tavsiyesi değildir.
Bitcoin Price Action Near Bearish Trendline
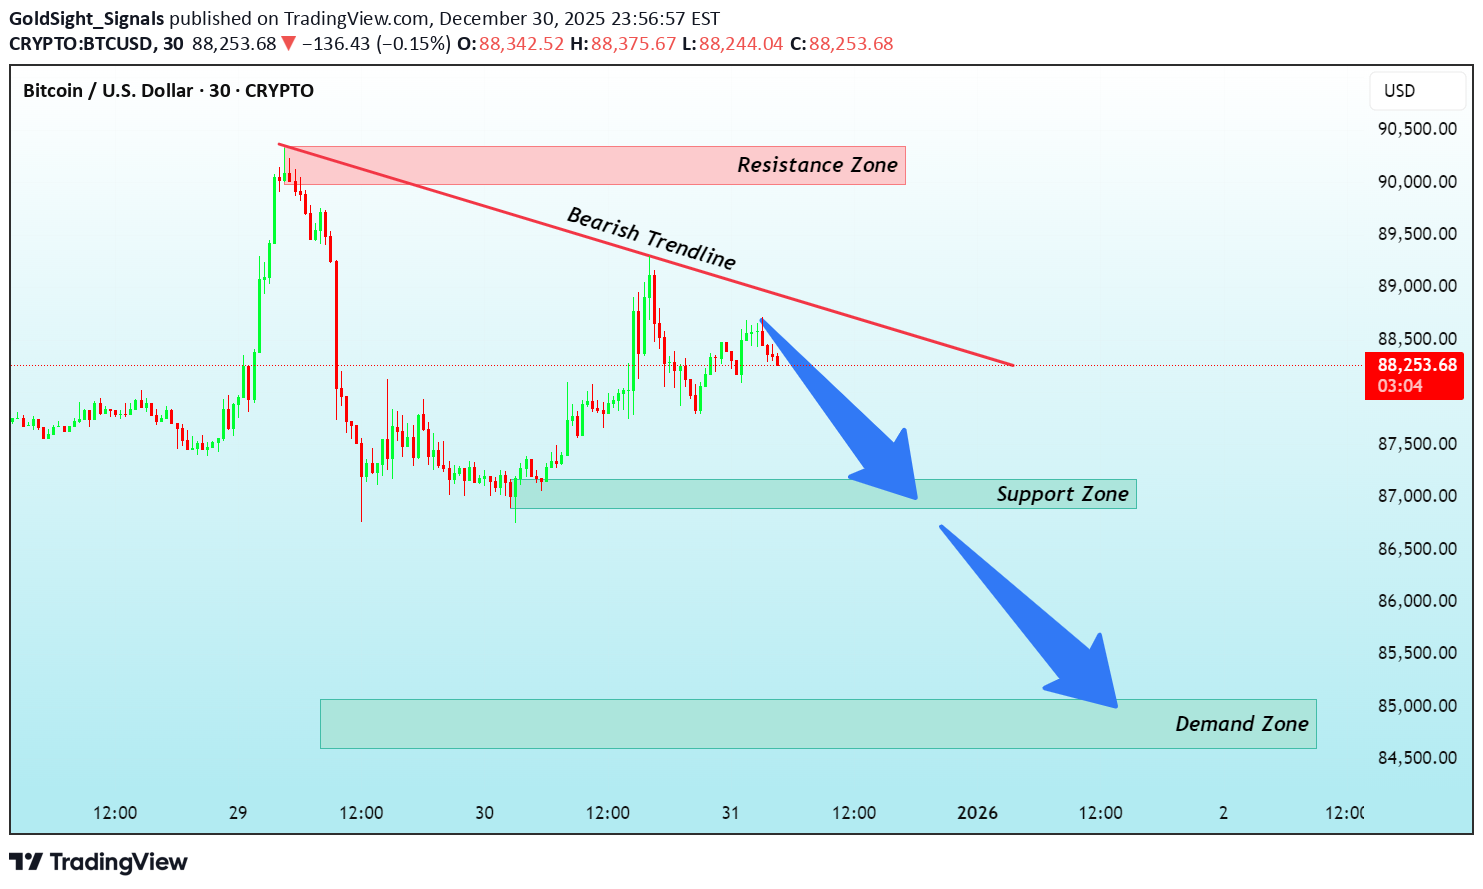
Bitcoin recently bounced from a clear support zone, showing short-term buying interest. However, price is now trading below a bearish trendline, which suggests that sellers are still in control. As long as price remains below this trendline, a pullback is likely. From a price action perspective, BTC may first move down toward the support zone around 87,000, where price could react. If this level fails to hold, the next important area to watch is the demand zone near 84,500, where stronger buying interest may appear. This analysis is based purely on price action and market structure, focusing on how price reacts around key levels. This is shared for educational purpose only. Not financial advice.
الذهب؛ مراقبة حركة السعر بالقرب من الدعم
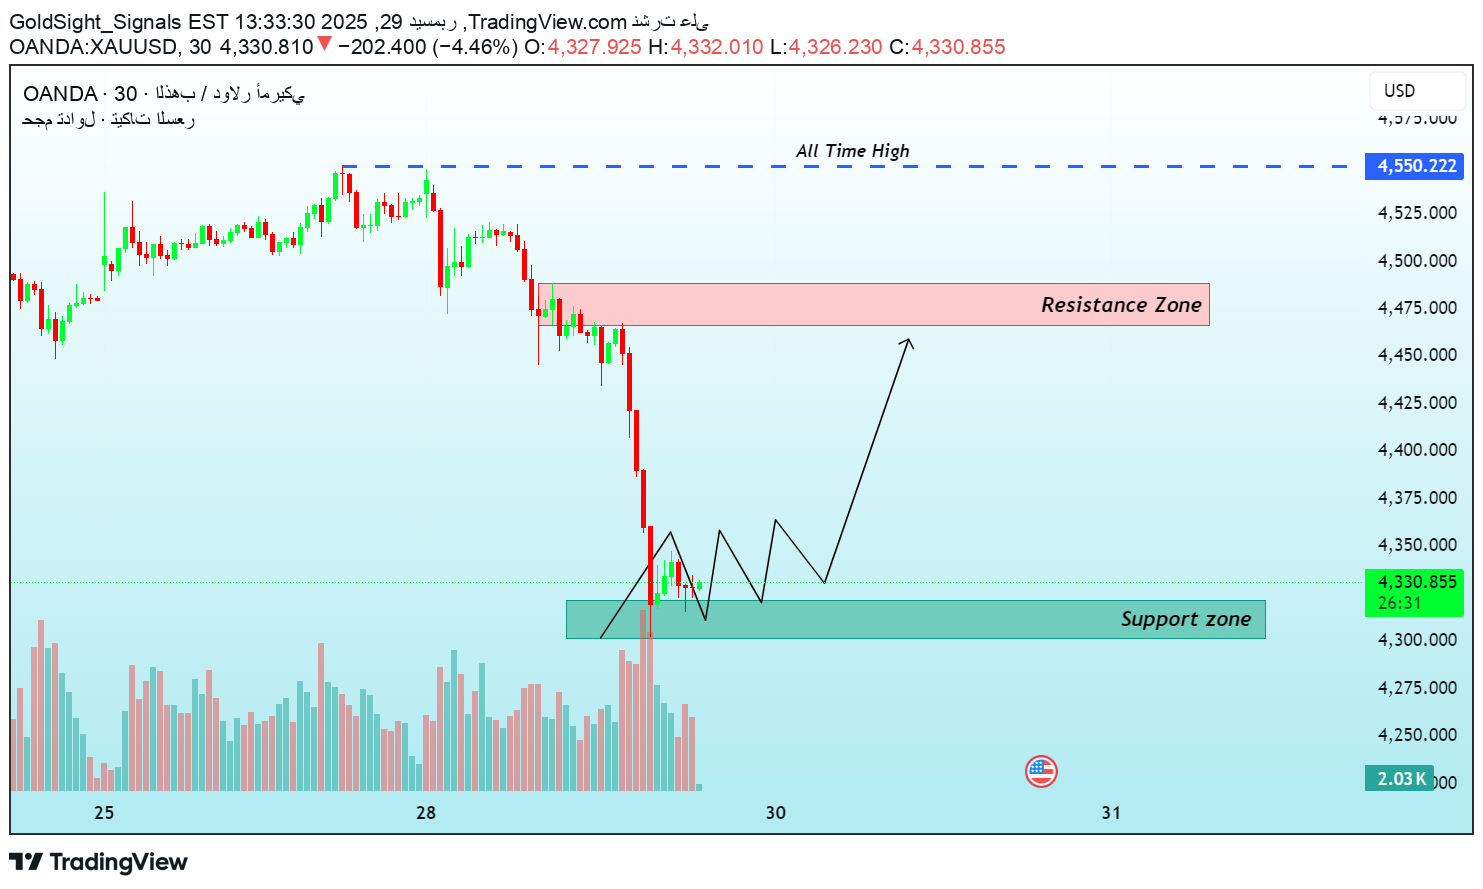
انخفض سعر الذهب خلال الجلسة الآسیویة واستمر فی الانخفاض خلال جلسة نیویورک. السعر الآن بالقرب من منطقة دعم مهمة عند 4321–4301. مناطق الدعم هی أماکن قد یتباطأ فیها السعر أو یظهر رد فعل. من هذه المنطقة، یمکن للسعر أن یرتفع نحو منطقة المقاومة 4466–4490 إذا تدخل المشترون. هذه المنطقة کانت سابقًا مکانًا للضغط البیعی. إذا بقی السعر فوق الدعم، فهذا یدل على قوة المشترین. إذا انخفض السعر تحت منطقة الدعم، فإن هذه الفکرة لن تکون صالحة بعد الآن. مراقبة حرکة السعر عند الدعم تساعد على فهم الحرکة التالیة المحتملة. لأغراض تعلیمیة فقط، لیست نصیحة مالیة.
Altın; Destek Bölgesi Yakınında Fiyat Davranışını İzleme
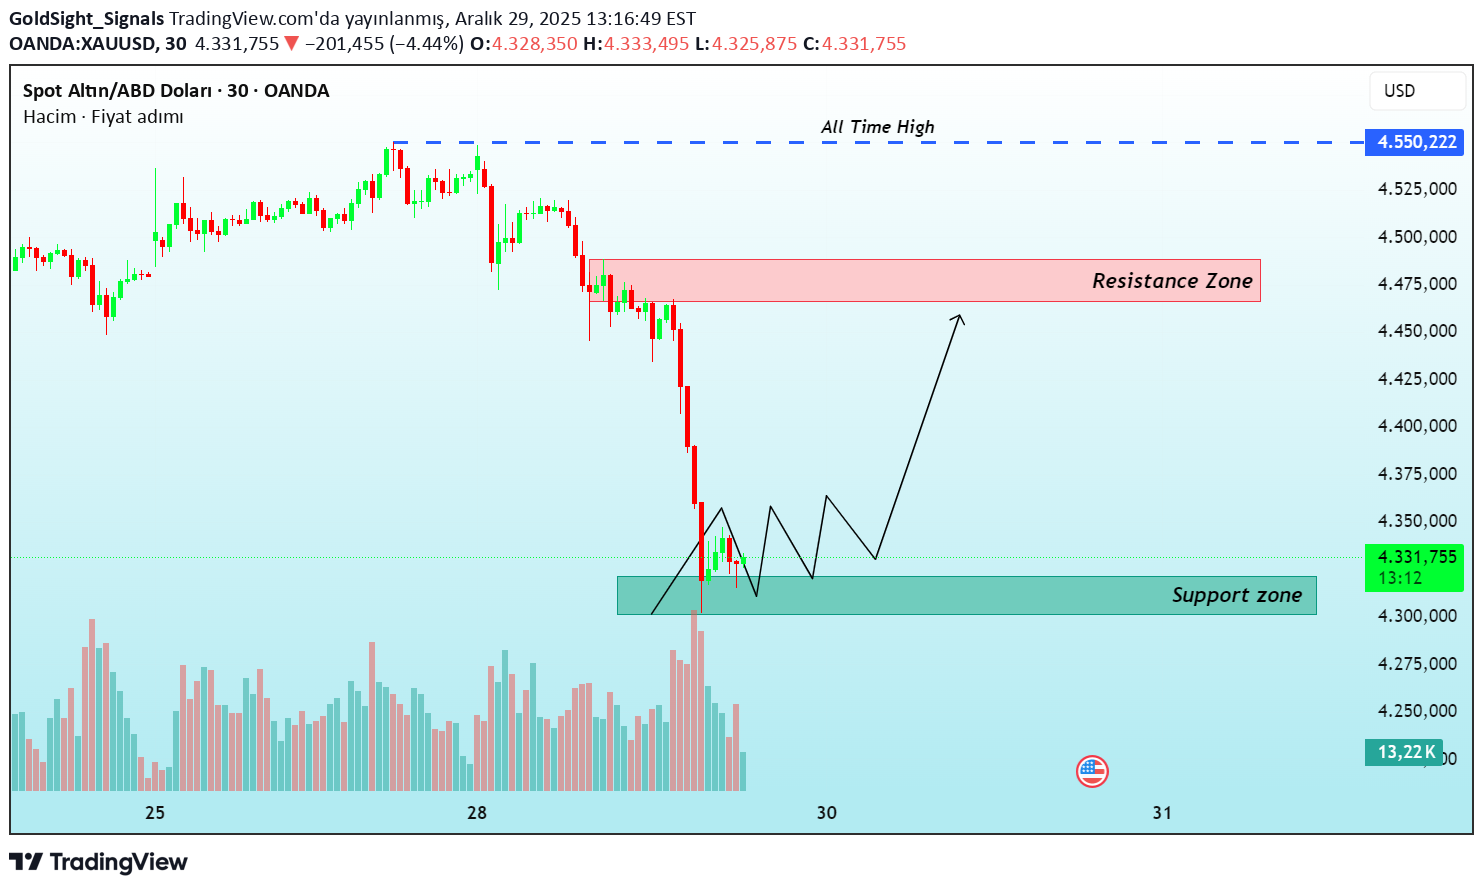
Altın fiyatı Asya seansı sırasında düştü ve New York seansında da aşağı yönlü hareketini sürdürdü. Şu anda 4321–4301 aralığındaki önemli bir destek bölgesinde işlem görüyor. Destek bölgeleri, fiyatın yavaşlayabileceği veya tepki verebileceği alanlardır. Bu bölgeden fiyat, alıcılar devreye girerse 4466–4490 direnç bölgesine doğru yükselebilir. Bu direnç bölgesi, fiyatın daha önce satış baskısıyla karşılaştığı alandır. Fiyat destek üzerinde kalırsa, bu alıcıların gücünü gösterir. Fiyat destek bölgesinin altına düşerse, bu fikir geçersiz olur. Destekte fiyat davranışını izlemek, bir sonraki olası hareketi anlamaya yardımcı olur. Eğitim amaçlı paylaşılmıştır, finansal tavsiye değildir.
Gold; Observing Price Behavior Near Support.

Gold price dropped during the Asian session and continued to move lower in the New York session. It is now trading near an important support zone around 4321–4301. Support zones are areas where price may slow down or react. From this area, price can move up toward the resistance zone at 4466–4490 if buyers step in. This resistance zone is where price previously faced selling pressure. If price holds above the support, it shows strength from buyers. If price drops below the support zone, this idea will no longer be valid. Watching price behavior at support helps understand the next possible move. This is shared for educational purposes not financial advice.
نظرة على حركة الذهب للأسبوع القادم
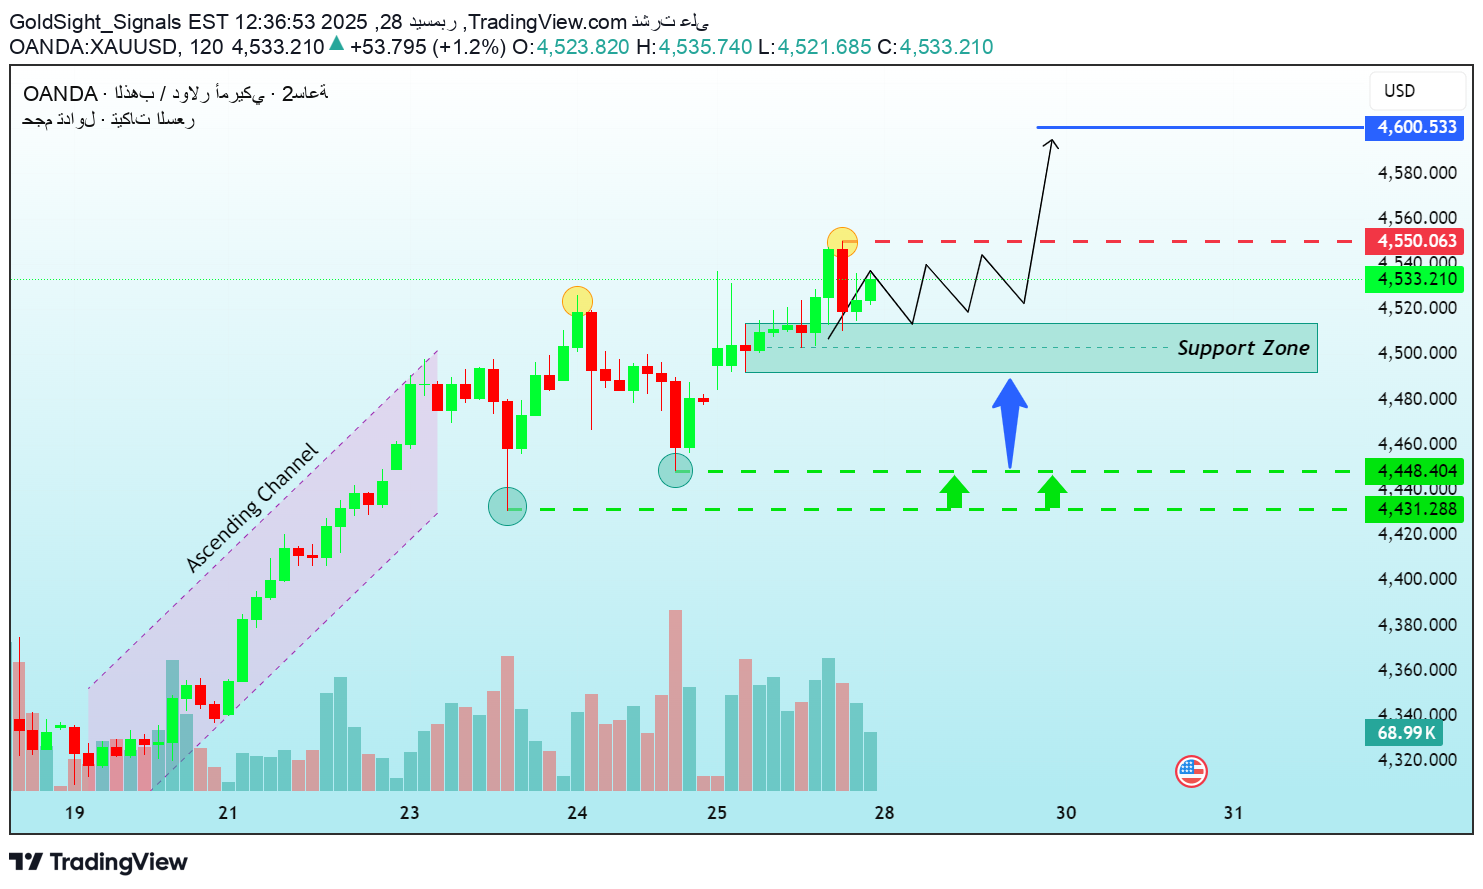
أغلق الذهب الأسبوع الماضی عند حوالی 4533 بعد أن سجل ارتفاعًا قرب 4550. الرفض عند المستویات العلیا یشیر إلى إرهاق قصیر المدى بعد حرکة صعودیة ممتدة. من منظور سلوک السعر (Price Action)، قد یبحث السوق أولاً عن السیولة والتوازن. قد یکون التراجع نحو منطقة الدعم 4513–4493 حرکة تصحیحیة طبیعیة، حیث لوحظ اهتمام الشراء سابقًا. إذا حصل السعر على قبول ورد فعل صعودی فی هذه المنطقة، فقد یشکل قاعدة لاستمرار محتمل نحو مستویات أعلى، مع اعتبار 4600 مستوى مرجعی مهم. هذا التحلیل قائم على هیکل السوق وسلوک السعر فقط، ولا یُعد توقعًا. دائمًا انتظر التأکید وأدر المخاطر. المشارکة لأغراض تعلیمیة ولیست نصیحة مالیة.
Önümüzdeki Hafta için Altın Fiyat Hareketi Görünümü
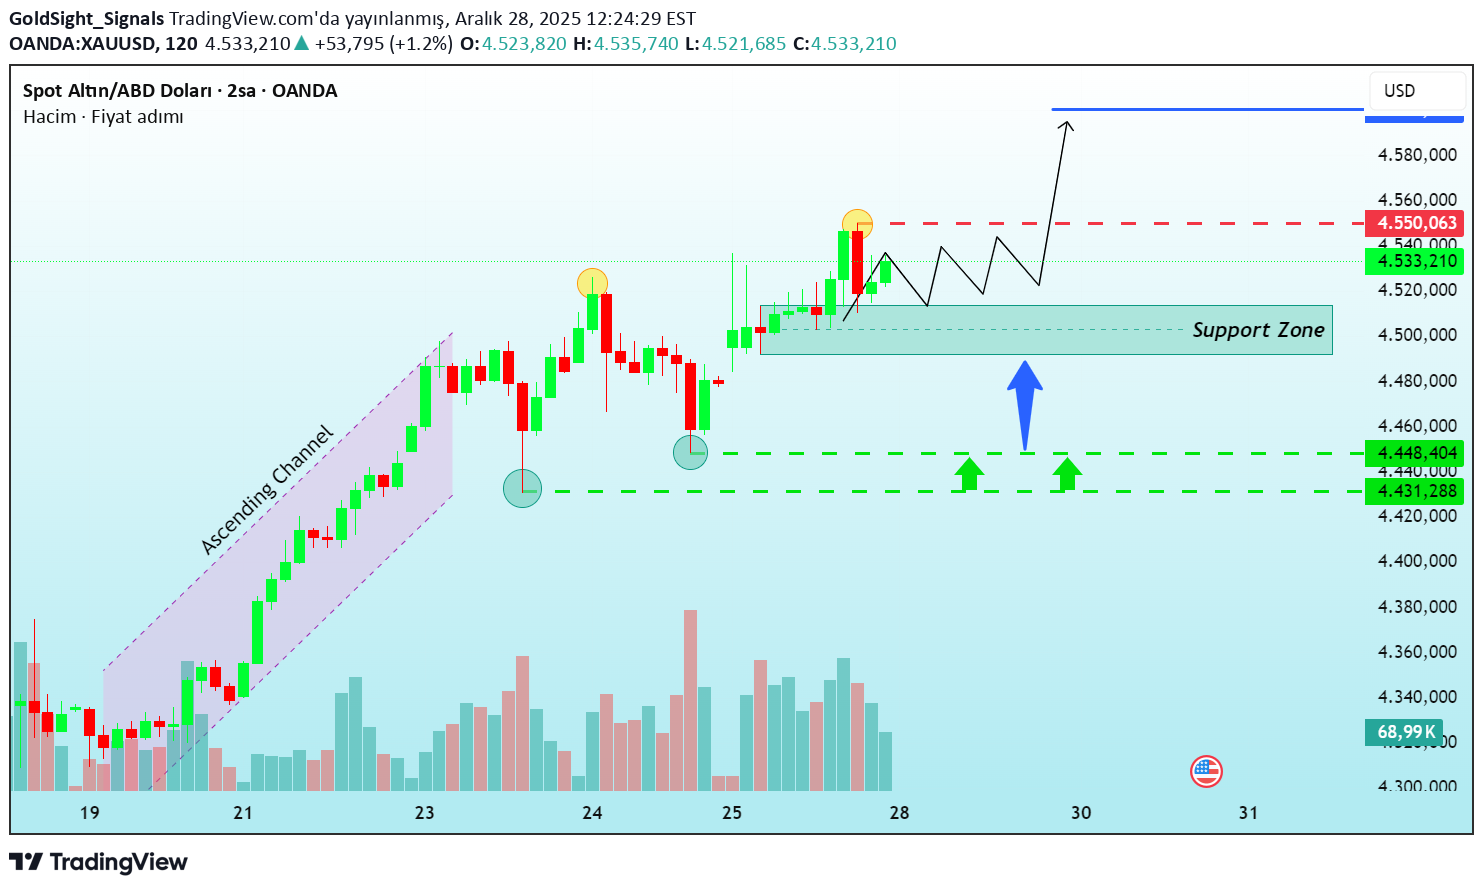
Altın, 4550 civarında bir zirve yaptıktan sonra önceki haftayı 4533 seviyelerinde kapattı. Üst seviyelerden gelen bu reddedilme, güçlü bir yükselişin ardından kısa vadeli yorgunluğa işaret ediyor. Price action bakış açısına göre piyasa önce likidite ve denge arayabilir. 4513–4493 destek bölgesine doğru bir geri çekilme normal bir düzeltme hareketi olacaktır; bu bölgede daha önce alıcı ilgisi görülmüştü. Fiyat bu destek alanında kabul görür ve yukarı yönlü bir tepki verirse, daha yüksek seviyelere doğru olası bir devam için zemin oluşabilir. Büyük resimde 4600 önemli bir referans seviyesi olarak izlenebilir. Bu analiz tamamen piyasa yapısı ve fiyat davranışına dayalıdır, tahmin içermez. Her zaman teyit bekleyin ve riski yönetin. Eğitim amaçlı paylaşılmıştır, yatırım tavsiyesi değildir.
Gold Price Action Outlook for the Coming Week

Gold closed the previous week around 4533 after printing a high near 4550. This rejection from higher prices suggests short-term exhaustion after an extended move. From a price action perspective, the market may first look for liquidity and balance. A pullback toward the nearby support zone around 4513–4493 would be a normal corrective move, where buyers previously showed interest. If price finds acceptance and bullish reaction within this support area, it could build a base for a potential continuation toward higher levels, with 4600 acting as a key upside reference in the bigger picture. This analysis is based purely on market structure and price behavior, focusing on how price typically reacts around important zones rather than predicting outcomes. Always wait for confirmation and manage risk accordingly. This is shared for educational purposes not financial advice.
Altın trend çizgisinden geri çekildi, talep bölgesi 4420 hedefte
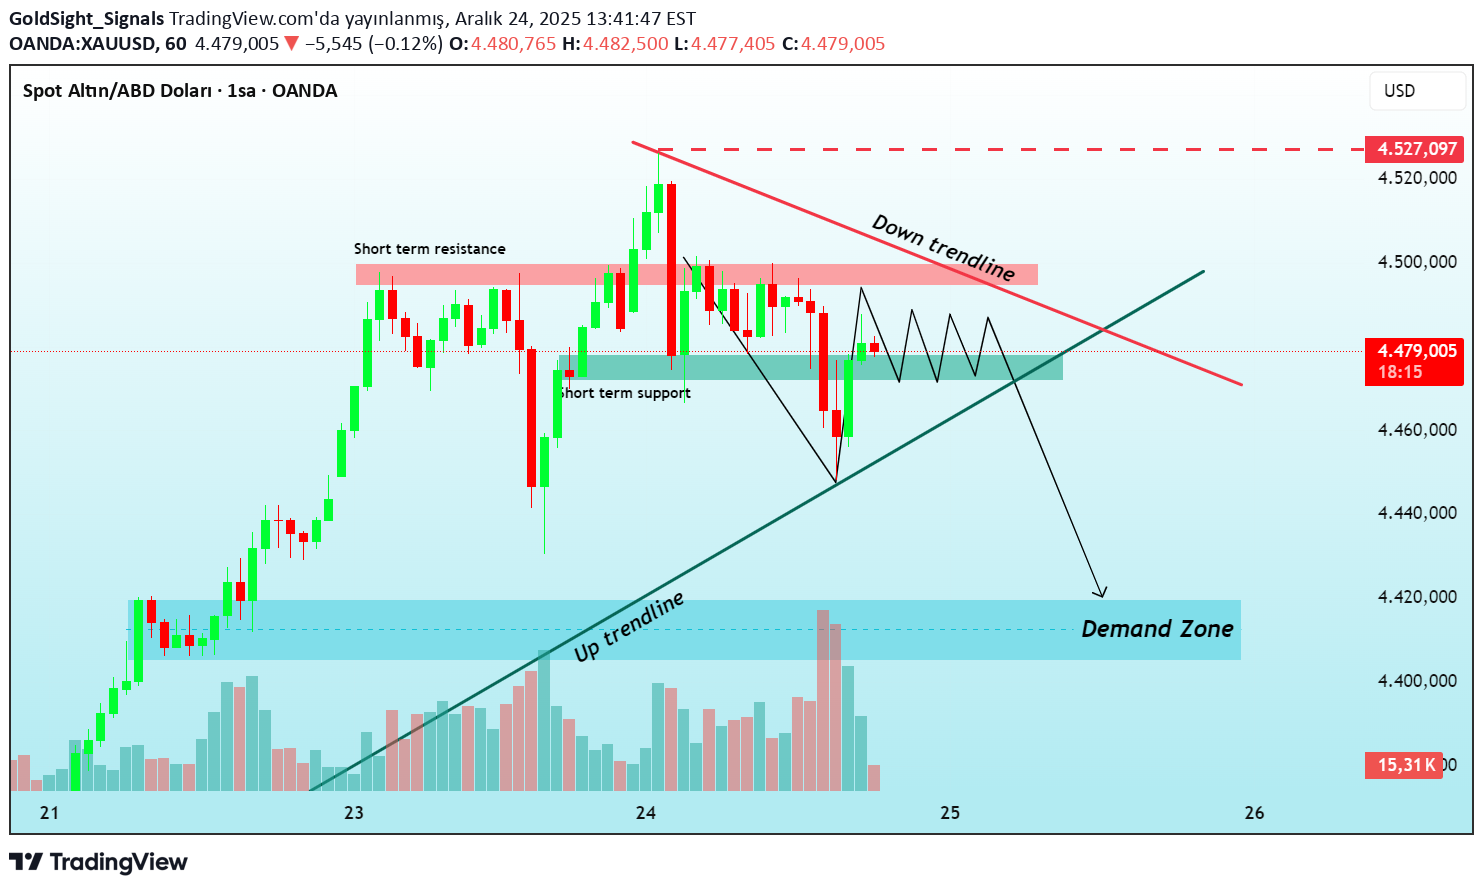
Altın fiyatı kısa vadeli bir direnç bölgesinden geriledi ve yakın bir destek bölgesini kırarak kısa vadeli zayıflık gösterdi. Fiyat yükselen trend çizgisine değdiğinde, altında bulunan stop-loss’ları tetiklediği görülüyor ve ardından kısa vadeli direnç bölgesine doğru toparlandı. Ancak, önceki destek bugün tutmadığı için genel yapı hâlâ baskı altında. Bu durum, 4420 civarındaki talep bölgesine doğru olası bir hareketin yolunu açıyor; bu seviyede alıcı tepkisi önemli olacak. Pozisyon almadan önce fiyat hareketinden net bir teyit beklemek daha güvenli. Bu yalnızca eğitim amaçlıdır, finansal tavsiye değildir.
Gold Pullback Hits Trendline, Eyes Demand Zone 4420
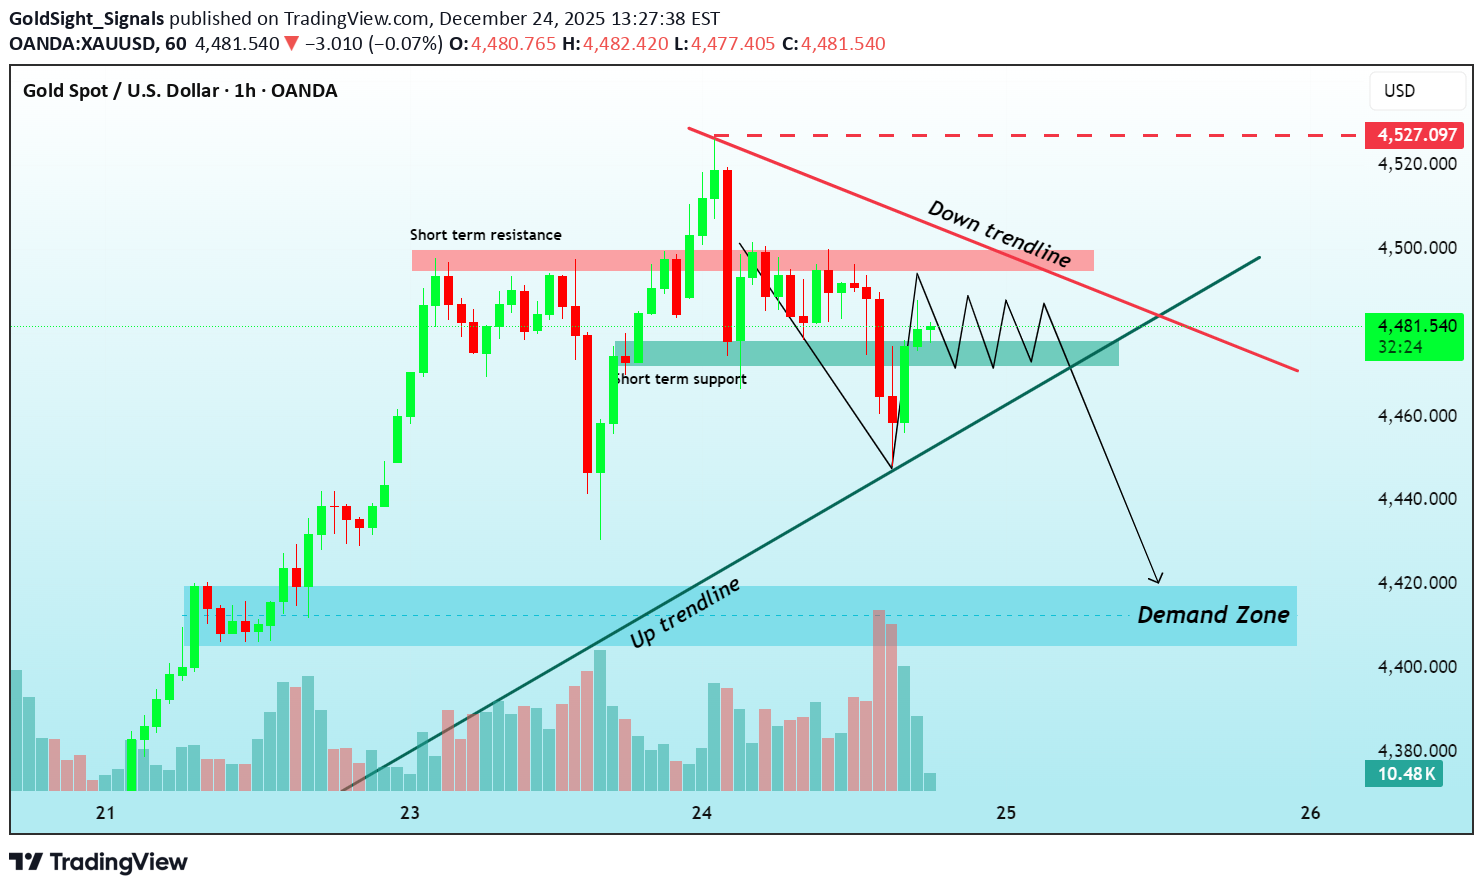
Gold price recently pulled back from a short-term resistance area and moved through a nearby support zone, indicating short-term weakness. As price dipped into the rising trendline, it appears to have hunted stop losses resting below the structure before reacting and pushing back toward the short-term resistance area. However, since the earlier support failed to hold during today’s session, the overall structure still suggests pressure on the downside. This opens the path for a potential move toward the demand zone around 4420, where stronger buying interest may emerge. This level will be key to observe, and it is more prudent to wait for clear confirmation from price action at the demand zone before forming the next directional bias. This is shared purely for educational purposes not financial advice.
Disclaimer
Any content and materials included in Sahmeto's website and official communication channels are a compilation of personal opinions and analyses and are not binding. They do not constitute any recommendation for buying, selling, entering or exiting the stock market and cryptocurrency market. Also, all news and analyses included in the website and channels are merely republished information from official and unofficial domestic and foreign sources, and it is obvious that users of the said content are responsible for following up and ensuring the authenticity and accuracy of the materials. Therefore, while disclaiming responsibility, it is declared that the responsibility for any decision-making, action, and potential profit and loss in the capital market and cryptocurrency market lies with the trader.