
GKTrademanthan
@t_GKTrademanthan

What symbols does the trader recommend buying?
Purchase History
پیام های تریدر
Filter
GKTrademanthan
تحلیل تکنیکال فوری: آیا اتریوم به زودی اوج جدید ۴۲۸۰ دلاری را میبیند؟

The chart displays Ethereum (ETH/USD) on a 30-minute timeframe, with a technical analysis predicting a potential upward movement using labeled wave structures (A to G). Here's a summary: Key Elements: Channel Analysis: Price is moving within an upward channel bounded by two black trendlines. Breakout Zone: The previous downtrend (marked by a diagonal black resistance) was broken near point A, initiating a potential bullish reversal. Wave Structure: A → B → C → D: Price formed higher lows and higher highs within the channel. Predicted Move: The chart projects a bullish continuation from point D to: E (around $4,108) A minor pullback to F ($4,003) Then a final push to G (around $4,280) Support & Resistance Levels: Support Zones: Around $3,800 (highlighted grey box) and $4,003 (F wave). Resistance Zones: $4,108 (E wave) and $4,280 (G wave). Conclusion: The chart suggests a bullish wave pattern is forming, with potential short-term pullbacks before pushing toward higher resistance levels. The trader anticipates ETH to follow a wave-like climb within the rising channel.
GKTrademanthan
بیت کوین آماده جهش ۲۸ درصدی؟ پیشبینی صعود انفجاری از مثلث قیمتی!
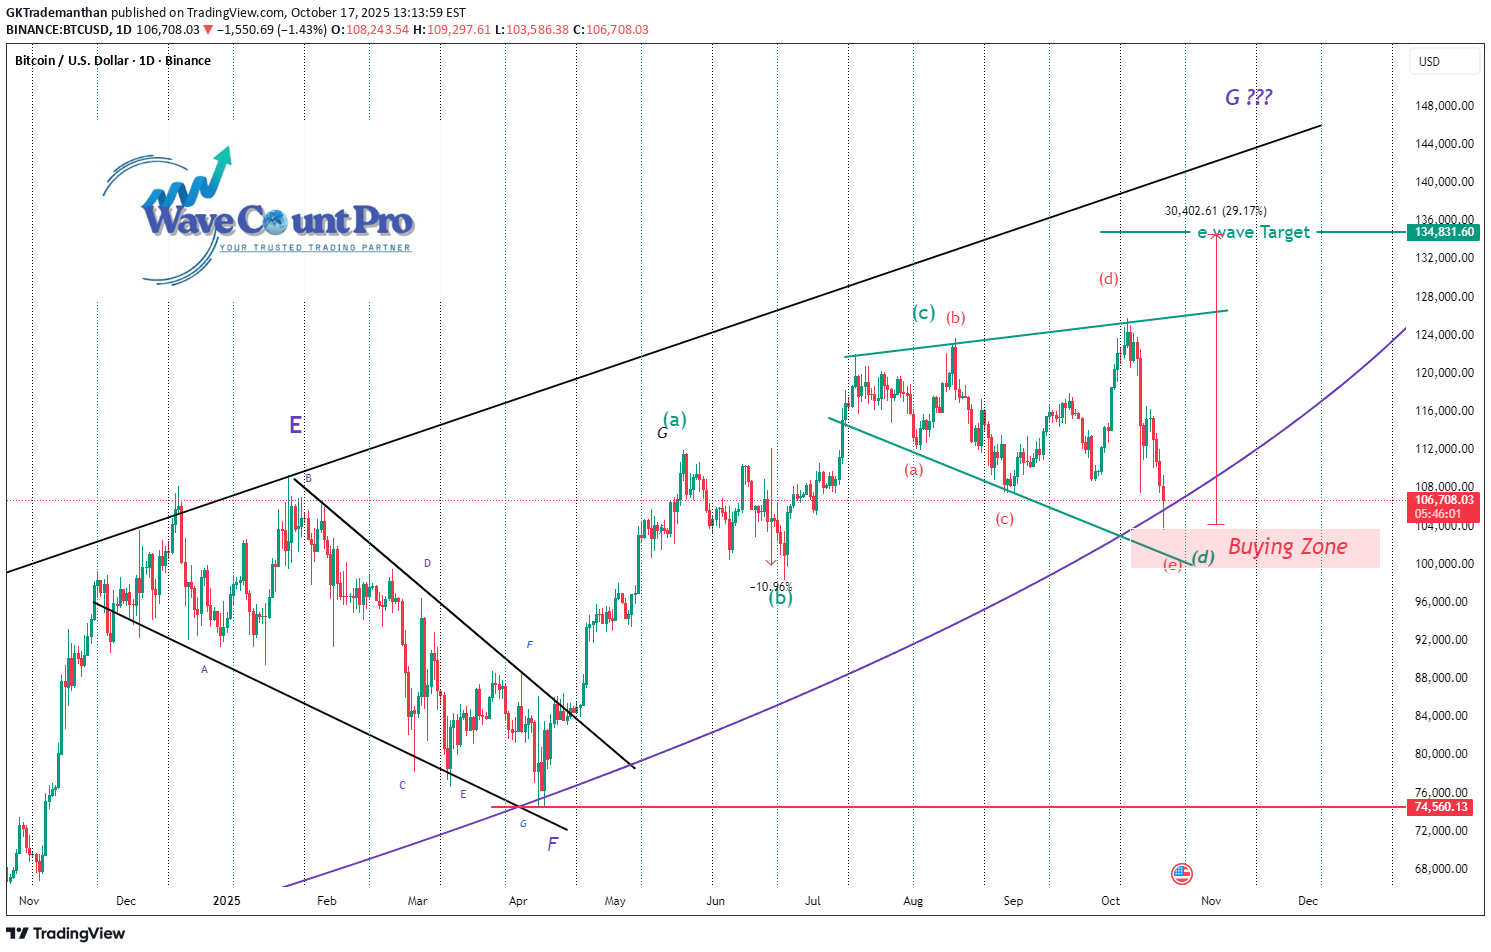
🔍 Analysis Summary: Current Price: ~$106,927 Pattern: Contracting triangle (ABCDE), nearing completion of wave (e). Buying Zone: Around $104,000, marked as a potential entry area. ✅ Trading Plan: Wave (e) could mark the end of the triangle, implying an impulsive breakout upward. Target for the breakout: $134,831 (approx. +29% move from the current region) Further Target (long-term): Potential move toward $146,000+, labeled as wave G??? (still speculative). 🧠 Insights: Price action has followed a well-defined corrective structure (labeled A-G and a-e). The chart shows multiple confluences of support near the buying zone (purple curve and horizontal level). This setup suggests a low-risk, high-reward opportunity if price reverses near wave (e).
GKTrademanthan
اتریوم آماده صعود انفجاری: آیا کف قیمتی تشکیل شده و هدف جدید ۶۳۰۰ دلار است؟

🔍 Analysis Summary: Current Price: ~$3,824 Pattern: Complex Elliott Wave correction (W-X-Y-X-Z) has likely completed. Key Observation: A potential bear trap just occurred (false breakdown), signaling a reversal. Wave Count: The chart suggests that Wave 2 has completed, and Wave 3 up is starting. ✅ Trading Plan: Buy Above: $3,925 Stop Loss: $3,378 Target 1: $5,230 Target 2: $6,306 🧠 Insights: Buying Zone was identified in the earlier phase near April. Bear Traps are used to suggest failed breakdowns, which trap sellers and fuel upside moves. Expected Move: Strong impulsive rally if price breaks above the resistance zone.
GKTrademanthan
آخرین فرصت خرید بیت کوین قبل از صعود بزرگ: تحلیل موج الیوت و هدفهای قیمتی جدید!

🎥 Bitcoin Elliott Wave Update – October 10, 2025 | What's Next for BTC? 📈 Wave Count Pro Technical Analysis In today’s update, we break down the current Bitcoin price action using advanced Elliott Wave theory. BTC is currently trading at $117,632 after a sharp pullback, down over 3% on the day. But is this just a temporary correction? 🔍 Key Takeaways: ✅ BTC recently broke out of a long-term triangle pattern, completing wave (e) and possibly starting a new bullish G wave. 📉 A short-term correction (wave (b)) may be forming now, with potential support near $115,170. 🔄 If the market holds this level, expect a move into wave (c), targeting the $134,000–$136,000 zone. ⚠️ Alternatively, a deeper F wave correction could revisit the $120,965 region before a bullish continuation. 📈 The long-term ascending trendline (purple) remains intact, supporting the bullish macro structure. 📊 Wave Count in Play: Current wave structure: (a)-(b)-(c) within a larger e → F → G wave sequence. Larger macro wave “G??” could push BTC beyond $145,000, depending on how this F wave resolves. 🔔 Stay tuned as we monitor how this structure unfolds. Will Bitcoin confirm the bullish breakout—or is more consolidation ahead? 👉 Don’t forget to like, subscribe, and comment below your thoughts on BTC’s next move! #Bitcoin #BTC #CryptoAnalysis #ElliottWave #TradingView #BTCUSD #CryptoNews #WaveCountPro
GKTrademanthan
تحلیل تکنیکال اتریوم: آیا سقوط نهایی در راه است؟ (مناطق خرید طلایی مشخص شد)

Wave Count (Green Labels 1–5): A 5-wave impulsive move appears to have completed, marking a bullish cycle peak. Complex Correction (W-X-Y-X-Z pattern): The correction after the 5th wave is labeled as a Complex Correction, composed of: Wave W – Zigzag Wave X Wave Y – Flat (3-3-5) Wave X – Smaller bounce Wave Z – Currently unfolding with a Diametric Pattern (7-wave structure) 📉 Current Market Structure Ethereum is in a corrective phase, currently moving through the Z wave of the complex correction. The correction appears to be forming another Diametric Pattern, potentially indicating one final drop before resuming upward. 🛒 Key Buying Zones Highlighted Upper Buying Zone (~$4,400 to $4,600) If ETH breaks bullish earlier than expected. Lower Buying Zone (~$3,600 to $3,800) More likely based on the projection shown. Where the final leg (Z) is expected to complete. 📈 Projected Path Price is expected to dip into the lower buying zone as the Diametric pattern completes. Following that, a strong bullish reversal is anticipated, likely leading to a new impulsive wave up. 📝 Patterns Used Zigzag Flat (3-3-5) Diametric Pattern – A 7-legged corrective structure, less common, indicating prolonged correction.
GKTrademanthan
تحلیل تکنیکال اتریوم: سقوط قریبالوقوع پس از شکست مثلث و شانه سر و شانهها!

📉 Technical Patterns & Indicators 1. Head and Shoulders Pattern Left Shoulder, Head, and Right Shoulder are clearly marked. Breakdown from the neckline suggests a bearish reversal, with a drop of ~6.49% (-295.99) post-breakdown. 2. Triangle Formation A symmetrical triangle labeled with a, b, c, d, e waves. The recent price movement has broken below this triangle, indicating a bearish breakout. 3. Elliott Wave Labels Waves labeled A, B, C, D, E, F, G. The chart is currently in the E-wave to F-wave transition. Projection points: F Wave target: ~$4,218 E Wave target: ~$4,084.51 G Wave target: ~$3,897.08 4. Trendlines Blue and black descending trendlines suggest downward pressure. Ethereum remains below these resistance lines, reinforcing a bearish outlook.
GKTrademanthan
پیشبینی زمان و قیمت اتریوم (ETH): تحلیل تکنیکال با امواج الیوت و اهداف کلیدی

🔍 Key Chart Patterns & Structures Head and Shoulders pattern marked at the top (with "Right Shoulder" labeled). An ABCDE Elliott Wave structure is labeled (A to E). Final movement projected as a G Wave toward the bottom. 📍 Major Time & Price Targets Identified These are marked by orange labels: Time & Price Target 1 — around 4,425 near intersection of trendlines D and e. Time & Price Target 2 — lower target, around 4,275. Time & Price Target 3 — higher target (~4,550), suggesting a bullish scenario. Time & Price Target 4 — this label is duplicated at two different locations: One around 4,275 again. One higher near 4,425 (possibly indicating uncertainty between scenarios). 🕒 Follow Time Zones (Blue Labels) These mark specific times to watch for possible market reactions or wave completions: Follow Time 1–5 span from Oct 10 to Oct 11, potentially marking the development of wave E and G. 🔴 Support & Resistance Levels 4,369.17 and 4,227.06 are key horizontal price levels (likely S/R). 4,074.01 appears to be a final target for the bearish wave G.
GKTrademanthan

GKTrademanthan

GKTrademanthan
Bit Coin Short Term bearish

This chart presents an Elliott Wave analysis of Bitcoin (BTC/USD) on a 4-hour timeframe, shared by Wave Count Pro. The pattern shows a complex corrective structure unfolding within a well-defined channel, with key turning points labeled as A, B, C, D, and a projected E. Currently, price action is approaching a critical decision zone around $117,211.36. The analysis suggests two potential scenarios: Bullish Breakout: If the price breaks above the $117,211.36 resistance, it could trigger a strong bullish move toward the upper trendline, targeting around $140,218.55 (labeled as point E). Bearish Rejection: A failure to break above this level could lead to a pullback toward the lower boundary of the channel, possibly completing a wave (e) before a potential rally. Key Levels: Buy Above: $117,211.36 Sell Below: $113,966.84 WaveCount Pro Gautam Khanna
Disclaimer
Any content and materials included in Sahmeto's website and official communication channels are a compilation of personal opinions and analyses and are not binding. They do not constitute any recommendation for buying, selling, entering or exiting the stock market and cryptocurrency market. Also, all news and analyses included in the website and channels are merely republished information from official and unofficial domestic and foreign sources, and it is obvious that users of the said content are responsible for following up and ensuring the authenticity and accuracy of the materials. Therefore, while disclaiming responsibility, it is declared that the responsibility for any decision-making, action, and potential profit and loss in the capital market and cryptocurrency market lies with the trader.