
GDuBFX
@t_GDuBFX

What symbols does the trader recommend buying?
Purchase History
پیام های تریدر
Filter
GDuBFX
Sorry Bitcoin Bears, but the downwards trend has finished
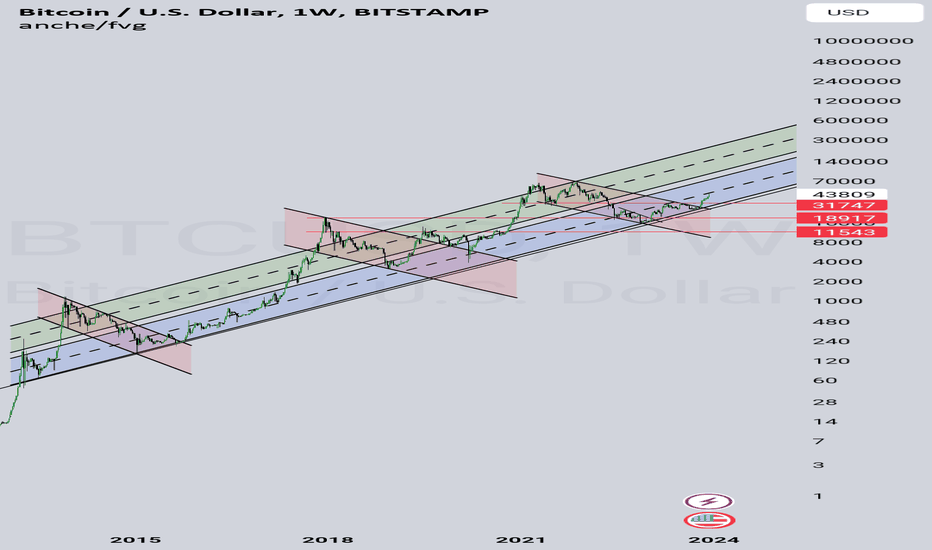
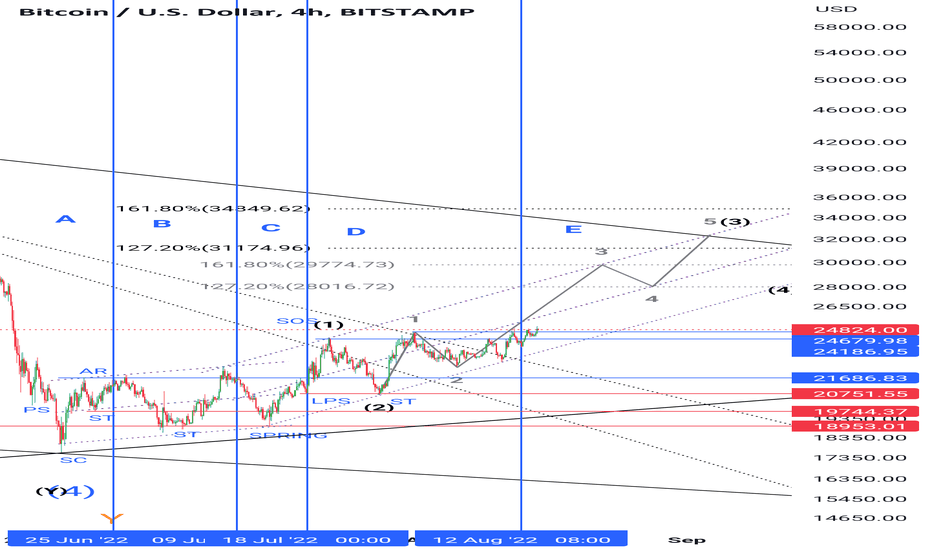
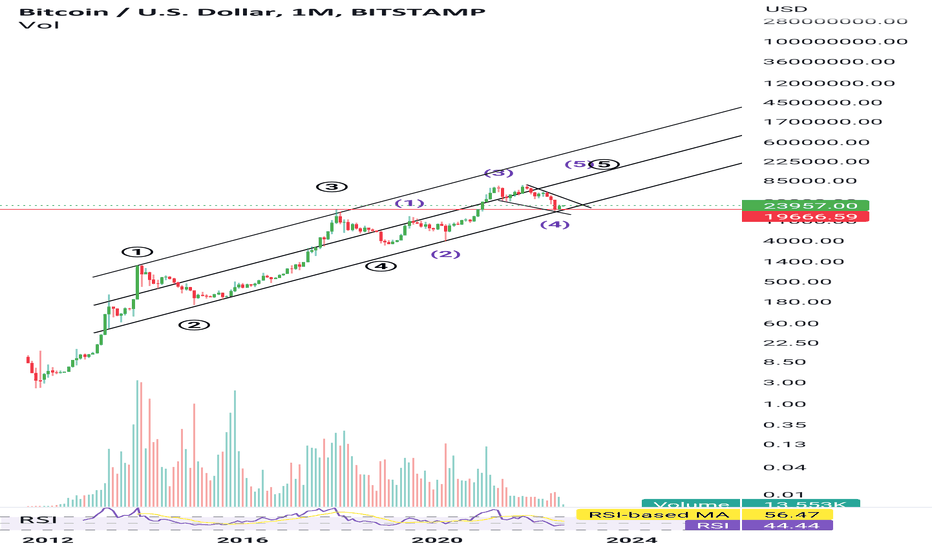
Looking back at the historical long term chart you can clearly see that it has a long term upwards trend with periods of corrections in a downwards channel 3 times.I've marked on my chart the lower and upper bands of the upwards trend and also the downwards corrections.It is clear as day that the long term upwards trend has continued, it has broken up out of the latest downwards correction and has broken above key support/resistance levels.If you do not agree with this chart I'd love to hear your thoughts.I'll also share zoomed in versions of this chart in comments.Add in the Wyckoff Accumulation and Re-accumulation patterns that can be seen on the daily chart:For transparency and to show that I've had the same view for some time and to show results of previous analysis and not just putting them on the chart in hindsight, here is some analysis I posted on 9th September predicting the "spring" and the "jump across the creek" stage of the re-accumulation pattern.. BEFORE IT HAPPENED.Add Elliot Waves in to the mix:I'm predicting that this current wave will end around the $45k mark as highlighted on the below chart.... which will complete the purple ABC correction and blue wave 1 (as shown on the first elliot wave chart above).This will then lead in to a correction wave 2, which im predicting won't come below the 31K area and that's when the real volumes will start to pick up and the markup stage really starts to go... Early price predictions for a market top are around $205-230k.... how long that may take and what year / month that may come isn't part of my analysis... I just ride the trend however long that may take. That is also entirely speculative at the moment and further updates as the market plays out will be required.Zooming in closer and looking at these final 5 waves, you can see a Wyckoff Distribution pattern forming on the 1h chart.This is goinf to be the start of an ABC correction on the wave "1-2" on the bigger timeframe.The below chart highlights how waves and wyckoff can be seen on the charts and utilising both ideas together:How that looks on the bigger chart:Marked up a bit better:Update:This is looking like it is forming an ending diagonal for this 5th wave.This is getting really squeezed now, it's going to burst up to the UTAD soon I think:The Wyckoff Distribution pattern I had been watching did not complete and the correction waves have now begun, which is why I was suggesting not to go long.This has now suggested that the Blue Wave 1 has now completed following the Purple ABC Wave and is now going to Blue Wave 2.I am now expecting a corrective pattern such as an "ABC" down to wave 2 and expect this to be down to between $31,000 -$35,000.Daily chart:Weekly chart:This ABC correction pattern will consist of 5-3-5 waves (5 waves to A, ABC correction to B and 5 waves down to C).You can see my forecast of the A and B waves on the below chart, but this is entirely speculative at the moment, so don't take it as a trading signal.Once we've had the A-B waves we can then measure a target area for the end of the C wave using fibonacci and I'll keep updating as this correction plays out.After re-analysing I don't think we have finished the 5 waves up yet and the correction has not started yet. I now think the move down was still part of the wave 3-4 of the 5 waves up. See updated chart below:Target area for the last wave up after re-analysing $45500-$47500.Prediction vs where we currently are, it is gone to the area I'd expect the red wave 2 to end (highlighted on the blue box and wave 3 starting:Update with measured targets for each wave.Also note the RSI breakout at the bottom is also indicating the upwards move.It's been a few days since I last posted an update as I have been busy, plus the market seems to have just consolidated a bit.I still believe we are going up, but it has just taken a bit of a different shape to what I had predicted.The RSI that had previously broke out re tested the trend line / oversold range and has came back up.The shape it looks to be forming is a megaphone shape and I'm expecting one last rally up to around $46,000See below chart:Please also be aware that the alternative scenario to this is that I've got my Elliott wave wrong and we are in the downwards correction already.See the alternative scenario below:Quick update...The original 5th blue wave didn't play out how I thought it was, but as you can now see, I've been updating the red waves as the market reveals itself (you can never predict what's going to happen 100%).Here's my thoughts now:I would not be surprised if it did something like this to wipe out stop losses of anyone that has gone long, make people go short and then wipe their stop losses out too.Merry Christmas everyone, hope you all had a great day. I've been with family through the festive period so haven't been on much and why there hasn't been any updates. This is a perfect example of why I trade longer term and not short term / day trade. Although it's gone against my shorter term analysis and I had the shorter term waves analysis wrong, it gives you chance to zoom out and look at it again and re-analyse after it goes against you. I still believe we are going up to around $47k, but it's just taken a bit of time and more consolidation. Please note - I'm not an expert and I do get things wrong (no one is ever 100% right), so this analysis could still be wrong and it could still go against this. This is not trade advice and you should do your own analysis and make your own decisions before making any trades and always manage your risk.Here's the bigger picture that I'm looking for:Happy new year everyone, hope you all had a good one!Here is a quick update.... the leg down didn't quite make it to where I predicted in my last update and it has been caught by another line of a bull flag / pennant.It is now breaking up and my next target is the blue box between 46K - 48K as shown in the chart.*** Update***I have changed the target area (marked up by the blue box) as I expect 1 last leg up to around $47k.***Update***This has now had a 5th wave failure and this can be seen on the chart below.5th wave failures can occur if the market loses momentum and especially if the 3rd wave extends more than 161.8% on the fibs (which it had but I just don't have it marked up on the chart).This can now be the start of the correction wave I have been suggesting for some time:Sorry for the lack of updates, I've been busy irl and it's also been a bit of a complex correction and bullish momentum has been fading.. this is all possible signs that a correction is due. It has reached my target area around $47k (it actually went slightly higher to 49K as marked up on my chart below: On the daily chart you can see that I have marked up where I'm expecting the correction to end between $31-35k before the trend picks up again. You can also see that the daily candle is forming a rejection candle which is also indicative of a correction happening here. The daily candle has not closed yet however, so this has not confirmed yet. The following day would need a closed candlestick for confirmation to trade based off that too. In summary, I'm expecting price to come down, but as we are in a bullish trend, I don't reccommend trading against the trend as it can pick up momentum at any point and a correction does not necessarily have to happen. If price comes down to my target area of around $31-35k then I would see this as an ideal buy zone but I would do your own analysis and make your own decisions.Love it when you can look at your predictions in hindsight and compare the two. If this isn't accurate, I don't know what is 🫣The correction I have been warning about is now in full swing.The "A" wave may not have quite finished yet but I'm looking for the "B" to come up to around $44.5k - $46.5k and then come back down to between 31K - $35k.Update:As per usual my predictions have been pretty accurate and it is looking pretty similar to what I had forecasted so far.There is still room for a bit more upside, before coming back down.See chart below:UPDATE:The blue "ABC" zig zag pattern went up a little further than I posted last but it has now started to form another pattern I was watching for on the black "ABC".It has started to form a flat correction pattern between the blue 61.8% and 78.6% Fibonacci levels I have marked up.I expect the price to come back to the 61.8% fibs level around the $37.5k level before another bullish run which takes us to new highs.Watch this space and get ready for the bulls.As ever... this is not trade advice, just my own opinion, do your own analysis, make your own decisions and manage your risk!Good Trading!Daily chart:Weekly chart:All time chart:Wyckoff update:This is an alternative correction I'm watching out for:Update: It seems like it is going up to where I posted last as my alternative correction I was keeping an eye on. This can play out in 2 ways as shown in the charts below: Irregular Flat Running FlatDaily chart with the irregular flat pattern:Update:Looking at how this chart is shaping up, it is looking like a bull trap / manipulation occurring.A lot of retail / inexperienced traders will be looking at this as a breakout and go long here.With experience you can start to recognise when traders are being fooled and the market makers are just playing with you to trap you in to long positions only for the market to then reverse and crash down again because the market makers are hunting your stop losses.I've marked up where most stop losses will be set by the red lines (not the dotted ones).I think the market makers will be hunting these soon and the C wave I've marked up coming below these.See chart below:Hello all and sorry for the lack of updates, I've been busy with my day to day life. I did mean to post an update saying it looks like the correction I had been posting about had already happened due to the behaviour of price not coming down at all.This goes to show you cannot be right all of the time and that when I said do not trade against the trend as the bulls will pick up at any point, was proven to be true here.I have now updated my correction pattern and added in the new 5 waves (black) on to my chart, along with adjusting the fib measurements for the purple wave. As we have approached the ath of $SWB:69K I expect there to be some resistance from the bears and a small correction / consolidation pattern before it continues up to around the $100k mark.To add to my last post - Another correction / consolidation pattern will be due somewhere between $81k and $95k
GDuBFX
Sorry Bitcoin Bears, but the downwards trend has finished
Looking back at the historical long term chart you can clearly see that it has a long term upwards trend with periods of corrections in a downwards channel 3 times. I've marked on my chart the lower and upper bands of the upwards trend and also the downwards corrections. It is clear as day that the long term upwards trend has continued, it has broken up out of the latest downwards correction and has broken above key support/resistance levels. If you do not agree with this chart I'd love to hear your thoughts. I'll also share zoomed in versions of this chart in comments.Add in the Wyckoff Accumulation and Re-accumulation patterns that can be seen on the daily chart:For transparency and to show that I've had the same view for some time and to show results of previous analysis and not just putting them on the chart in hindsight, here is some analysis I posted on 9th September predicting the "spring" and the "jump across the creek" stage of the re-accumulation pattern.. BEFORE IT HAPPENED.Add Elliot Waves in to the mix:I'm predicting that this current wave will end around the $45k mark as highlighted on the below chart.... which will complete the purple ABC correction and blue wave 1 (as shown on the first elliot wave chart above). This will then lead in to a correction wave 2, which im predicting won't come below the 31K area and that's when the real volumes will start to pick up and the markup stage really starts to go... Early price predictions for a market top are around $205-230k.... how long that may take and what year / month that may come isn't part of my analysis... I just ride the trend however long that may take. That is also entirely speculative at the moment and further updates as the market plays out will be required.Zooming in closer and looking at these final 5 waves, you can see a Wyckoff Distribution pattern forming on the 1h chart. This is goinf to be the start of an ABC correction on the wave "1-2" on the bigger timeframe. The below chart highlights how waves and wyckoff can be seen on the charts and utilising both ideas together:How that looks on the bigger chart:Marked up a bit better:Update: This is looking like it is forming an ending diagonal for this 5th wave.This is getting really squeezed now, it's going to burst up to the UTAD soon I think:The Wyckoff Distribution pattern I had been watching did not complete and the correction waves have now begun, which is why I was suggesting not to go long. This has now suggested that the Blue Wave 1 has now completed following the Purple ABC Wave and is now going to Blue Wave 2. I am now expecting a corrective pattern such as an "ABC" down to wave 2 and expect this to be down to between $31,000 -$35,000. Daily chart: Weekly chart:This ABC correction pattern will consist of 5-3-5 waves (5 waves to A, ABC correction to B and 5 waves down to C). You can see my forecast of the A and B waves on the below chart, but this is entirely speculative at the moment, so don't take it as a trading signal. Once we've had the A-B waves we can then measure a target area for the end of the C wave using fibonacci and I'll keep updating as this correction plays out.After re-analysing I don't think we have finished the 5 waves up yet and the correction has not started yet. I now think the move down was still part of the wave 3-4 of the 5 waves up. See updated chart below:Target area for the last wave up after re-analysing $45500-$47500.Prediction vs where we currently are, it is gone to the area I'd expect the red wave 2 to end (highlighted on the blue box and wave 3 starting:Update with measured targets for each wave. Also note the RSI breakout at the bottom is also indicating the upwards move.It's been a few days since I last posted an update as I have been busy, plus the market seems to have just consolidated a bit. I still believe we are going up, but it has just taken a bit of a different shape to what I had predicted. The RSI that had previously broke out re tested the trend line / oversold range and has came back up. The shape it looks to be forming is a megaphone shape and I'm expecting one last rally up to around $46,000 See below chart:Please also be aware that the alternative scenario to this is that I've got my Elliott wave wrong and we are in the downwards correction already. See the alternative scenario below:Quick update... The original 5th blue wave didn't play out how I thought it was, but as you can now see, I've been updating the red waves as the market reveals itself (you can never predict what's going to happen 100%). Here's my thoughts now:I would not be surprised if it did something like this to wipe out stop losses of anyone that has gone long, make people go short and then wipe their stop losses out too.Merry Christmas everyone, hope you all had a great day. I've been with family through the festive period so haven't been on much and why there hasn't been any updates. This is a perfect example of why I trade longer term and not short term / day trade. Although it's gone against my shorter term analysis and I had the shorter term waves analysis wrong, it gives you chance to zoom out and look at it again and re-analyse after it goes against you. I still believe we are going up to around $47k, but it's just taken a bit of time and more consolidation. Please note - I'm not an expert and I do get things wrong (no one is ever 100% right), so this analysis could still be wrong and it could still go against this. This is not trade advice and you should do your own analysis and make your own decisions before making any trades and always manage your risk.Here's the bigger picture that I'm looking for:Happy new year everyone, hope you all had a good one! Here is a quick update.... the leg down didn't quite make it to where I predicted in my last update and it has been caught by another line of a bull flag / pennant. It is now breaking up and my next target is the blue box between 46K - 48K as shown in the chart.*** Update*** I have changed the target area (marked up by the blue box) as I expect 1 last leg up to around $47k.***Update*** This has now had a 5th wave failure and this can be seen on the chart below. 5th wave failures can occur if the market loses momentum and especially if the 3rd wave extends more than 161.8% on the fibs (which it had but I just don't have it marked up on the chart). This can now be the start of the correction wave I have been suggesting for some time:Sorry for the lack of updates, I've been busy irl and it's also been a bit of a complex correction and bullish momentum has been fading.. this is all possible signs that a correction is due. It has reached my target area around $47k (it actually went slightly higher to 49K as marked up on my chart below: On the daily chart you can see that I have marked up where I'm expecting the correction to end between $31-35k before the trend picks up again. You can also see that the daily candle is forming a rejection candle which is also indicative of a correction happening here. The daily candle has not closed yet however, so this has not confirmed yet. The following day would need a closed candlestick for confirmation to trade based off that too. In summary, I'm expecting price to come down, but as we are in a bullish trend, I don't reccommend trading against the trend as it can pick up momentum at any point and a correction does not necessarily have to happen. If price comes down to my target area of around $31-35k then I would see this as an ideal buy zone but I would do your own analysis and make your own decisions.Love it when you can look at your predictions in hindsight and compare the two. If this isn't accurate, I don't know what is 🫣The correction I have been warning about is now in full swing. The "A" wave may not have quite finished yet but I'm looking for the "B" to come up to around $44.5k - $46.5k and then come back down to between 31K - $35k.Update: As per usual my predictions have been pretty accurate and it is looking pretty similar to what I had forecasted so far. There is still room for a bit more upside, before coming back down. See chart below:UPDATE: The blue "ABC" zig zag pattern went up a little further than I posted last but it has now started to form another pattern I was watching for on the black "ABC". It has started to form a flat correction pattern between the blue 61.8% and 78.6% Fibonacci levels I have marked up. I expect the price to come back to the 61.8% fibs level around the $37.5k level before another bullish run which takes us to new highs. Watch this space and get ready for the bulls. As ever... this is not trade advice, just my own opinion, do your own analysis, make your own decisions and manage your risk! Good Trading!Daily chart:Weekly chart:All time chart:Wyckoff update:This is an alternative correction I'm watching out for:Update: It seems like it is going up to where I posted last as my alternative correction I was keeping an eye on. This can play out in 2 ways as shown in the charts below: Irregular Flat Running FlatDaily chart with the irregular flat pattern:Update: Looking at how this chart is shaping up, it is looking like a bull trap / manipulation occurring. A lot of retail / inexperienced traders will be looking at this as a breakout and go long here. With experience you can start to recognise when traders are being fooled and the market makers are just playing with you to trap you in to long positions only for the market to then reverse and crash down again because the market makers are hunting your stop losses. I've marked up where most stop losses will be set by the red lines (not the dotted ones). I think the market makers will be hunting these soon and the C wave I've marked up coming below these. See chart below:Hello all and sorry for the lack of updates, I've been busy with my day to day life. I did mean to post an update saying it looks like the correction I had been posting about had already happened due to the behaviour of price not coming down at all. This goes to show you cannot be right all of the time and that when I said do not trade against the trend as the bulls will pick up at any point, was proven to be true here. I have now updated my correction pattern and added in the new 5 waves (black) on to my chart, along with adjusting the fib measurements for the purple wave. As we have approached the ath of $SWB:69K I expect there to be some resistance from the bears and a small correction / consolidation pattern before it continues up to around the $100k mark.To add to my last post - Another correction / consolidation pattern will be due somewhere between $81k and $95k
GDuBFX
Re-accumaltion or distribution? Both have similar shape / Patter

Only time will tell if this is distribution or re-accumulation. I think it is the latter personally
GDuBFX
Bitcoin Weekly RSI broken up from falling wedge

As you can see on my weekly chart, the weekly RSI has broken up out of the falling wedge pattern that mirrors the wedge that is on the price action. Is this a sign of what's to come on the price action? I definitely think so! If you have been following my previous posts, I have remained bullish since early june, despite all the negative news / fundamentals like "recession is going to crash all assets and everyone is moving their money in to USD because it's the world reserve currency" etc. I don't like to listen to all of this as it's all just noise, I watch the price action and what's happening on the indicators. Remember when the noise used to say bitcoin is going to be the "new digital gold and a store of value" and somewhere that investors will use as a safe haven in bear markets? Why has this not reappeared and why has the noise now changed their stance?Just to add to this, the red horizontal line is the weekly close price from the 2017/2018 high. In addition to that, the weekly RSI has re-tested the downwards trendline of the wedge and also the RSI moving average where it has found support and gone back up. The price has found support on weekly close price of the 2017/2018 high too.In case you're wondering what the upwards trendlines are, these are a fibonacci channel drew on my chart from the low of April 2013 and the low from August 2015. The overall long term trend is bullish and we are approaching the bottom of the channel and you know what they say "trade with the trend" and "buy the dips". This "bear trend" is just a dip in the long term bull trend and looking for shorts here is what they call "FOMO". As Warren Buffet once said "It is wise for investors to be fearful when others are greedy, and greedy when others are fearful". Whilst everyone else is getting fearful, I'm getting greedy!!!A further addition to this, which I have just noticed and what a lot of new / inexperienced traders may miss completely, is that there is some bullish hidden divergence on the weekly RSI against the price action (as shown by the blue lines on the chart below).
GDuBFX
BTC bottom, bull run starting

It has been a while since I last posted, because the Wyckoff idea i had suggested on the shorter term was invalidated. I closed my long in profit, as it had broken down out of what appears to have been a leading diagonal pattern (which I had been keeping my eye on). As a result of this, I have been re-analysing and trying to establish my view of the elliot waves. My long term view remains bullish, as I had previously posted about the weekly trend and I have reopened new long positions at $18,932. Take a look at the bigger picture on the weekly chart: There is a long standing bullish trend on the logarithmic chart, that has been established since around March/April 2013. The price is at the bottom of a "bullish pennant pattern" on the chart, which had previously been the shape that has been what any previous corrections has formed and price is now also at the bottom of the long term trend. Its now bouncing off the trendline with a bullish "Morning Star candlestick pattern" as seen on the below charts: The price is also at the previous ATH level from 2017/2018 and also the 161.8% Fibonacci extension level of the correction pattern. This is proving to be strong support area and confluence area in addition to the long term trend. In addition to this, the weekly RSI is oversold and is now bouncing off the RSI moving average, showing that there is bullish momemtum. This has previously been the catalyst to the next bull run whenever the RSI has been in this position in the entire history of bitcoin: Where next for bitcoin? I think the price has bottomed out on 18th June at around $17,592 , as the price has now formed the leading diagonal pattern I mentioned earlier. Following this, there will usually be a break down of the pattern, which forms wave 1 and 2 of the new bullish trend starts. I believe this has now happened and the wave 2 has ended at the confluence area of the long term bull trend, bottom of the pennant pattern, 161.8% fib extension of the pennant correction shape, 2017/2018 ATH and oversold RSI. It is now breaking out the top of the short term bearish trend and soon to be out of the top of the new short term trendline that was set from the failed breakout (marked by the black "wave 1" on my daily chart). I think this wave 3 will now continue up to the 161.8% fib extension level around $35,000, have a correction back down to around $29,000 (wave 4) and then the 5th wave will continue up to around the 61.8% fib retracement level of around $41,000 (retracement from the ATH down to the most recent low of around $17,900). I believe that this will then complete the end of the primary "wave 1". For the long term primary waves, I believe the long term targets are still around the $100,000 - $160,000 levels I've mentioned on previously published ideas (127.8% and 161.8% fib retracement levels). My early predictions for the 5 primary wave cycle (which is entirely speculative at this stage) are in the chart below:Here is an alternative scenario to the bullish one. The price is currently on the way up it seems, but if that gets stopped by the top of the falling wedge and makes a "wave 4" of 5 waves down, it could then potentially form the "A wave" from an "ABC" correction, which breaks down from the long term bullish trend and we could see this correction take us down to around $3,000 - $6,500. This is a long term bullish trend, so I will always favour trading with the trend and until it has broken, then I won't be looking for bearish positions. If the trend does break, then I will be looking for short positions around the "B" of the ABC
GDuBFX
BTC 4H Wyckoff Accumulation update
Good morning Traders, Following my previous analysis, I have updated my chart to show my thoughts on what's happening. Following the "sign of strength (SOS)" stage, we have seen a re-test of the "last position of support (LPS) stage and have now seen the typical continuation pattern / shape you would expect following the "SOS", where the price is converging before breaking out. I believe the "Phase E" of the wyckoff was delayed by the re-test of the "LPS", but we are now starting to break out of the top of the range and I would expect volumes to increase and price to increase, probably tomorrow when the market re-opens to the large institutional traders. We have also seen some of the minor downward trendlines break out upwards. Full view of chart in comments. All I keep seeing on other posts is that this is a "BEAR FLAG" or "RISING WEDGE" and price is going to fall to 10-13k, but to draw the flag / wedge trendlines, the line cuts through the price action / candlesticks. In my opinion if you have to do this to "make it fit", this is not a correct trendline and people pass it off with "false breakout" all the time, but a trend / pattern is not a trend / pattern if it is consistently having false break outs! As always this is not trade advice and is just my own view, so trade at your own risk. Like, comment and share! Have a great week and good trading! GDuBMy short term wyckoff idea failed, but my long term bullish sentiment is still active, the wyckoff idea was still going until the leading diagonal pattern (which I had also spotted, but was just keeping an eye on) has broken down. This was always a possibility. I closed my trade in significant profits regardless. I didn't take a short, because I've been too busy as of late, hence no updates, but I have now taken another long position because of various reasons, 1 being that it has now hit the 2017/2018 high of around 18900 again and also the long term bullish trendline and bounced off this. It has also broken back up out of the short term bearish trendline which it has been battling against. I now believe this is wave 1-2 of the bullish trend and you can see these marked on the chart below:
GDuBFX
If you're bearish on Bitcoin, take a look at this!
Lots of people are suggesting bitcoin will go down to 13k, 10k etc... but when we are in a long term bullish trend, in a continuation pattern (falling wedge) on the log chart and price has yet to break down out of a long term upwards trend line/ channel, along with staying above the support / resistance levels of the 2017/2018 high price, then ask yourself, us the bearish momentum strong enough to breach both of these things?
GDuBFX
It's been a while since I provided an update on the Wyckoff idea
Good morning traders, I have been a little busy recently, so haven't had chance to provide an update on my wyckoff accumulation idea. As you can see on my chart, we are well and truly in to the new bullish trend that follows a wyckoff accumulation pattern and from the looks of things there is a Leading diagonal pattern forming, made up from waves and the sub waves within each wave. As you can see my elliot waves have been measured and my targets for each wave marked up. I believe the 5th purple wave will complete around $31,775 which is a key support/resistance level. These waves I have marked up are minor waves and once the 5 wave cycle has completed, I believe this will be primary wave 1 which will be followed by a correction down to primary wave 2. What this will come down to will be determined once we know where the end of the primary wave 1 is and we can then measure the wave 2, which I will sure to provide an update for. Please like and share my idea along with leaving your comments if you don't agree. Happy trading 👍🏻 GDuBHere is 2 scenarios which I am looking for and undecided which one at the moment: or alternative scenario:
GDuBFX
BTC new trend - Following on from my wyckoff accumulation idea
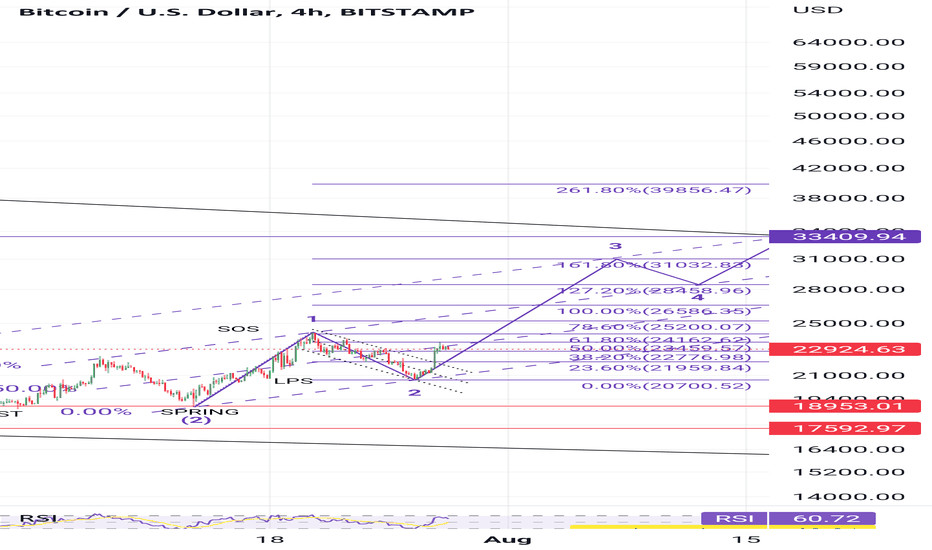
To continue on from the wyckoff accumaltion posts I have shared, I now believe the "Phase E" of the wyckoff schematic is in full swing and the new trend has begun. As you can see on my chart there is a new upwards channel being formed consisting of higher highs and higher lows, so I think this is a sign that the trend has now changed and I have marked up my elliot wave forecasts using a fibonacci extension. As you can see we are in to the 3rd subwave which will consist of 5 waves up, so we will soon have a correction down to give opportunity to buy. Any questions, feel free to ask in the comments below. Full view of chart in comments too. Happy trading and be sure to manage your risks. GDuB
GDuBFX
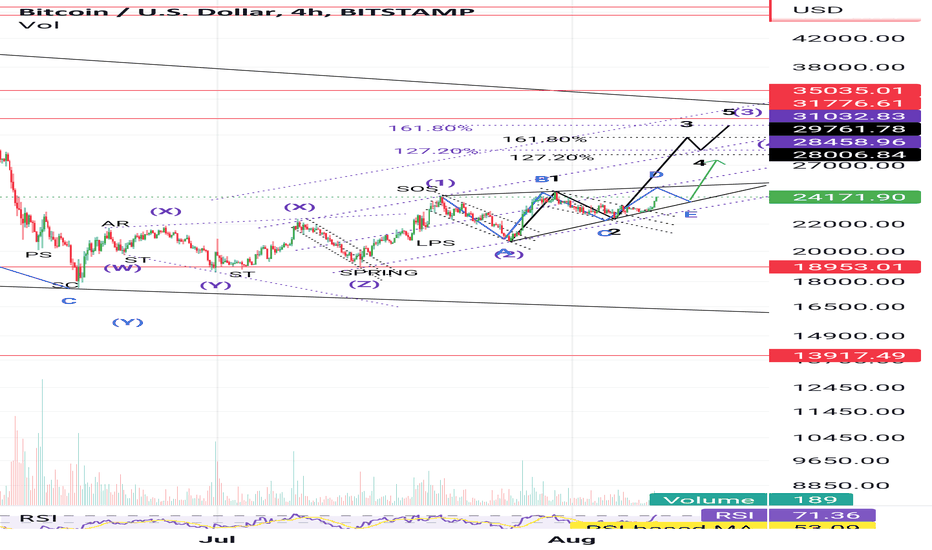
BTC 4H Wyckoff accumulation update
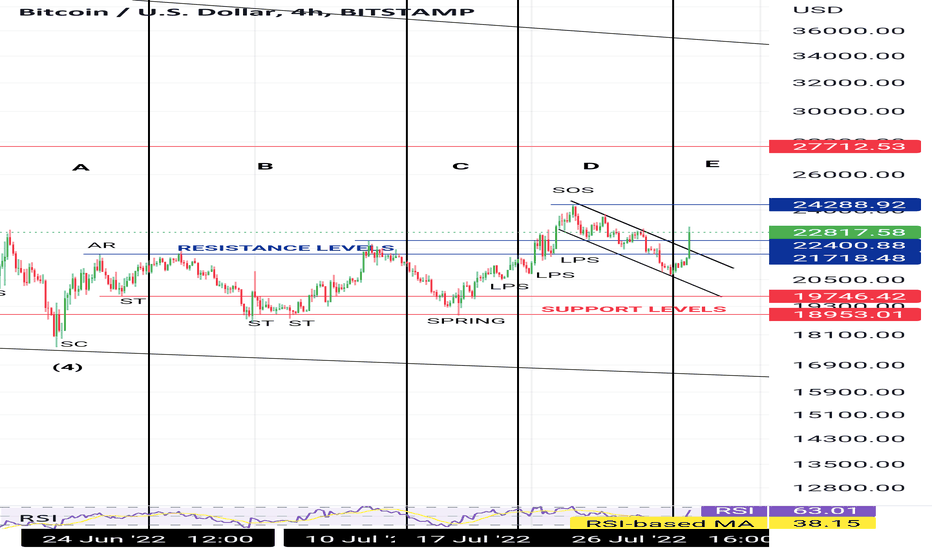
If you have been following my ideas, you will have seen I had posted that we had the "SOS" sign of strength stage and we were entering the phase e of the pattern. This turned out to be incorrect and as you can see on my updated chart, I have now marked this up again. The price has come down in a bull flag following the SOS which has now shaken out and stop losses on long positions and the market makers has absorbed these position and is now aggressively pushing price up, breaking out the top of the flag. The next step would be to break above the previous resistance level set by the SOS.
Disclaimer
Any content and materials included in Sahmeto's website and official communication channels are a compilation of personal opinions and analyses and are not binding. They do not constitute any recommendation for buying, selling, entering or exiting the stock market and cryptocurrency market. Also, all news and analyses included in the website and channels are merely republished information from official and unofficial domestic and foreign sources, and it is obvious that users of the said content are responsible for following up and ensuring the authenticity and accuracy of the materials. Therefore, while disclaiming responsibility, it is declared that the responsibility for any decision-making, action, and potential profit and loss in the capital market and cryptocurrency market lies with the trader.