Fx_Analysis_TRADER
@t_Fx_Analysis_TRADER
What symbols does the trader recommend buying?
Purchase History
پیام های تریدر
Filter
Signal Type

Fx_Analysis_TRADER

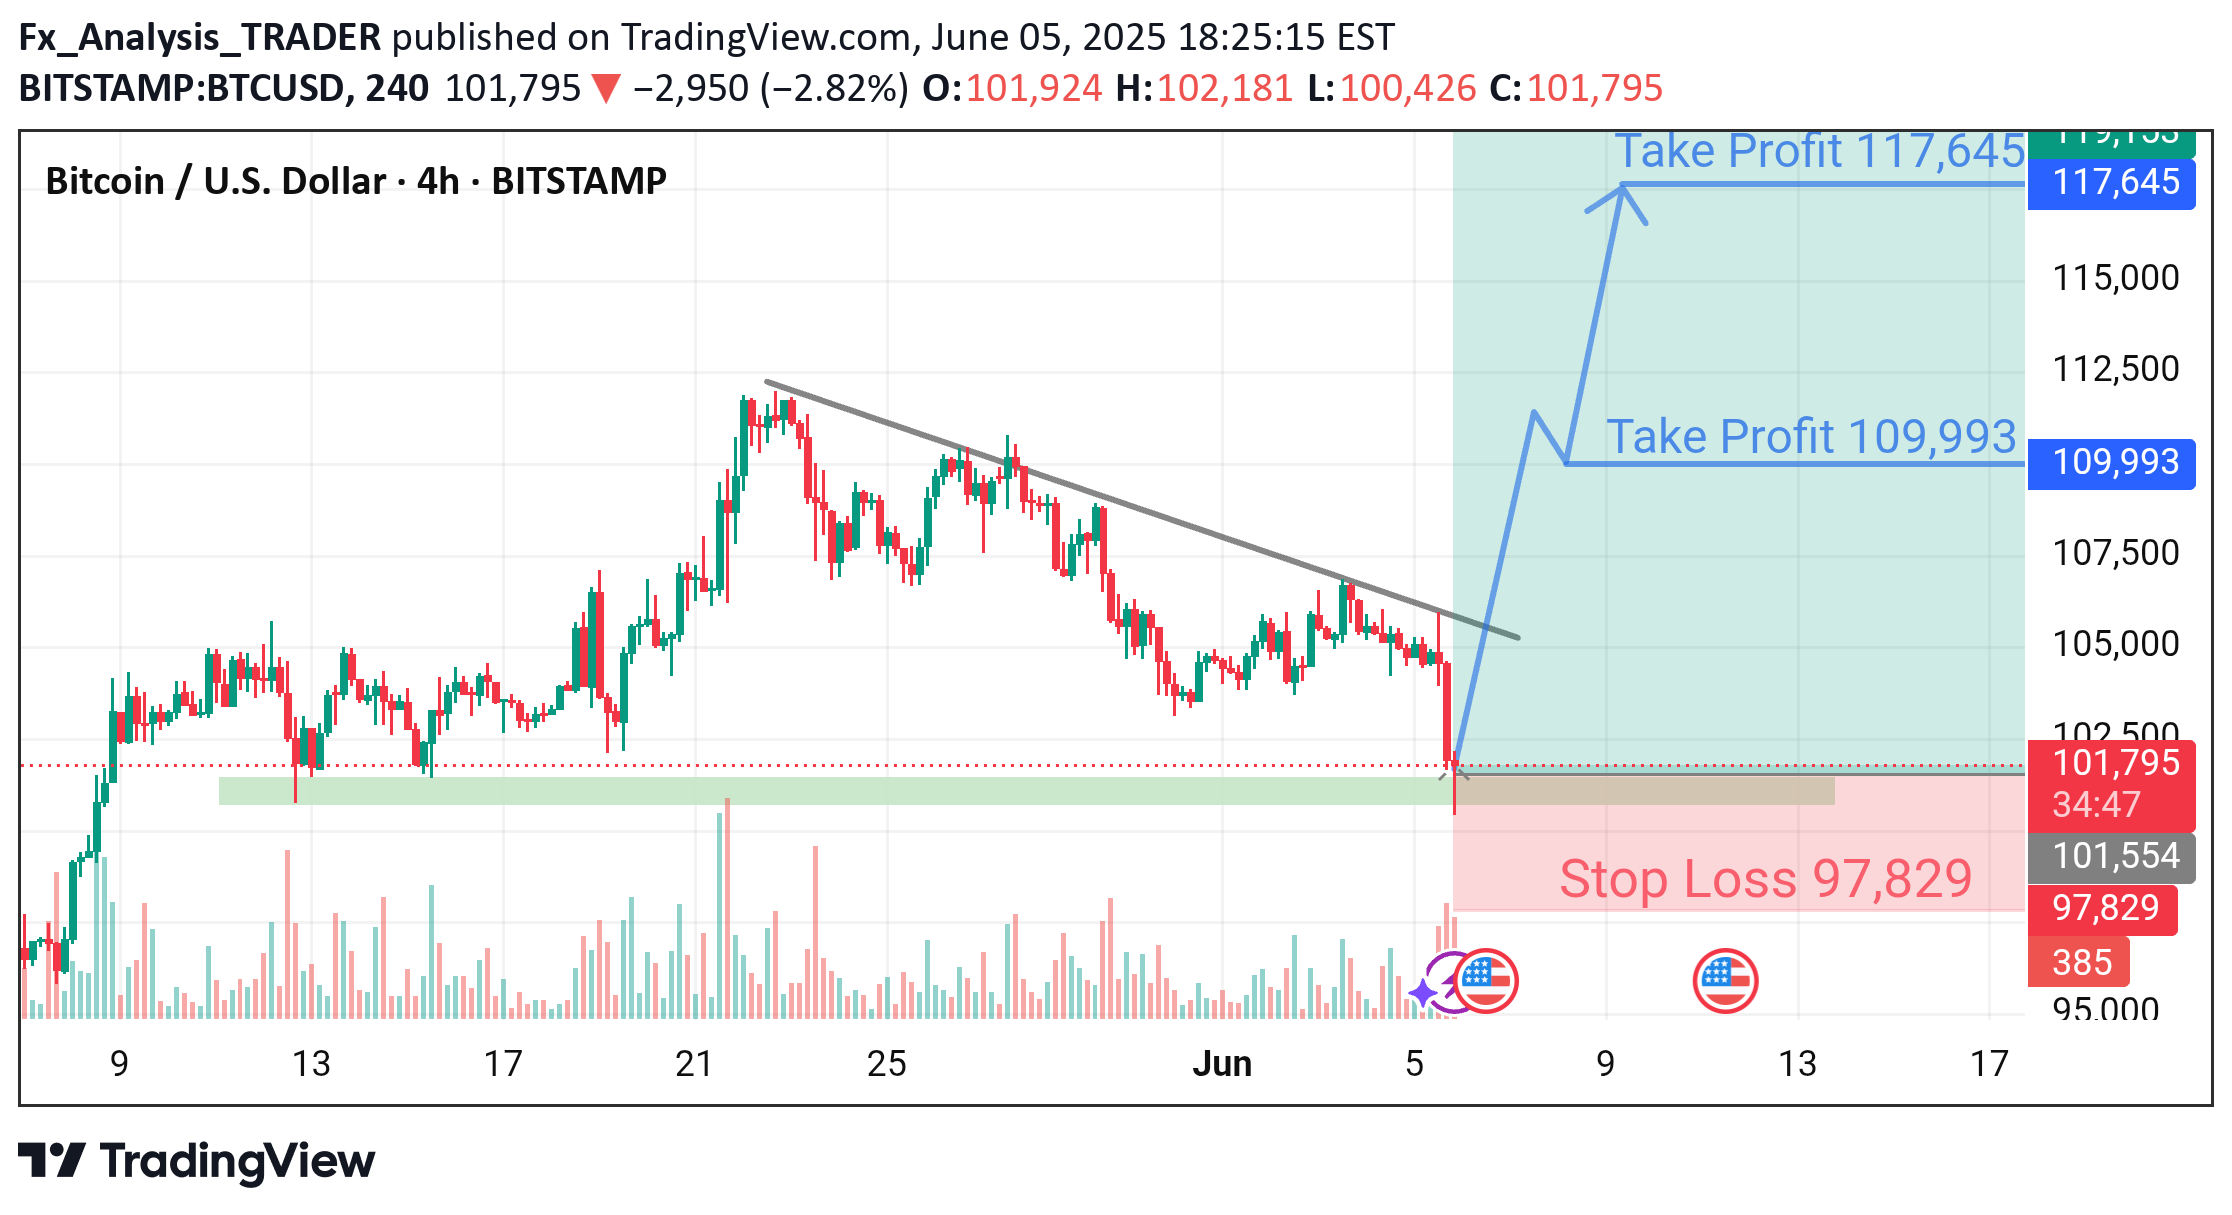
BTC/USD | Bullish Reversal Setup from Key Support Zone (4H Chart)📊 Text (Idea Description):Bitcoin is showing a potential bullish reversal from a strong horizontal support zone near $101,000. The price recently broke out of a descending trendline and has formed a sharp wick rejection at the support.🟦 Key Details:Support Zone: $100,800 – $101,200Entry Zone: Current Market Price (CMP) ~$101,500Stop Loss: $97,829 (Below support)Take Profit 1: $109,993Take Profit 2: $117,645📈 A breakout and successful retest above the descending trendline may trigger a strong bullish move toward the take profit zones. Risk-to-reward ratio is favorable. Always manage your risk properly.

Fx_Analysis_TRADER

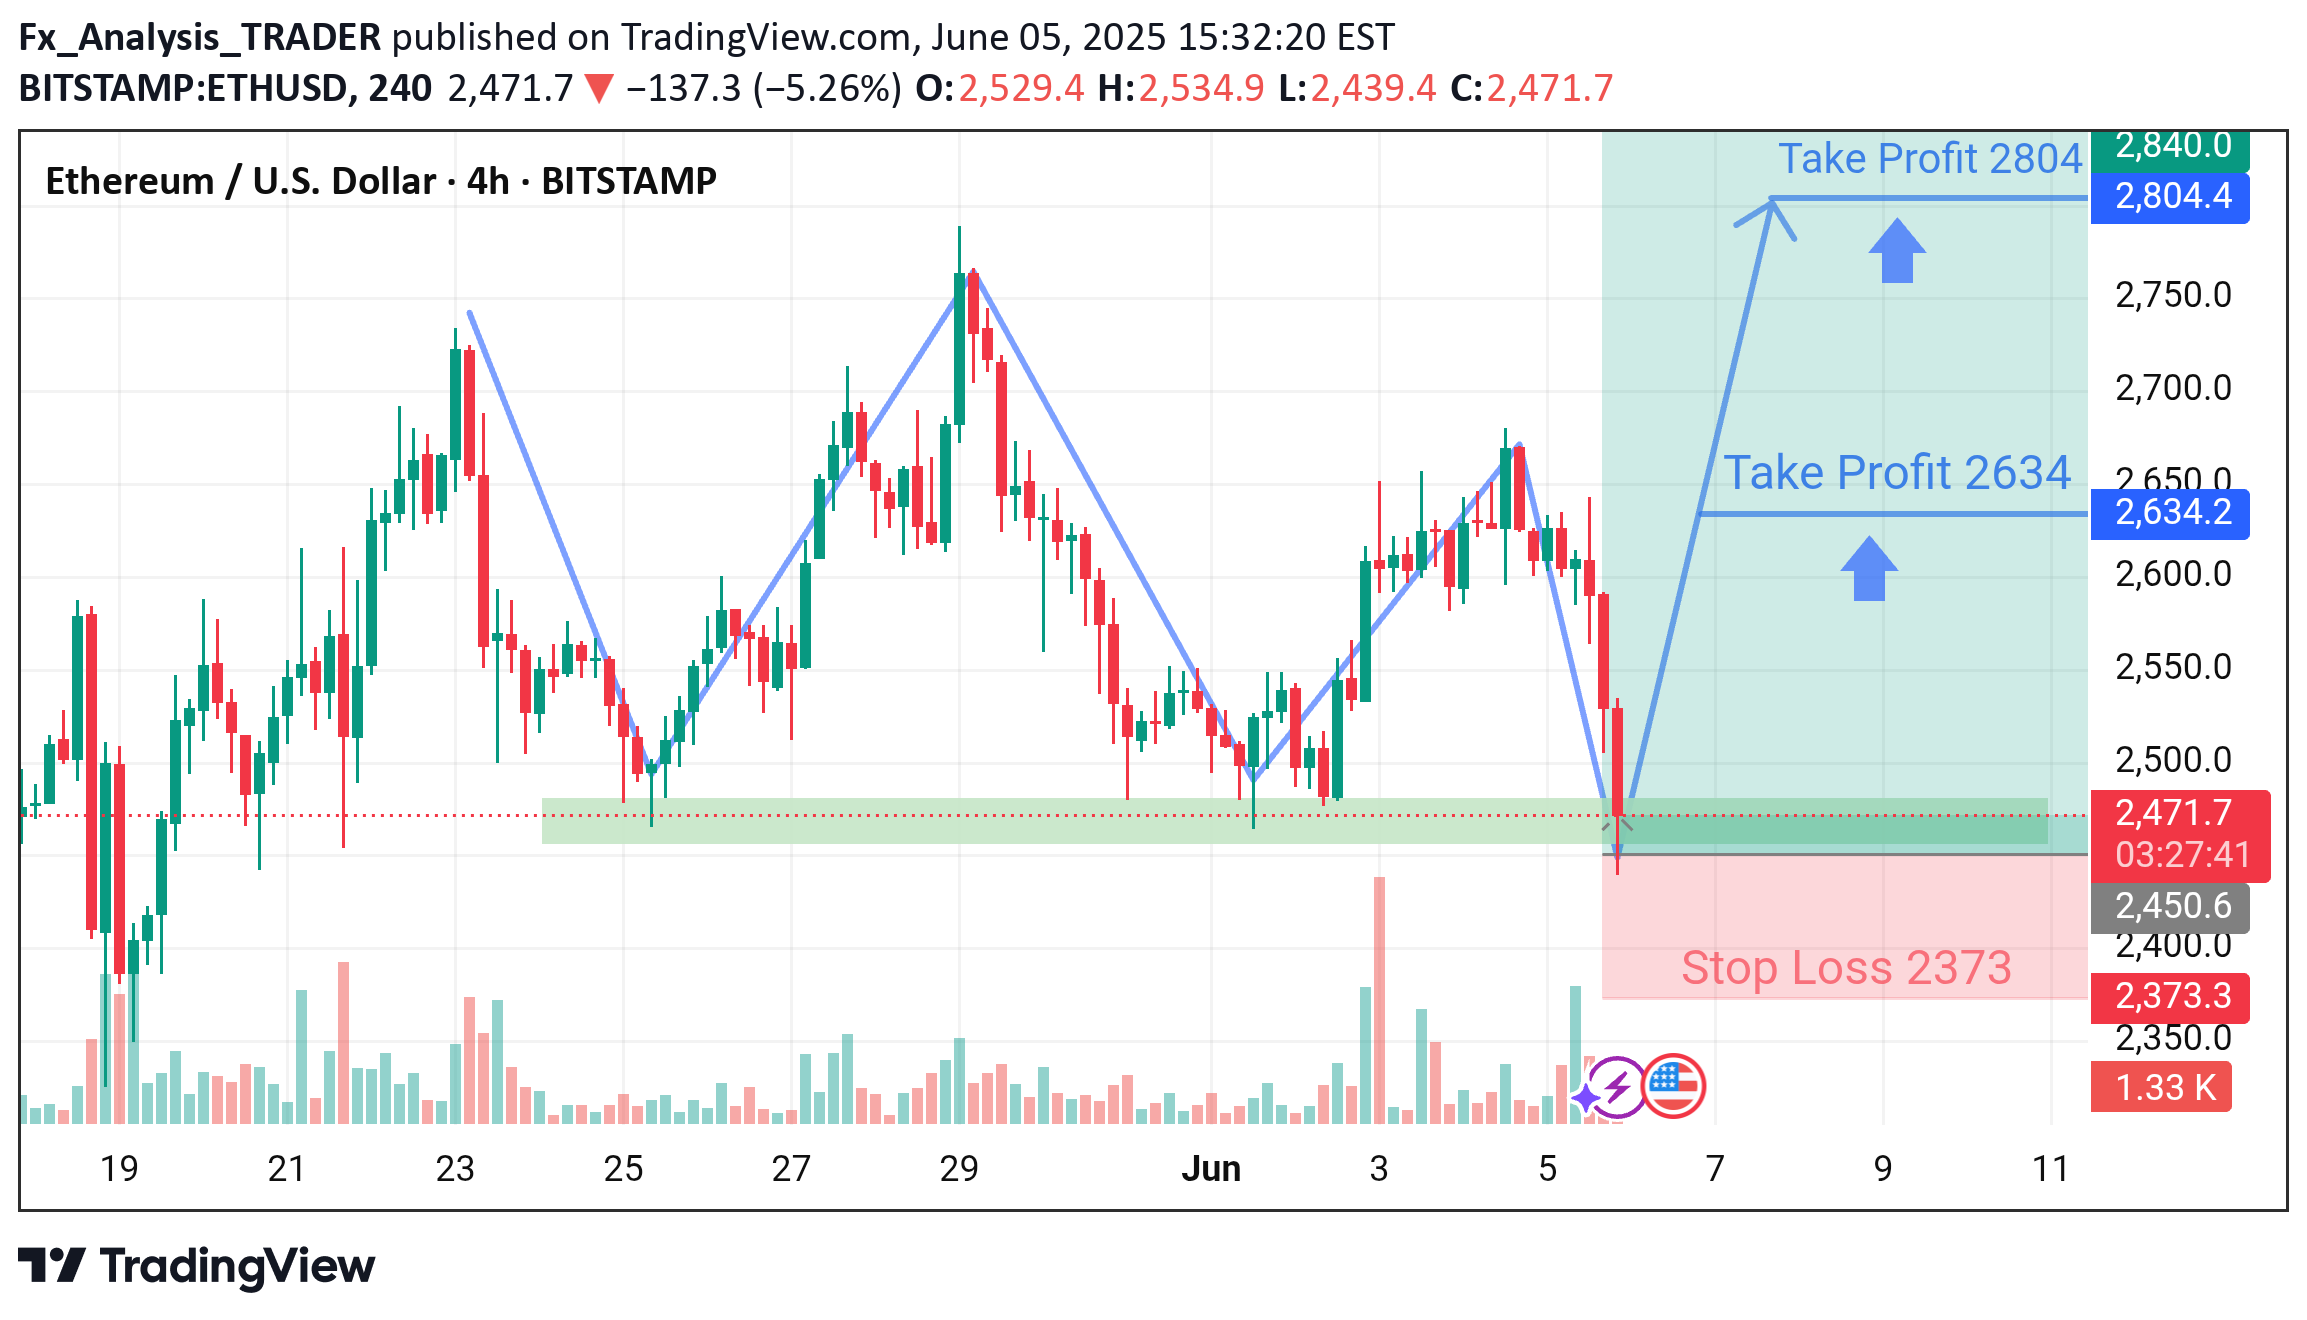
📈 ETH/USD – Bullish Reversal from Key Demand Zone (4H)Ethereum has approached a strong historical demand zone around the 2370–2400 area, showing signs of bullish rejection after a sharp corrective move. Price action suggests a potential bullish structure development, supported by volume confirmation.🔍 Technical Overview:✅ Rejection from Support Zone marked by previous price reactions.✅ Formation of a potential W-bottom pattern, signaling a reversal.✅ Buying pressure observed with increased volume near support.🔻 Previous drop of ~5% may attract buyers seeking value entries.🛠️ Trade Plan (For Educational Purposes):> This setup is shared purely for analysis and learning. Please manage your risk accordingly.Entry Area: Around 2470–2485Stop Loss: 2373 (below structural support)Take Profit 1: 2634Take Profit 2: 2804Risk-Reward Ratio: Favorable (1:2.5 to 1:4)📌 Notes:📊 If price confirms above the local resistance near 2530–2550, bullish continuation becomes more likely.⛔ No signals or financial advice – purely an educational idea based on structure, support/resistance, and volume.💬 Your Thoughts?Do you agree with this bullish reversal idea? Share your view or let’s discuss further below! 👇#Ethereum #ETHUSD #CryptoAnalysis #TradingView #PriceAction #SupportResistance #BullishSetup

Fx_Analysis_TRADER

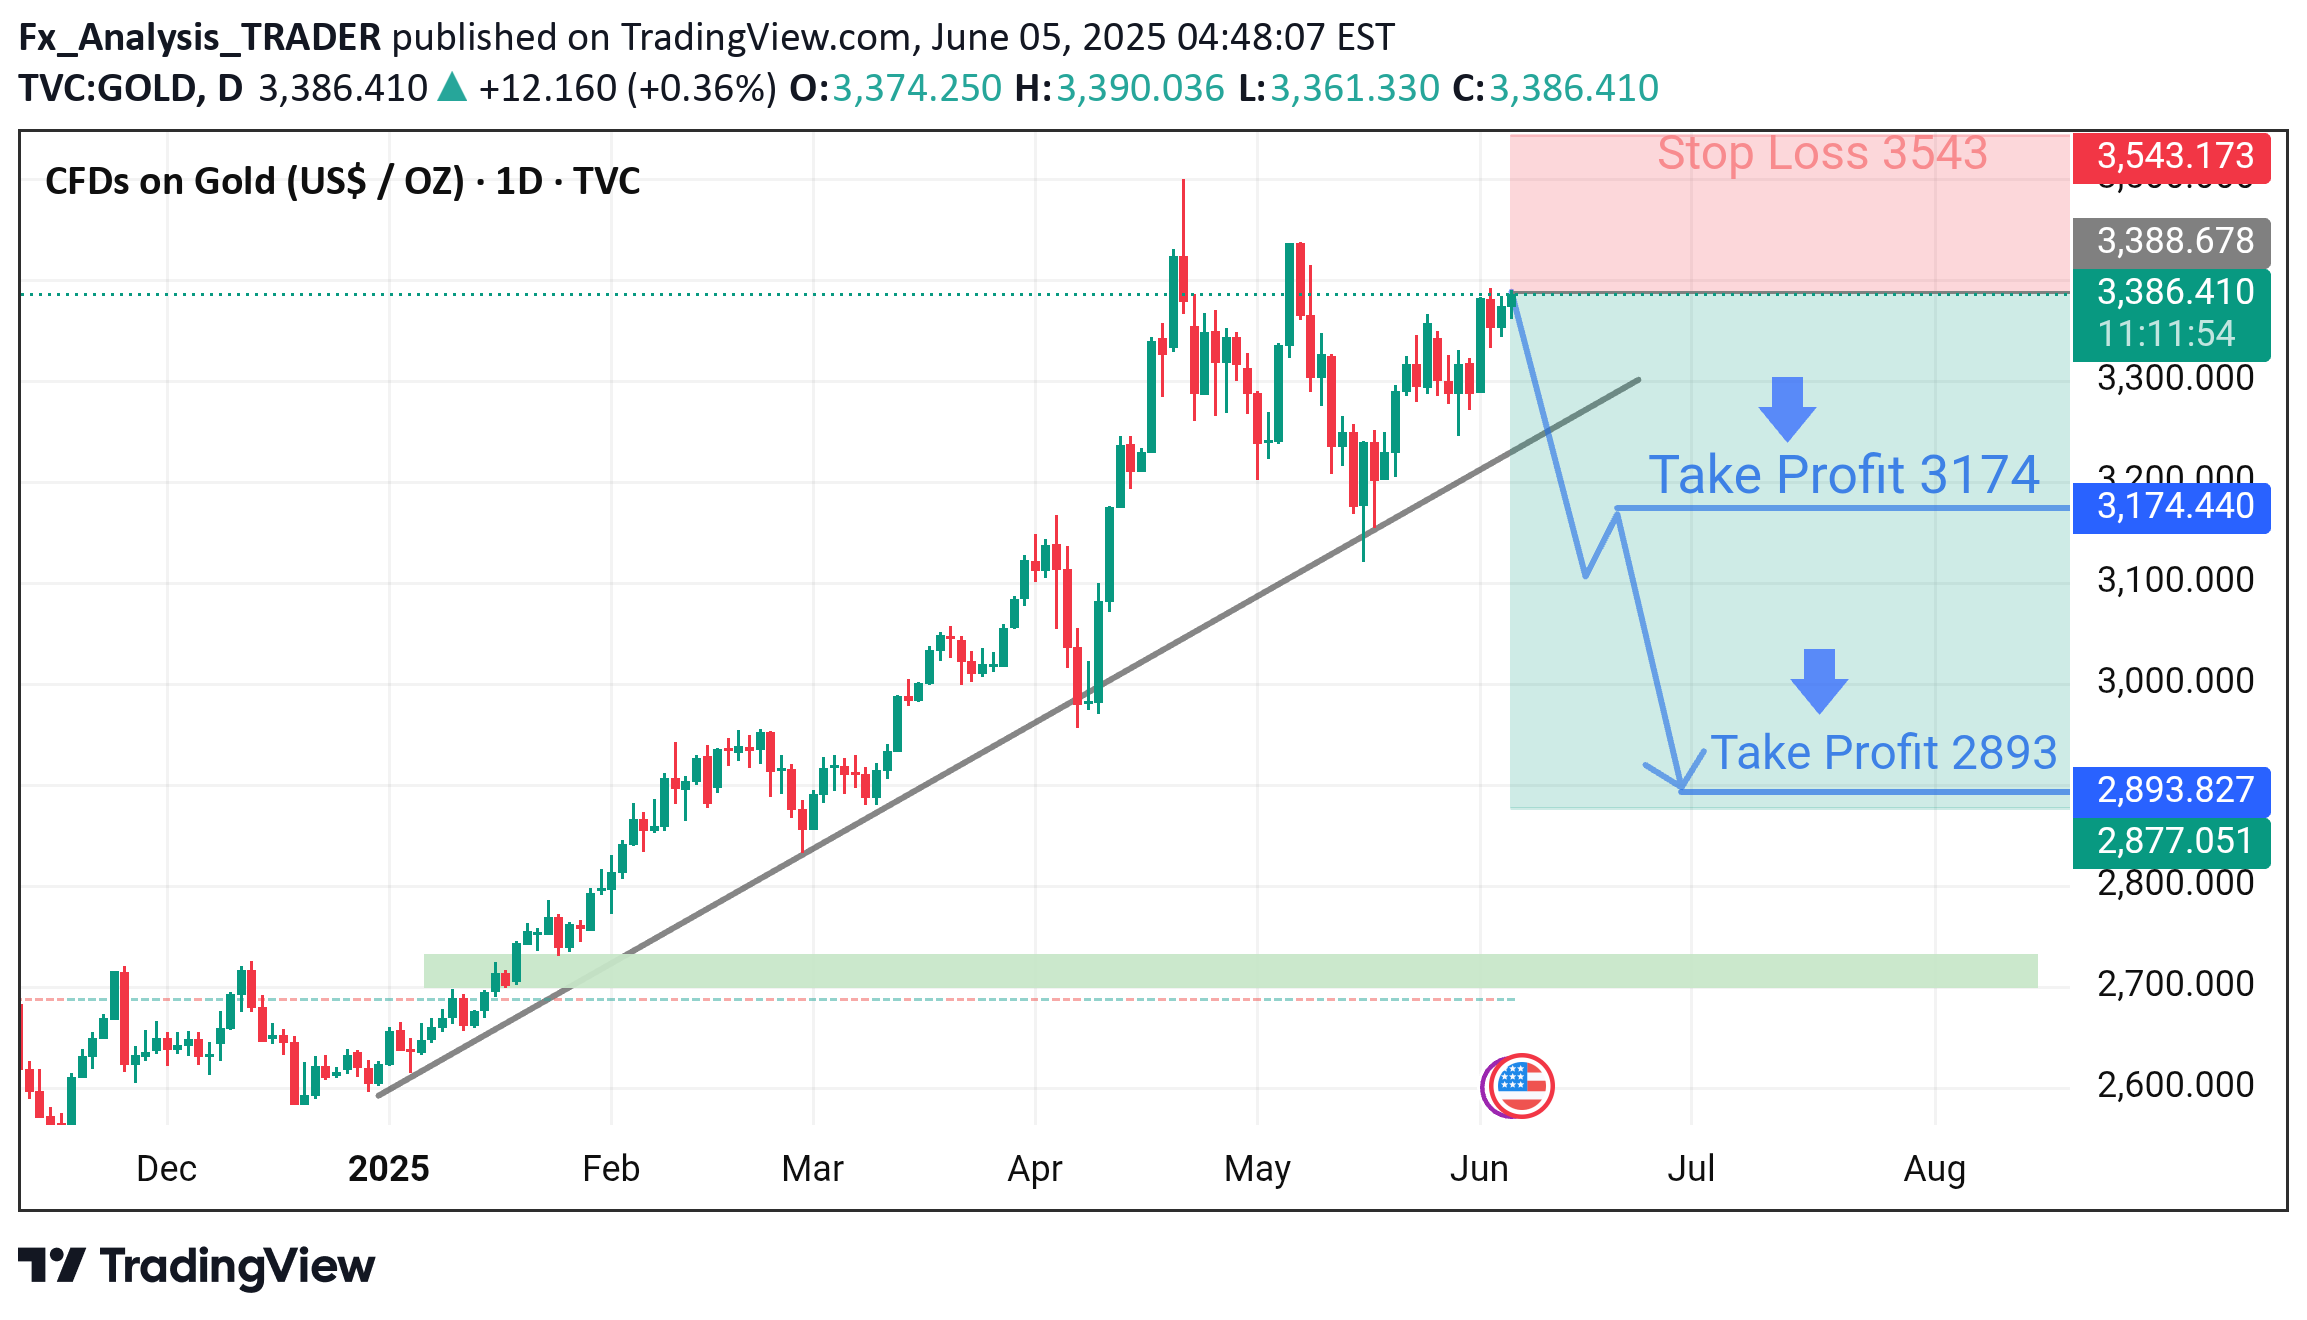
📉 Gold Approaching Key Technical Zone – Daily TimeframeGold (XAU/USD) is currently trading near a crucial resistance at 3385, closely aligned with a long-standing ascending trendline. A confirmed break below this level could open the door for further downside momentum.🔹 Key Levels:•Sell Zone: Below 3385 with confirmation•Take Profit 1: 3174•Take Profit 2: 2893•Stop Loss: 3543📊 This analysis is purely educational and based on technical observations. Traders are advised to apply proper risk management based on their own strategy.🧠 Idea: If price breaks below the trendline and sustains, bearish momentum may accelerate—especially if key support levels fail to hold.#Gold #XAUUSD #TechnicalAnalysis #PriceAction #TrendlineBreak #TradingViewIdeas #GoldForecast #ForexEducation #RiskManagement #SwingTrade #DailyChart
Disclaimer
Any content and materials included in Sahmeto's website and official communication channels are a compilation of personal opinions and analyses and are not binding. They do not constitute any recommendation for buying, selling, entering or exiting the stock market and cryptocurrency market. Also, all news and analyses included in the website and channels are merely republished information from official and unofficial domestic and foreign sources, and it is obvious that users of the said content are responsible for following up and ensuring the authenticity and accuracy of the materials. Therefore, while disclaiming responsibility, it is declared that the responsibility for any decision-making, action, and potential profit and loss in the capital market and cryptocurrency market lies with the trader.