
Futurologist
@t_Futurologist

What symbols does the trader recommend buying?
Purchase History
پیام های تریدر
Filter
Futurologist
4-year cycle tops. Right & left translated.
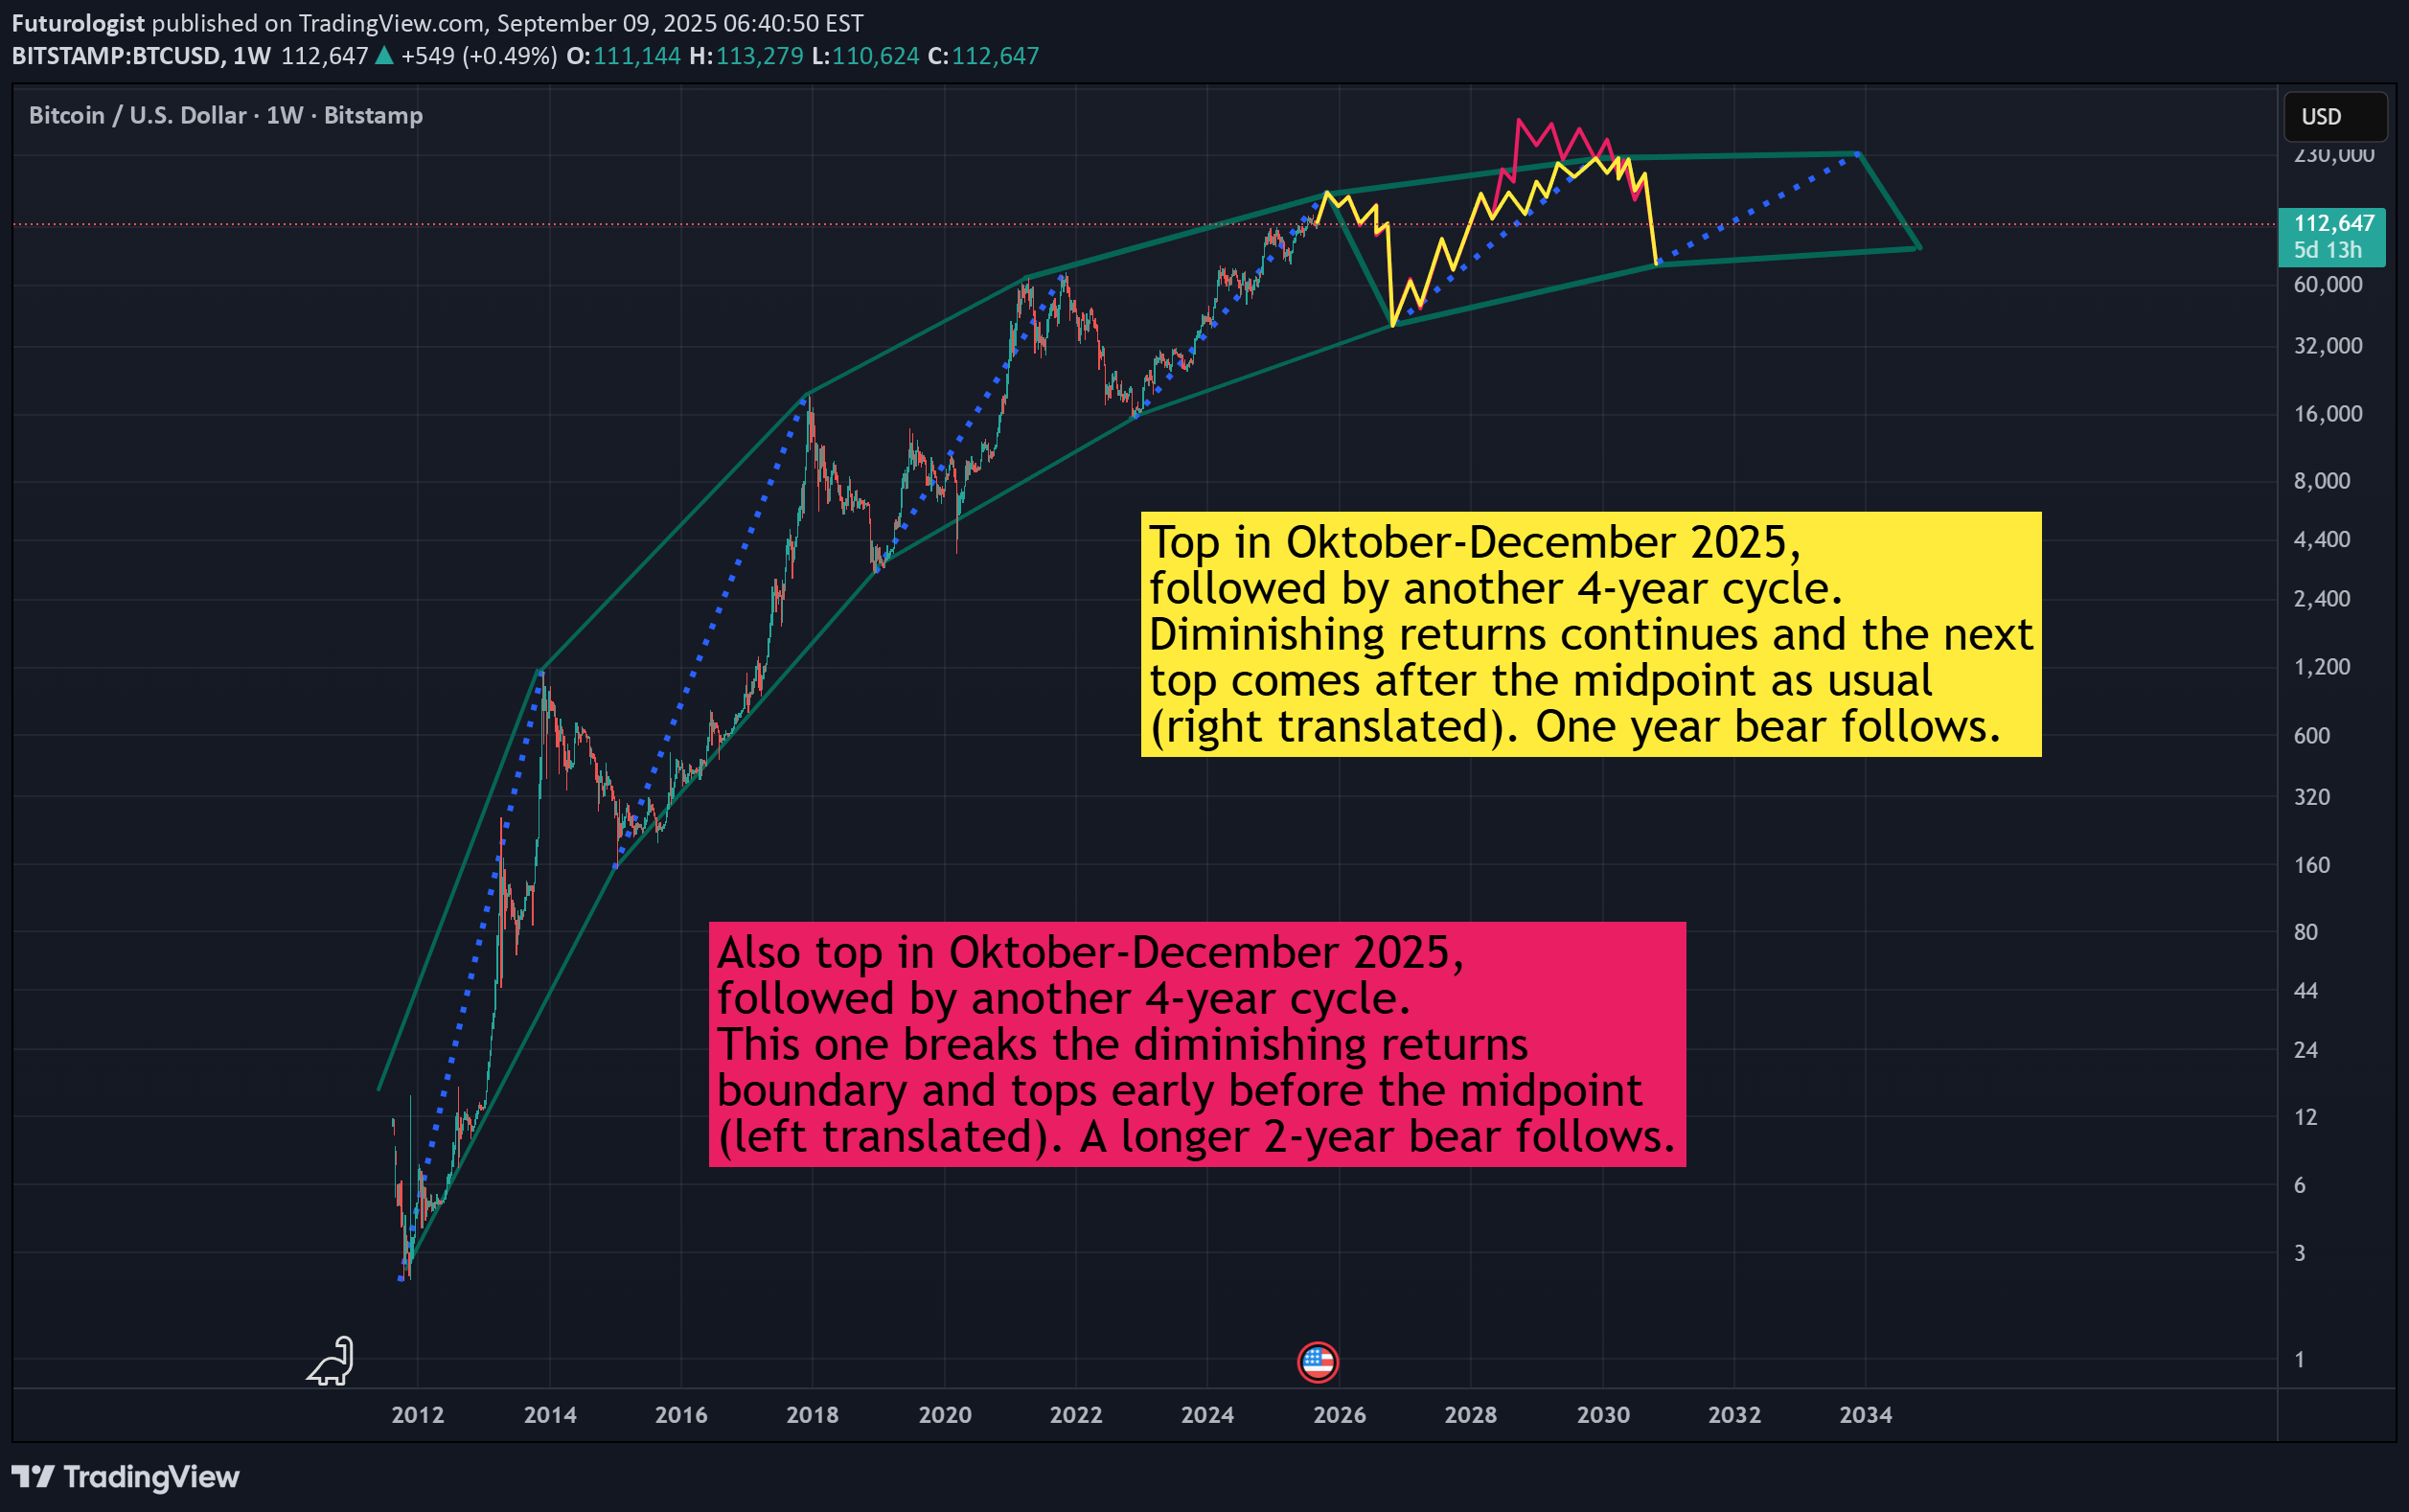
Most likely scenario for this 4-year cycle top is that it tops as usual in the last quarter (October - December). No mania yet, so perhaps it could be early 2026 as well. Who knows how high, but somewhere around 130 000 usd to 170 000 usd wouldn't be impossible. The bear bottom that follows could go as low as 60 000 - 40 000 usd. -------------- 2 possible scenarios for the following 4-year cycle (2027-2030): Scenario one It does its thing with a 3 year bull followed by a 1 year bear. As I understand it, you should measure the 4-year cycle (or any cycle) bottom to bottom. I.e. the top in this scenario comes after the midpoint of the cycle. So, a right translated top as usual. Maybe price could go up to above 200 000 usd. Scenario two The top comes before the midpoint (left translated), perhaps late 2028. 2 year up, 2 year down. Hopefully the diminishing returns boundary breaks. Maybe price could reach above 300 000 usd. A long 2 year boring bear market follows. The bear bottom that follows any of the 2 scenarios could go as low as 100 000 - 75 000 usd. This post from about a year ago is somewhat related: tradingview.com/chart/BTCUSD/iZawaxi7-Top-between-May-and-December-2025/
Futurologist
Top between May and December 2025

2 possible scenarios: Early top in May 2025 or a more normal top in December 2025. Also, a December top might mean a double top just like 2021. Who knows how high, but somewhere around 110 000 to 140 000 wouldn't be impossible.So far kind of follows the the normal 4 year cycle with a top in the last quarter. Perhaps December.
Futurologist
Bitcoin: 3 possible macro scenarios

Red Right-translated (barely), tops early 2025, maybe around 150k (early bottom, not followng 4-year cycle) Green Tops late 2025, around 180k perhaps (Bottoms out according to the 4-year cycle) Blue Left-translated cycle, tops mid 2024, perhaps around 130k (Bottoms out according to the 4-year cycle)
Futurologist
Repeat of the 2019 bullrun

Maybe a repeat of the 2019 bullrun? That would mean the 4-year cycle can be kind of correct when counting from bottom to bottom. The bear could be a few months shorter than 2014 & 2018.
Futurologist
Bitcoin hopium

Hopefully a blow-off top around the end of this year, or beginning of 2023. 69k may have been a premature rounded top, but that might also mean a shorter and less nasty bear. Perhaps the end of the downtrend is near. Maybe within a week or so. Then off to the races. This chart is pure amateur hopium. Actually not sure what I'm doing. Not very confident that the price cannot break out of the logarithmic growth channel. Meaning the top could be highter (and lower).
Futurologist
Bitcoin top & bottom

Don't know any TA, especially not Fib Channels & Logarithmic Growth Curves. Meaning, this chart is likely technically wrong (comment on my errors if so). Anyway, accoring to this amazing chart Bitcoin might bottom out by the end of this month (or beginning of February) at around 37k - 24k. And then continue to top out at about 200k in July - September. Followed by a bear market that may bottom a year later at around 30k.
Disclaimer
Any content and materials included in Sahmeto's website and official communication channels are a compilation of personal opinions and analyses and are not binding. They do not constitute any recommendation for buying, selling, entering or exiting the stock market and cryptocurrency market. Also, all news and analyses included in the website and channels are merely republished information from official and unofficial domestic and foreign sources, and it is obvious that users of the said content are responsible for following up and ensuring the authenticity and accuracy of the materials. Therefore, while disclaiming responsibility, it is declared that the responsibility for any decision-making, action, and potential profit and loss in the capital market and cryptocurrency market lies with the trader.