
Forex_Vip_Signals
@t_Forex_Vip_Signals

What symbols does the trader recommend buying?
Purchase History
پیام های تریدر
Filter
Signal Type
Forex_Vip_Signals
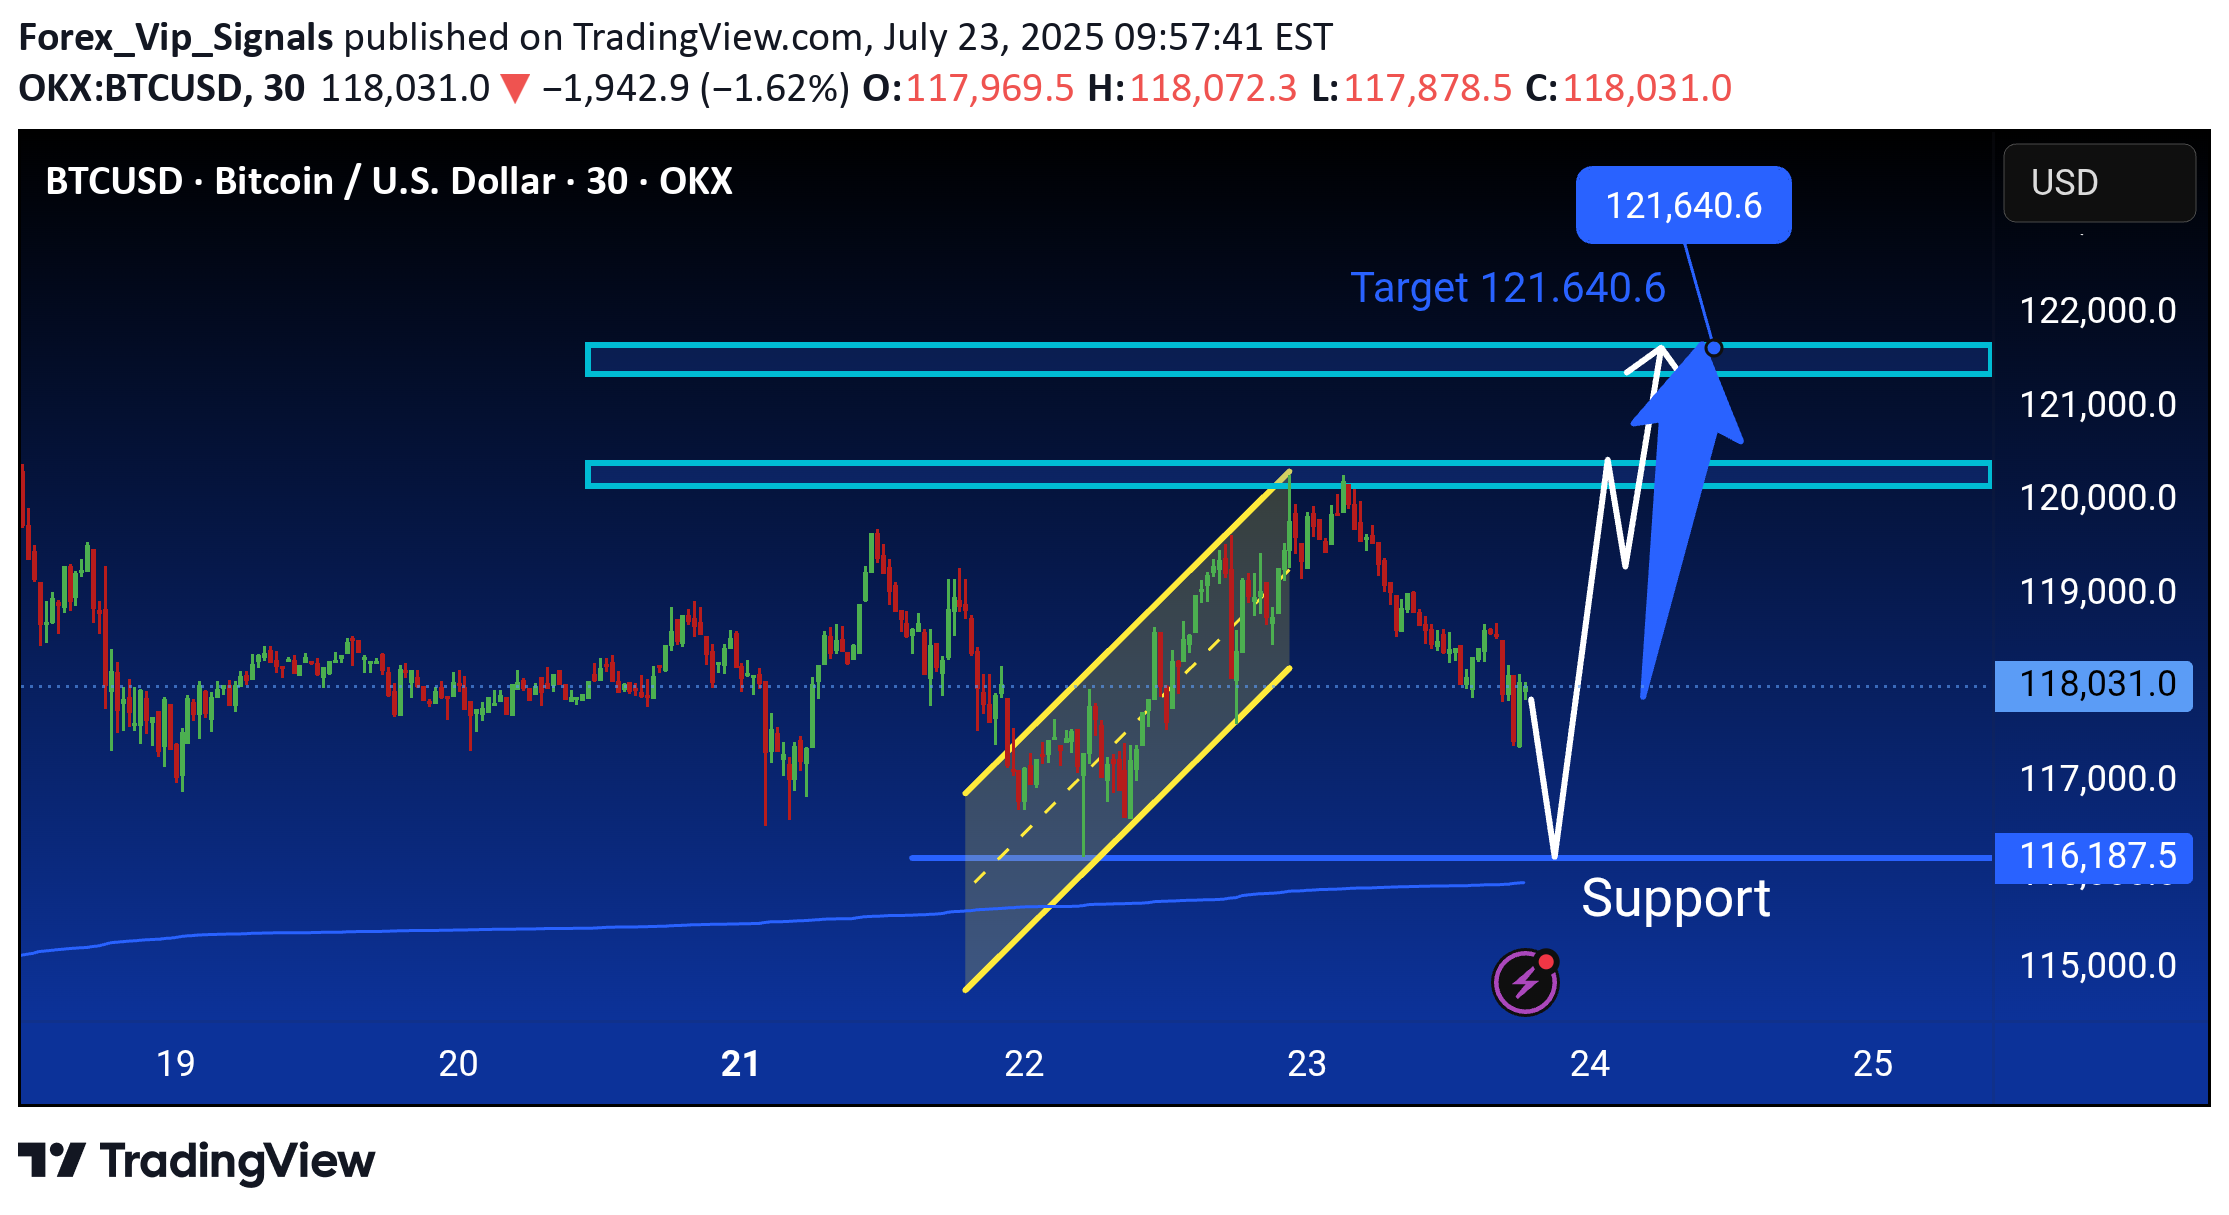
BTC/USD 30-min chart shows a potential bounce from the support zone around 116,187.5, aiming for a bullish move toward the target at 121,640.6. Price may retrace before pushing upward.
Forex_Vip_Signals
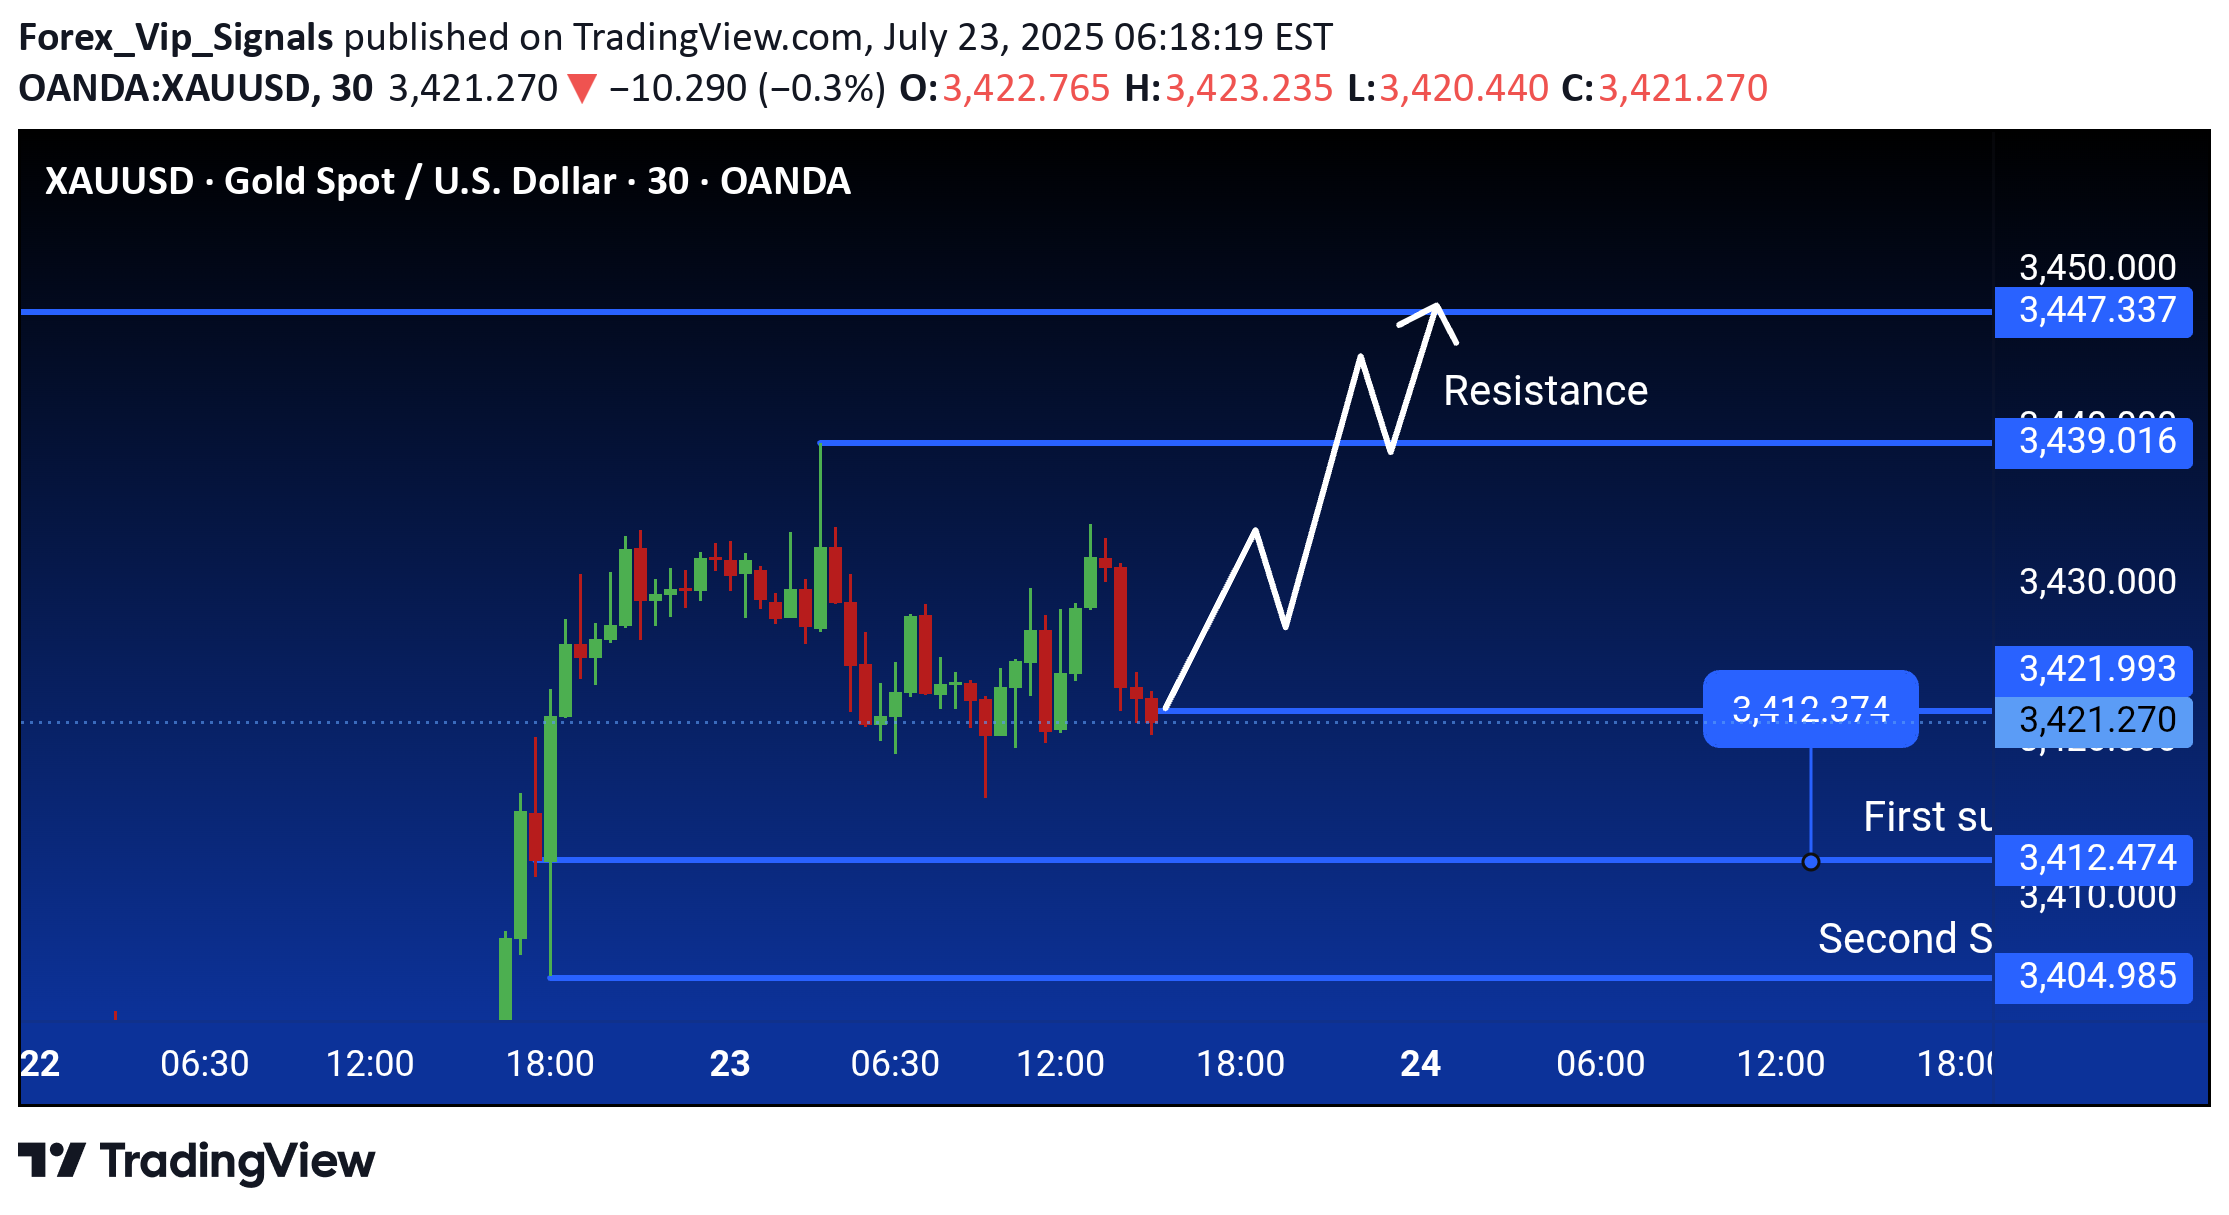
This 30-minute chart of XAUUSD (Gold vs. USD) shows key support and resistance levels. The price is currently around 3,422.615. Resistance is marked at 3,447.337, while the first and second support levels are at 3,412.474 and 3,404.985, respectively. The chart suggests a potential bullish move toward resistance.
Forex_Vip_Signals
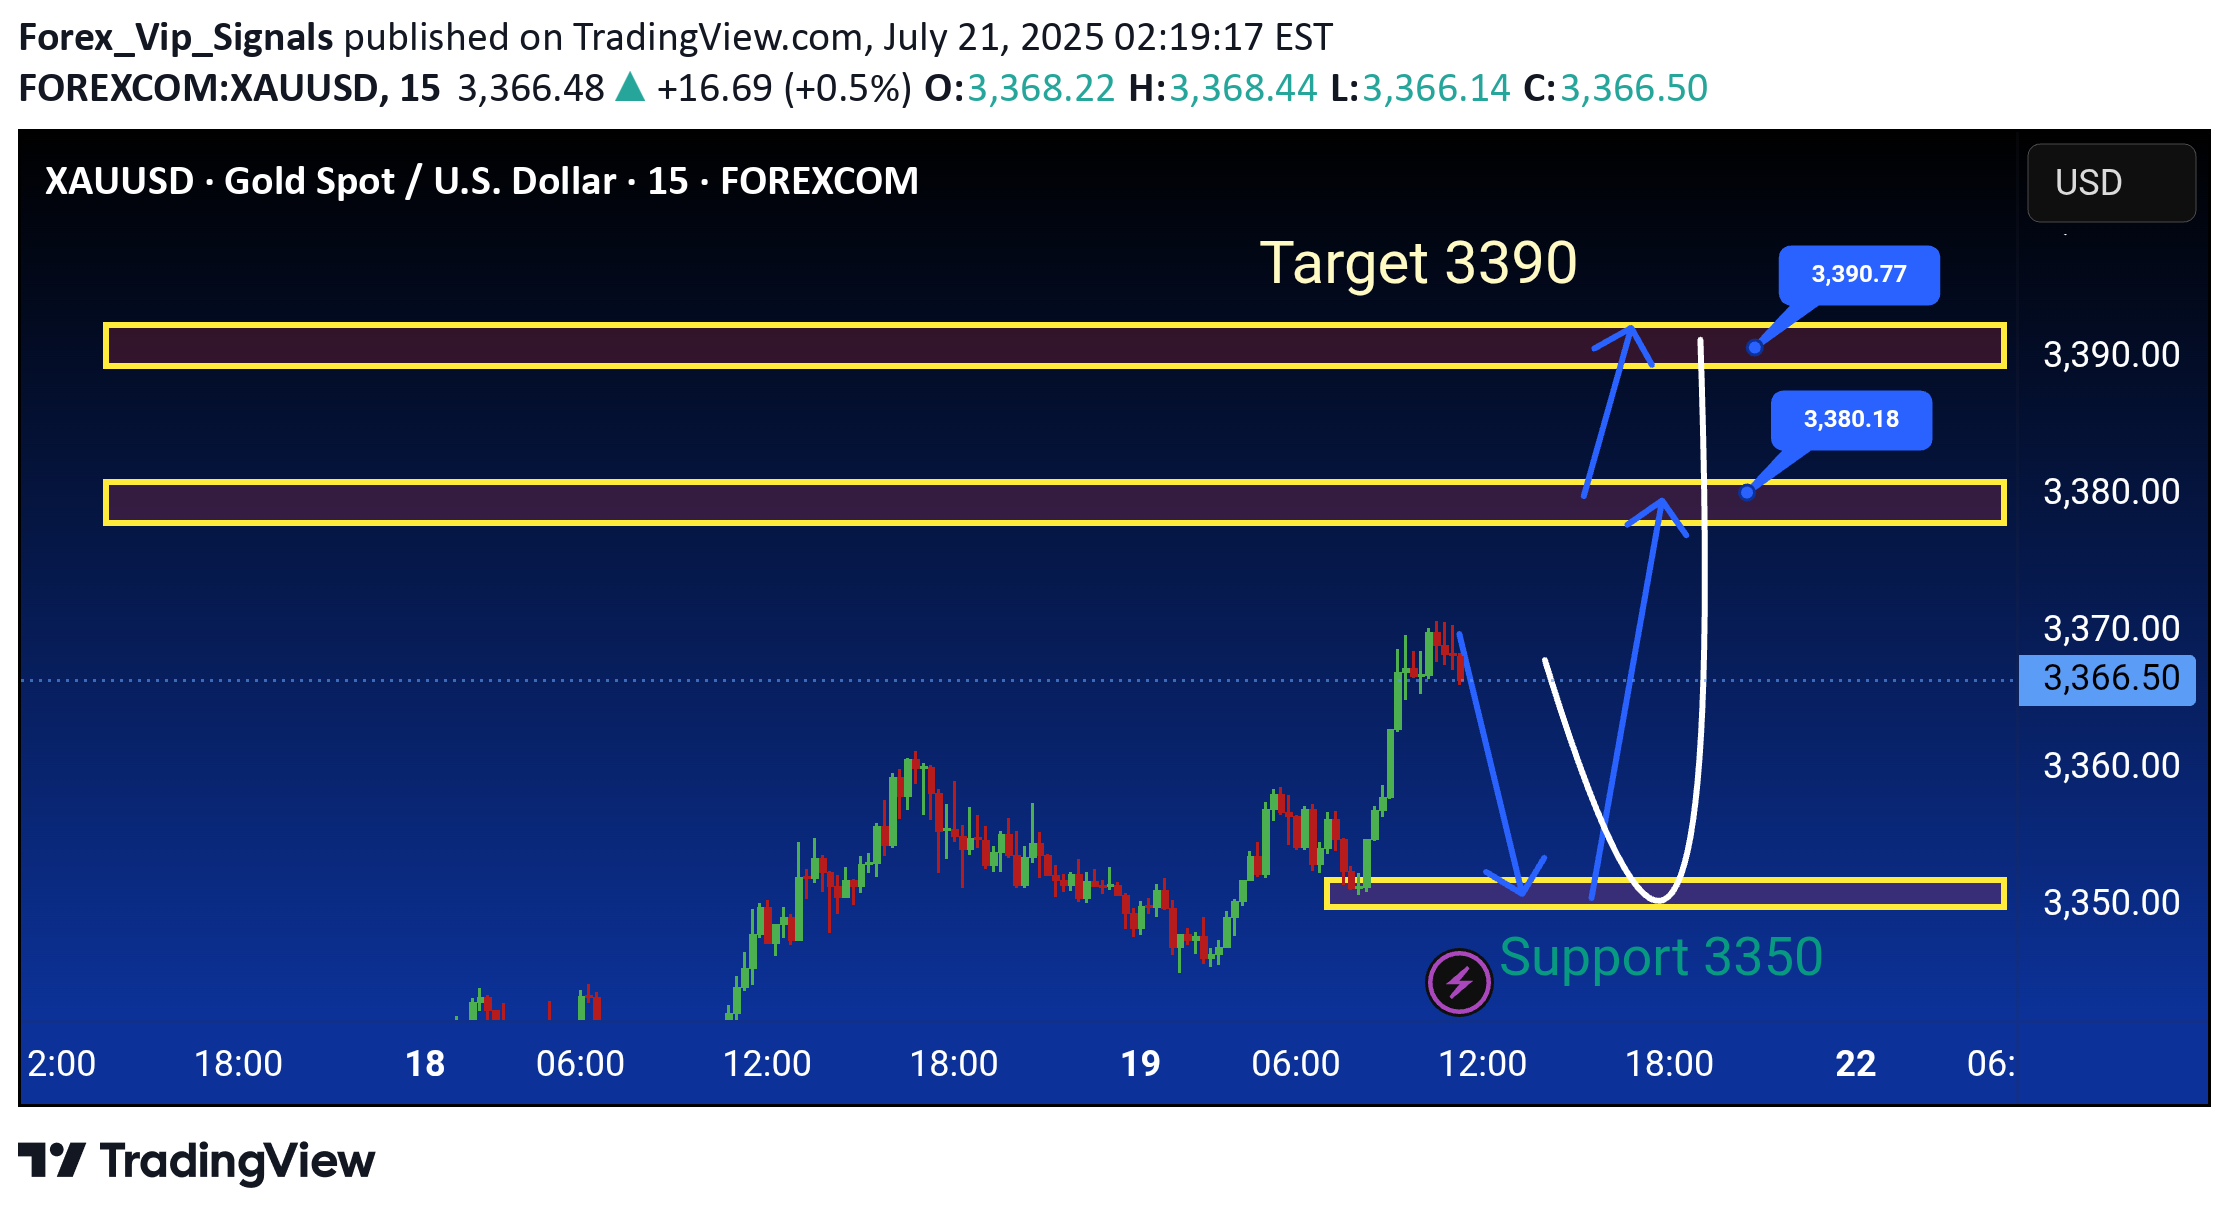
technical analysis of XAUUSD (Gold Spot vs. US Dollar) on the 15-minute timeframe using support and resistance levels, with projected price movements annotated. Key Levels: Support Zone: Around 3350 USD (labeled as "Support 3350") Resistance Zones: Minor resistance: Around 3380.18 USD Major resistance: Around 3390.77 USD Target: 3390 USD, highlighted as the ultimate bullish goal. Current Price: Price at the time of analysis: ~3368.30 USD Analysis Summary: 1. Support Retest Scenario: Price may pull back to the 3350 support zone. If this support holds, a bullish reversal is expected. The anticipated move is a rebound back toward the resistance zone at 3380, and possibly to the target at 3390. 2. Immediate Bullish Continuation: Alternatively, price could continue upwards from the current level without revisiting support. Resistance around 3380 may act as a minor barrier. If broken, the price could reach the target at 3390. 3. Bearish Risk: If 3350 fails to hold as support, further downside may occur, invalidating the bullish setup. Strategy Implication: Buy positions could be considered on a successful retest and bounce at 3350. Take-profits might be set near 3380 and 3390. Traders should watch for price action confirmation at key levels before entering trades. This is a classic support-resistance trading setup with short-term bullish bias aiming for a breakout toward higher resistance levels
Forex_Vip_Signals

This is a technical analysis chart of XAU/USD (Gold vs. US Dollar) on the 1-hour timeframe from TradingView. Here’s a breakdown of the key elements in the analysis:1. Trend Analysis:The chart shows an uptrend, with price moving within a rising channel.A bullish cup formation is visible, indicating potential continuation of the uptrend.2. Support & Resistance Levels:Support Zone: Around $2,810 - $2,800, marked as a stop-loss level.Resistance Zones:$2,874.45 (highlighted in yellow)$2,879.47 (potential breakout target)3. Trading Strategy:Bullish Setup: The chart suggests a potential breakout above $2,874.45, leading towards $2,879.47.Entry Point: Around $2,816.58 (current price level).Stop Loss: Below $2,810 - $2,800 to manage risk.Take Profit Targets:First target around $2,874.45.Second target around $2,879.47.4. Confirmation Factors:Breakout & Retest: The blue arrows indicate a possible breakout, followed by a retest of the resistance before a stronger bullish move.Trendline Support: The ascending trendline acts as dynamic support, reinforcing bullish momentum.Conclusion:Bullish Bias: If price sustains above $2,816, the target levels of $2,874 - $2,879 seem achievable.Risk Management: A stop loss around $2,800 ensures protection against unexpected reversals.Would you like more insights on potential risks or alternative trade setups?
Forex_Vip_Signals

This chart is an analysis of the XAU/USD (Gold vs. US Dollar) market on the 1-hour timeframe. Here's the breakdown:1. Trend Overview:The price is moving in an upward channel (marked by parallel yellow lines), indicating a bullish trend.There was consolidation earlier, as shown by the blue shaded channel, but the breakout above this zone signals bullish momentum.2. Key Levels:Demand Zone (Resistance): 2840. This is highlighted as a potential resistance area where the price may struggle to break higher.First Take Profit (TP): 2800. This is the initial target for profit-taking based on the analysis.Stop Loss (SL): 2748. The stop-loss level is set below recent price support to minimize risk in case the market reverses.3. Price Movement Expectation:The yellow arrows indicate an expected upward movement. The price is predicted to move towards 2800 (first TP) and possibly continue towards 2840 (demand zone).Pullbacks or retests are expected along the way to maintain the bullish structure.4. Risk Management:The stop-loss at 2748 ensures risk is contained if the upward momentum fails.The chart suggests entering around the current level (2773) to target the resistance levels while maintaining proper risk-reward.This setup relies on the continuation of bullish momentum, with clear entry, target, and risk levels defined
Forex_Vip_Signals

This chart represents a technical analysis setup for gold (XAU/USD) on a 2-hour timeframe. Here's a detailed breakdown of the chart:1. Key Price Levels:Current Price: The price is around 2,739.88, as indicated by the blue marker.Stop Loss (Red Line): Placed at 2,720.00, this is the risk level where the trade will exit to minimize losses if the price falls below this level.Take Entry (Green Line): Suggested entry point for a buy trade, placed at around 2,730.00.Target 1 and Target 2 (Green Lines): Indicate the profit-taking levels:Target 1: Approximately 2,750.00.Target 2: Approximately 2,760.00.2. Trade Setup:The yellow arrow shows a potential bullish movement in price, starting from the entry point and reaching the defined targets.Risk Management: The stop-loss level is placed below the entry level to limit potential losses.Profit Zones: Two profit levels (Target 1 and Target 2) are defined for traders to lock in gains at different stages of the upward trend.3. Market Sentiment:The chart suggests a bullish outlook, indicating that the trader expects gold's price to increase after breaking above the entry level.The upward momentum is emphasized by the zigzag price movement, representing potential market pullbacks and continuations.This setup is aimed at traders who anticipate a breakout or continuation of gold's bullish trend, focusing on calculated entry and exit points to maximize profits while managing risk effectively.Target reached
Forex_Vip_Signals

This is a 1-hour candlestick chart of XAU/USD (Gold Spot against the US Dollar), showing technical analysis:1. Uptrend Channel: The yellow channel indicates an upward price trend. The price consistently bounced between the upper and lower boundaries of this channel.2. Breakout and Support: The price has broken out of the channel, forming a new area of support near 2,675. This level is marked by a blue horizontal line.3. Target Zone: A potential bearish scenario is highlighted, where the price could drop to the "Target Zone" near 2,650. This area is represented by a horizontal blue line at the bottom.4. Predicted Price Movement: The white zigzag lines depict possible price movements:A short-term rally testing the upper resistance near 2,680-2,690.A subsequent downward movement back to the support or the target zone at 2,650.5. Analysis Context:Traders are monitoring the resistance level for rejection or a further breakout.A break below the blue support line could lead to further selling pressure toward the 2,650 target zone.This chart likely reflects a near-term bearish bias following the break from the ascending channel.
Forex_Vip_Signals

This chart represents the Bitcoin (BTC) price movement against the US Dollar (USD) on a 1-hour timeframe. Here's a breakdown:1. Trend Analysis:The chart initially shows an ascending channel marked by green and gray lines, where Bitcoin's price moves upward.After reaching a peak, there is a sharp bearish correction, as indicated by the steep downward movement.2. Key Levels:Stop Loss: Marked below the current price near 93,192, this is the level where traders would close their position to limit losses.Target Zone: Two key target levels are marked for potential price increases:98,067 (first target level)100,597 (second target level)3. Trading Plan:A reversal scenario is depicted with upward yellow arrows, suggesting a potential recovery or bullish bounce from the current price.Green arrows highlight areas of potential buying interest or price support.4. Indicators:Heikin Ashi candles are used to smooth out price movements, making trends clearer.Red and green markers indicate resistance (red arrows) and support (green arrows) areas.The trader's strategy appears to involve entering a buy position at the current level, with the stop loss in place to manage risk and targeting higher levels near 98,067 and 100,597 for profit.40 pips runningHold
Forex_Vip_Signals

This chart depicts the price action of Gold (XAU/USD) on the 1-hour timeframe using Heikin Ashi candles. Below is the description:1. Key Levels:Stop Loss (Red Line): Positioned at 2671.01, this represents the level to exit the trade if the market moves against the position.Break Level (Gray Zone): Around 2660.28, this acts as a potential confirmation area for a trend change or continuation.Target (Blue Line): Set at 2630.71, indicating the take-profit level.2. Trend Analysis:The price has been fluctuating within an upward green channel before breaking downward.The yellow highlighted zone shows consolidation or a potential pullback area before the expected move.3. Prediction:Blue arrows suggest an anticipated bearish movement.The price is expected to retest the break level (2660.28) before dropping toward the target of 2630.71.4. Trading Plan:Short position from the break level with a target at 2630.71.Risk management with a stop loss at 2671.01.This chart appears to focus on a bearish setup, with the assumption that the price will follow the outlined downward movement after retesting resistance.60 pips runningHold
Forex_Vip_Signals

This is a technical analysis of the BTC/USD (Bitcoin/US Dollar) market on the 4-hour timeframe, using Heikin Ashi candles. Below is a description of the chart analysis:1. Trend and Pattern:A bullish ascending channel is identified with price consistently moving higher within the blue boundaries.A cup and handle pattern (yellow) suggests potential bullish momentum after a consolidation phase.2. Key Levels:Resistance Zones: Highlighted in purple at 104,008, 106,918, and 110,616, indicating potential target levels for upward movement.Support Zone: Marked with a red "Stop Loss" level below the current price at approximately 96,000, acting as a risk management level.3. Price Action:The price has broken out of the consolidation zone and is now testing higher resistance levels.Potential breakout scenarios are drawn, showing a pathway for price movement toward the upper resistance levels.4. Targets:First Target: 104,008.Second Target: 106,918.Final Target: 110,616.5. Risk Management:A stop-loss level is set below the previous swing low, ensuring a safety net if the price reversesHold
Disclaimer
Any content and materials included in Sahmeto's website and official communication channels are a compilation of personal opinions and analyses and are not binding. They do not constitute any recommendation for buying, selling, entering or exiting the stock market and cryptocurrency market. Also, all news and analyses included in the website and channels are merely republished information from official and unofficial domestic and foreign sources, and it is obvious that users of the said content are responsible for following up and ensuring the authenticity and accuracy of the materials. Therefore, while disclaiming responsibility, it is declared that the responsibility for any decision-making, action, and potential profit and loss in the capital market and cryptocurrency market lies with the trader.