
Forex_ViP_Signalss
@t_Forex_ViP_Signalss

What symbols does the trader recommend buying?
Purchase History
پیام های تریدر
Filter
Forex_ViP_Signalss
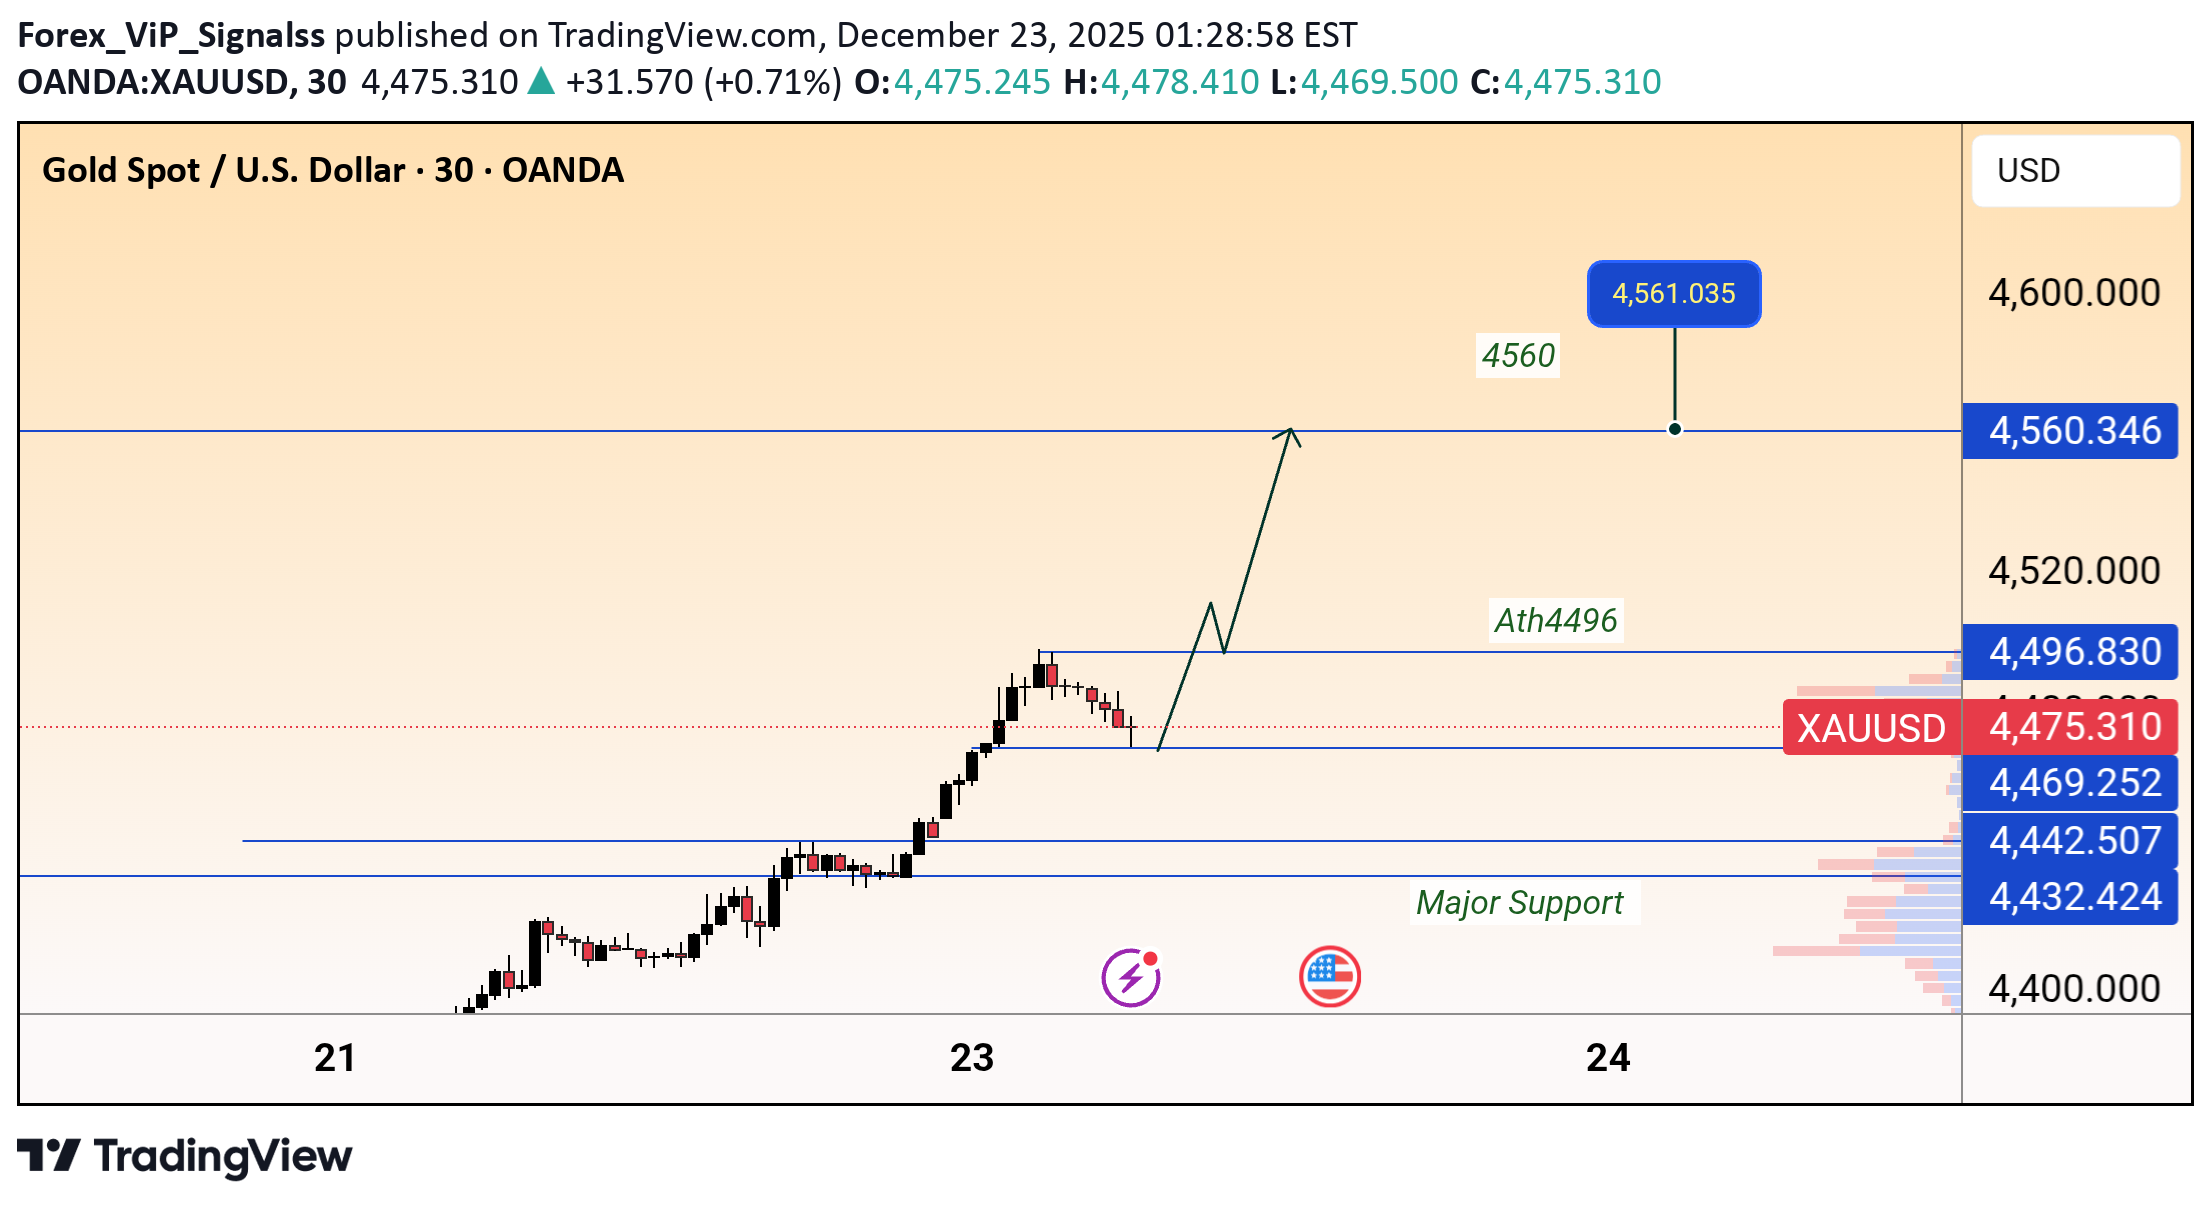
New ath is coming

Gold is holding above a strong support zone and showing bullish continuation signs. A pullback into the demand area could offer buy opportunities, with price expected to fill the gap and push higher. As long as support holds, the upside target remains around 4590.
Forex_ViP_Signalss
Gold setup

Gold shows a bearish pullback after rejection from resistance. Price is consolidating below the key zone, with downside targets toward 4291 → 4275 → 4238 if selling pressure continues.
Forex_ViP_Signalss
Bitcoin

Bitcoin is consolidating above key support around 86,700 after a strong pullback. Price faces short-term resistance near 88,000; a clean breakout could trigger bullish momentum toward 90,000–90,300. Holding above support keeps the upside scenario valid, while a breakdown may invite further downside pressure.
Forex_ViP_Signalss
Gold Next Levels
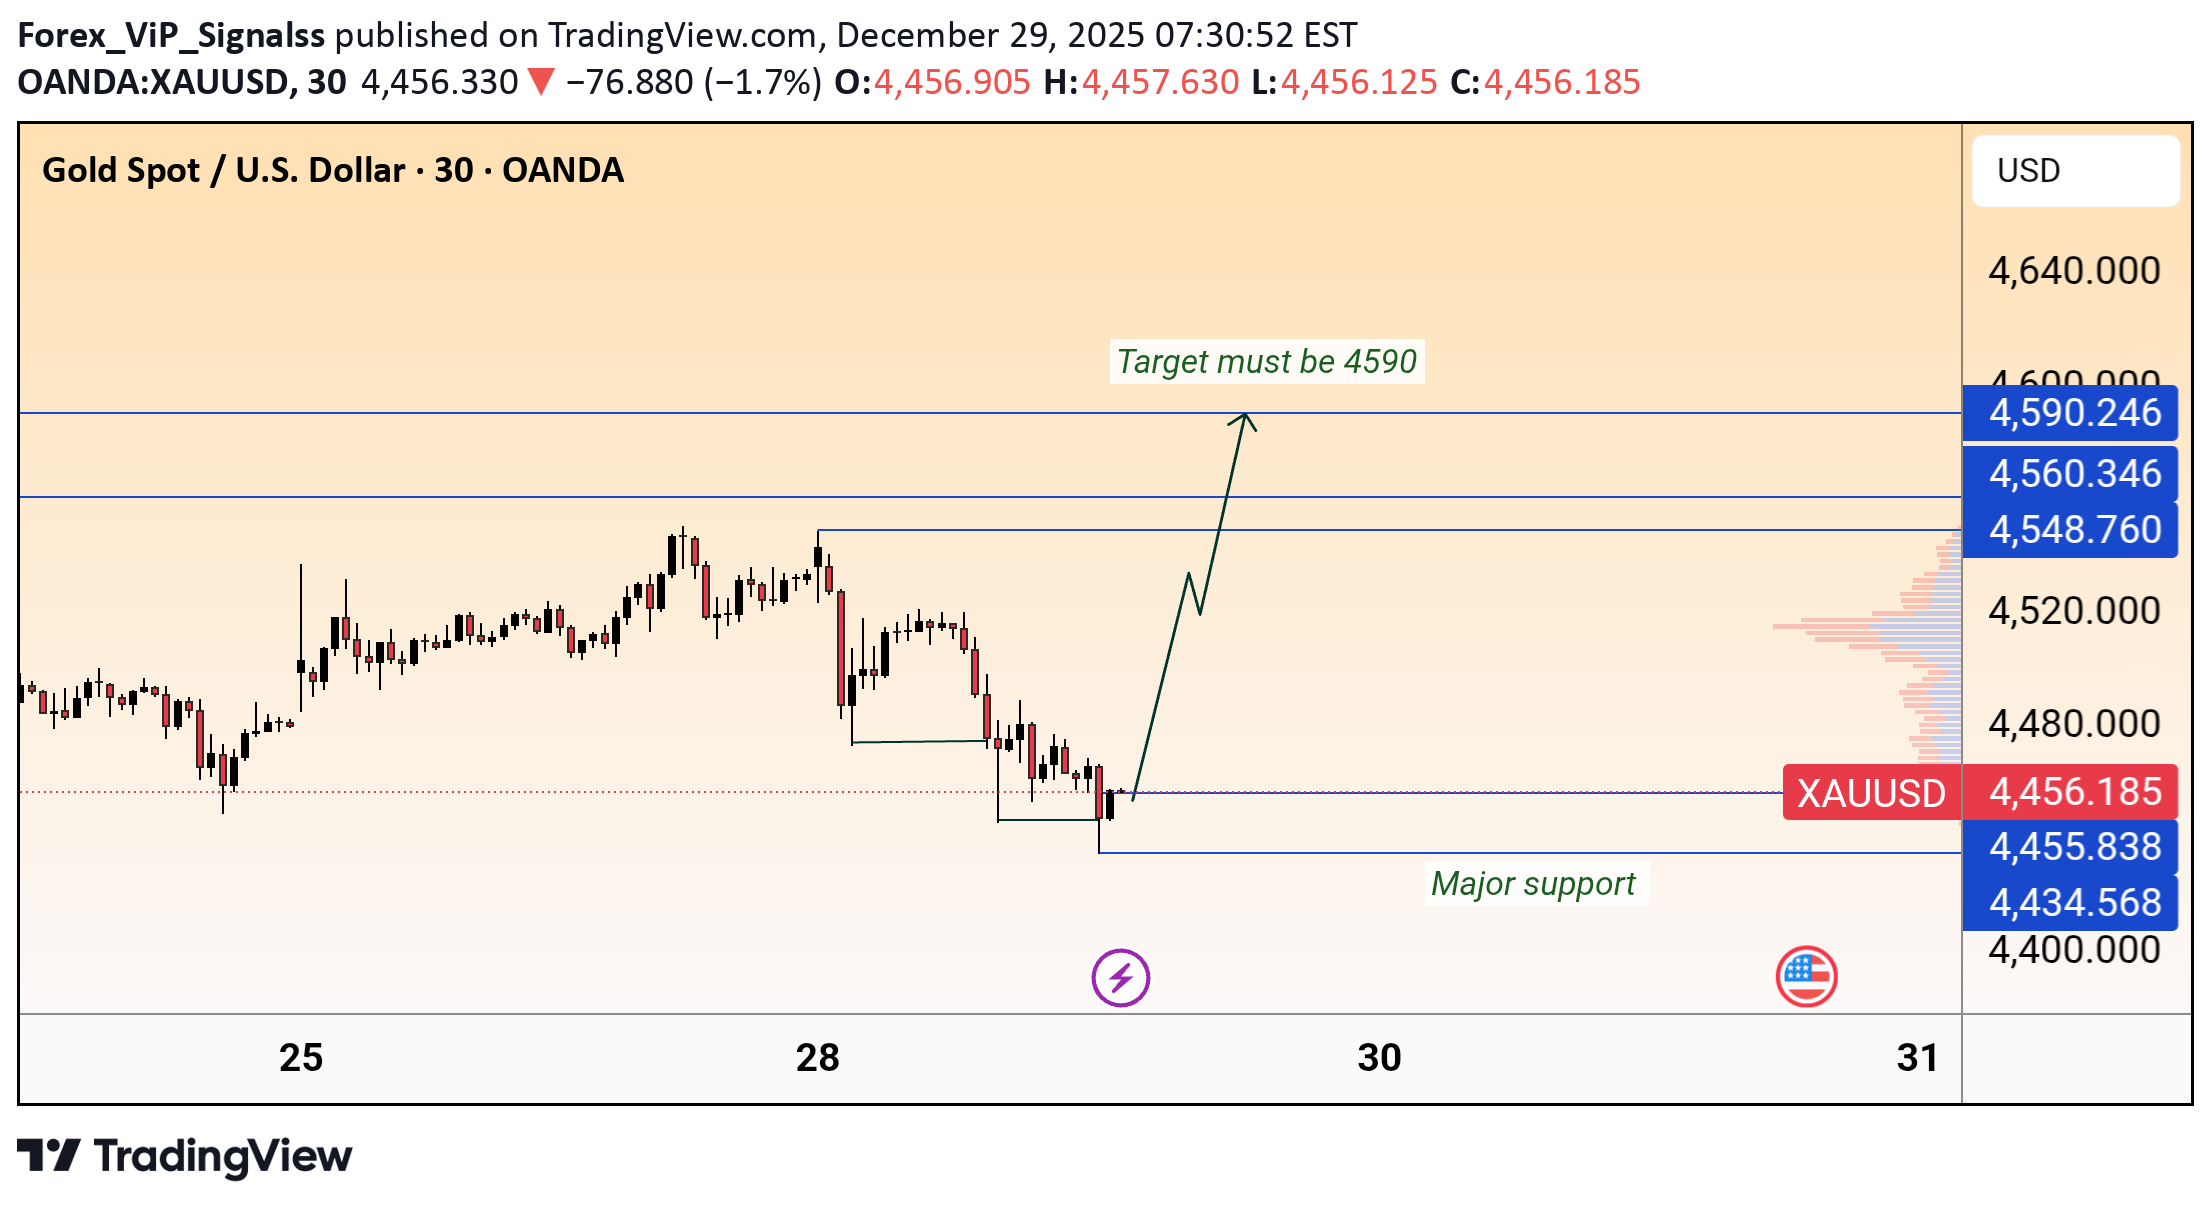
Gold is reacting from a major support zone near 4455, showing signs of a short-term bullish reversal. If price holds above this support, upside momentum could push XAUUSD toward 4560–4590 as the next target area. A clean breakout and hold above resistance will confirm further bullish continuation.
Forex_ViP_Signalss
XAUUSD Bullish Continuation
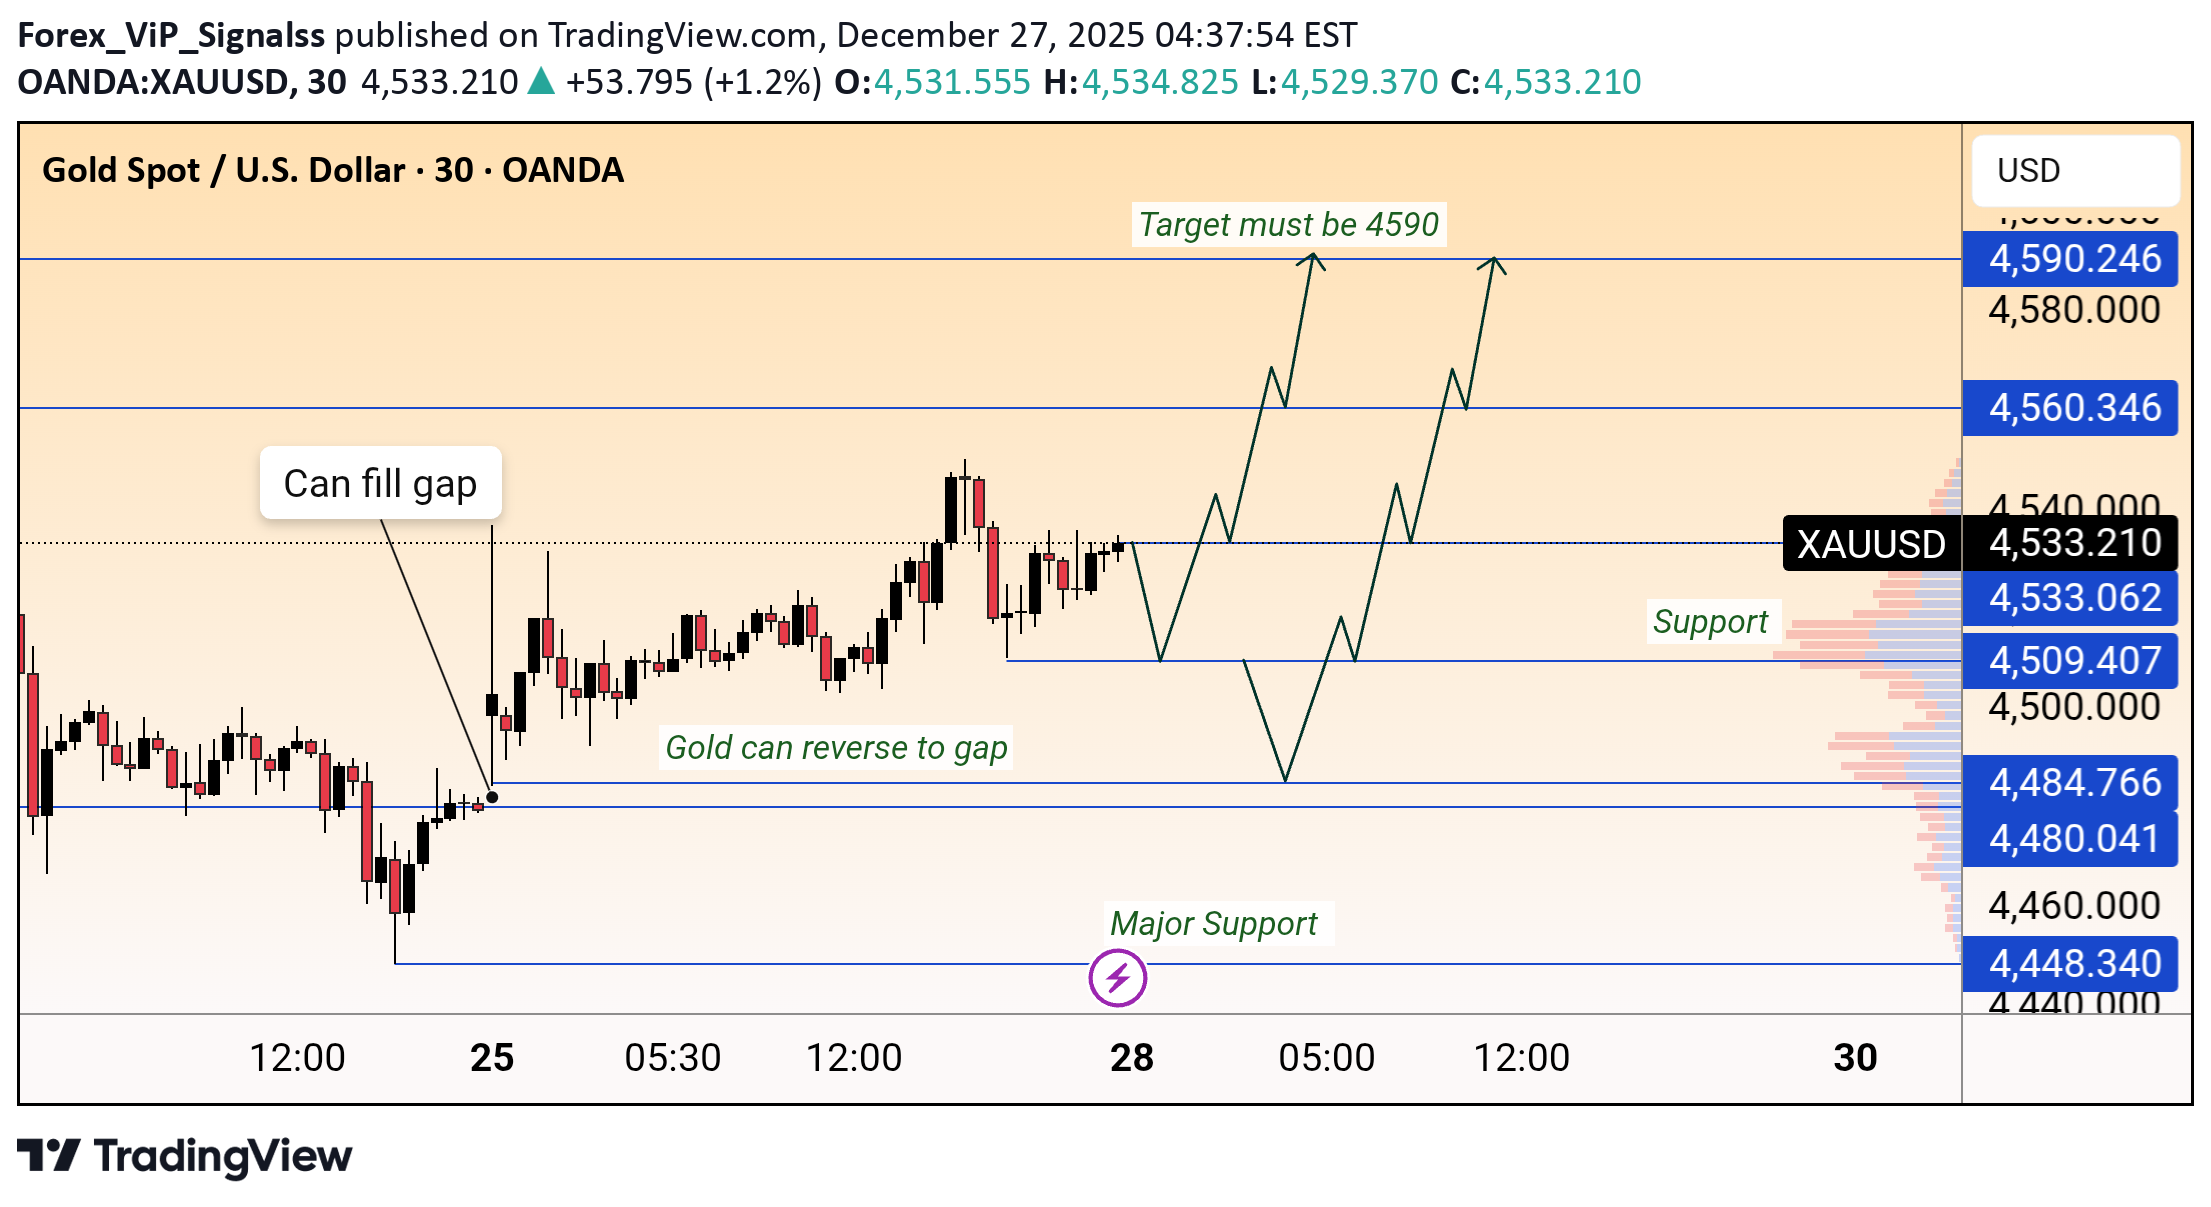
Gold is trading in a bullish structure after filling the previous gap. Price is holding above the key support zone around 4530–4509, indicating strong buying interest. A minor pullback toward support is possible, but as long as this area holds, bullish continuation is expected. The upside targets remain 4560 and 4590, where price may face resistance. A deeper drop toward 4485–4450 would act as major support and potential reversal zone. Overall bias stays bullish above support.
Forex_ViP_Signalss
Forex_ViP_Signalss
XAUUSD Bullish Continuation Toward 4374
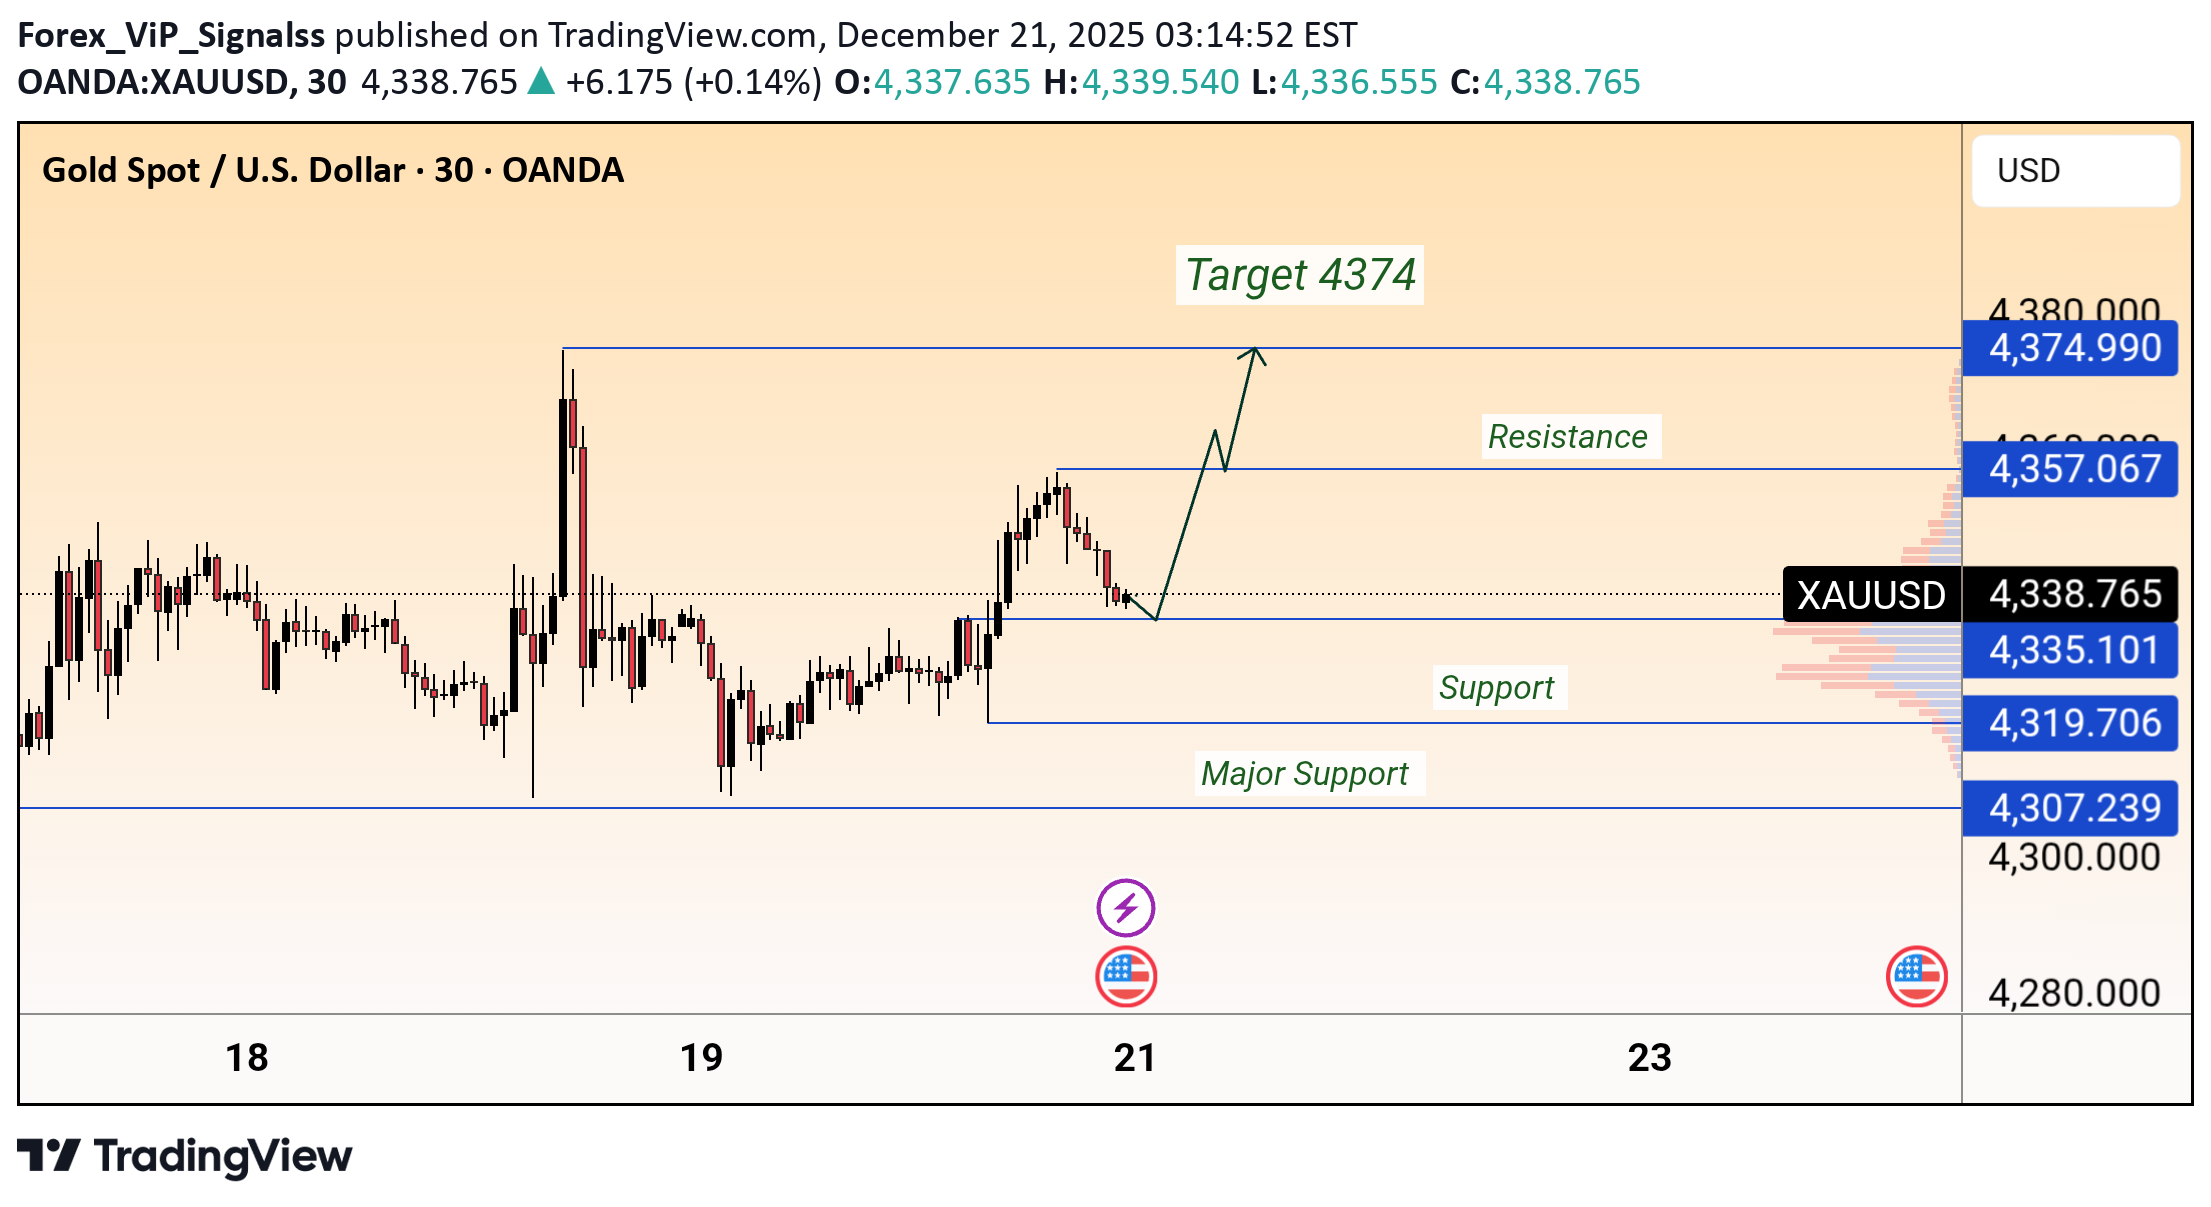
XAUUSD (30M) Short Description: Gold is holding above key support around 4335–4320 after a pullback. Price is showing bullish continuation potential, with resistance near 4357. A break and hold above resistance could push price toward the 4374 target, while major support remains around 4307.Hit 4374Exactly same move target done
Forex_ViP_Signalss
Cpi news plan
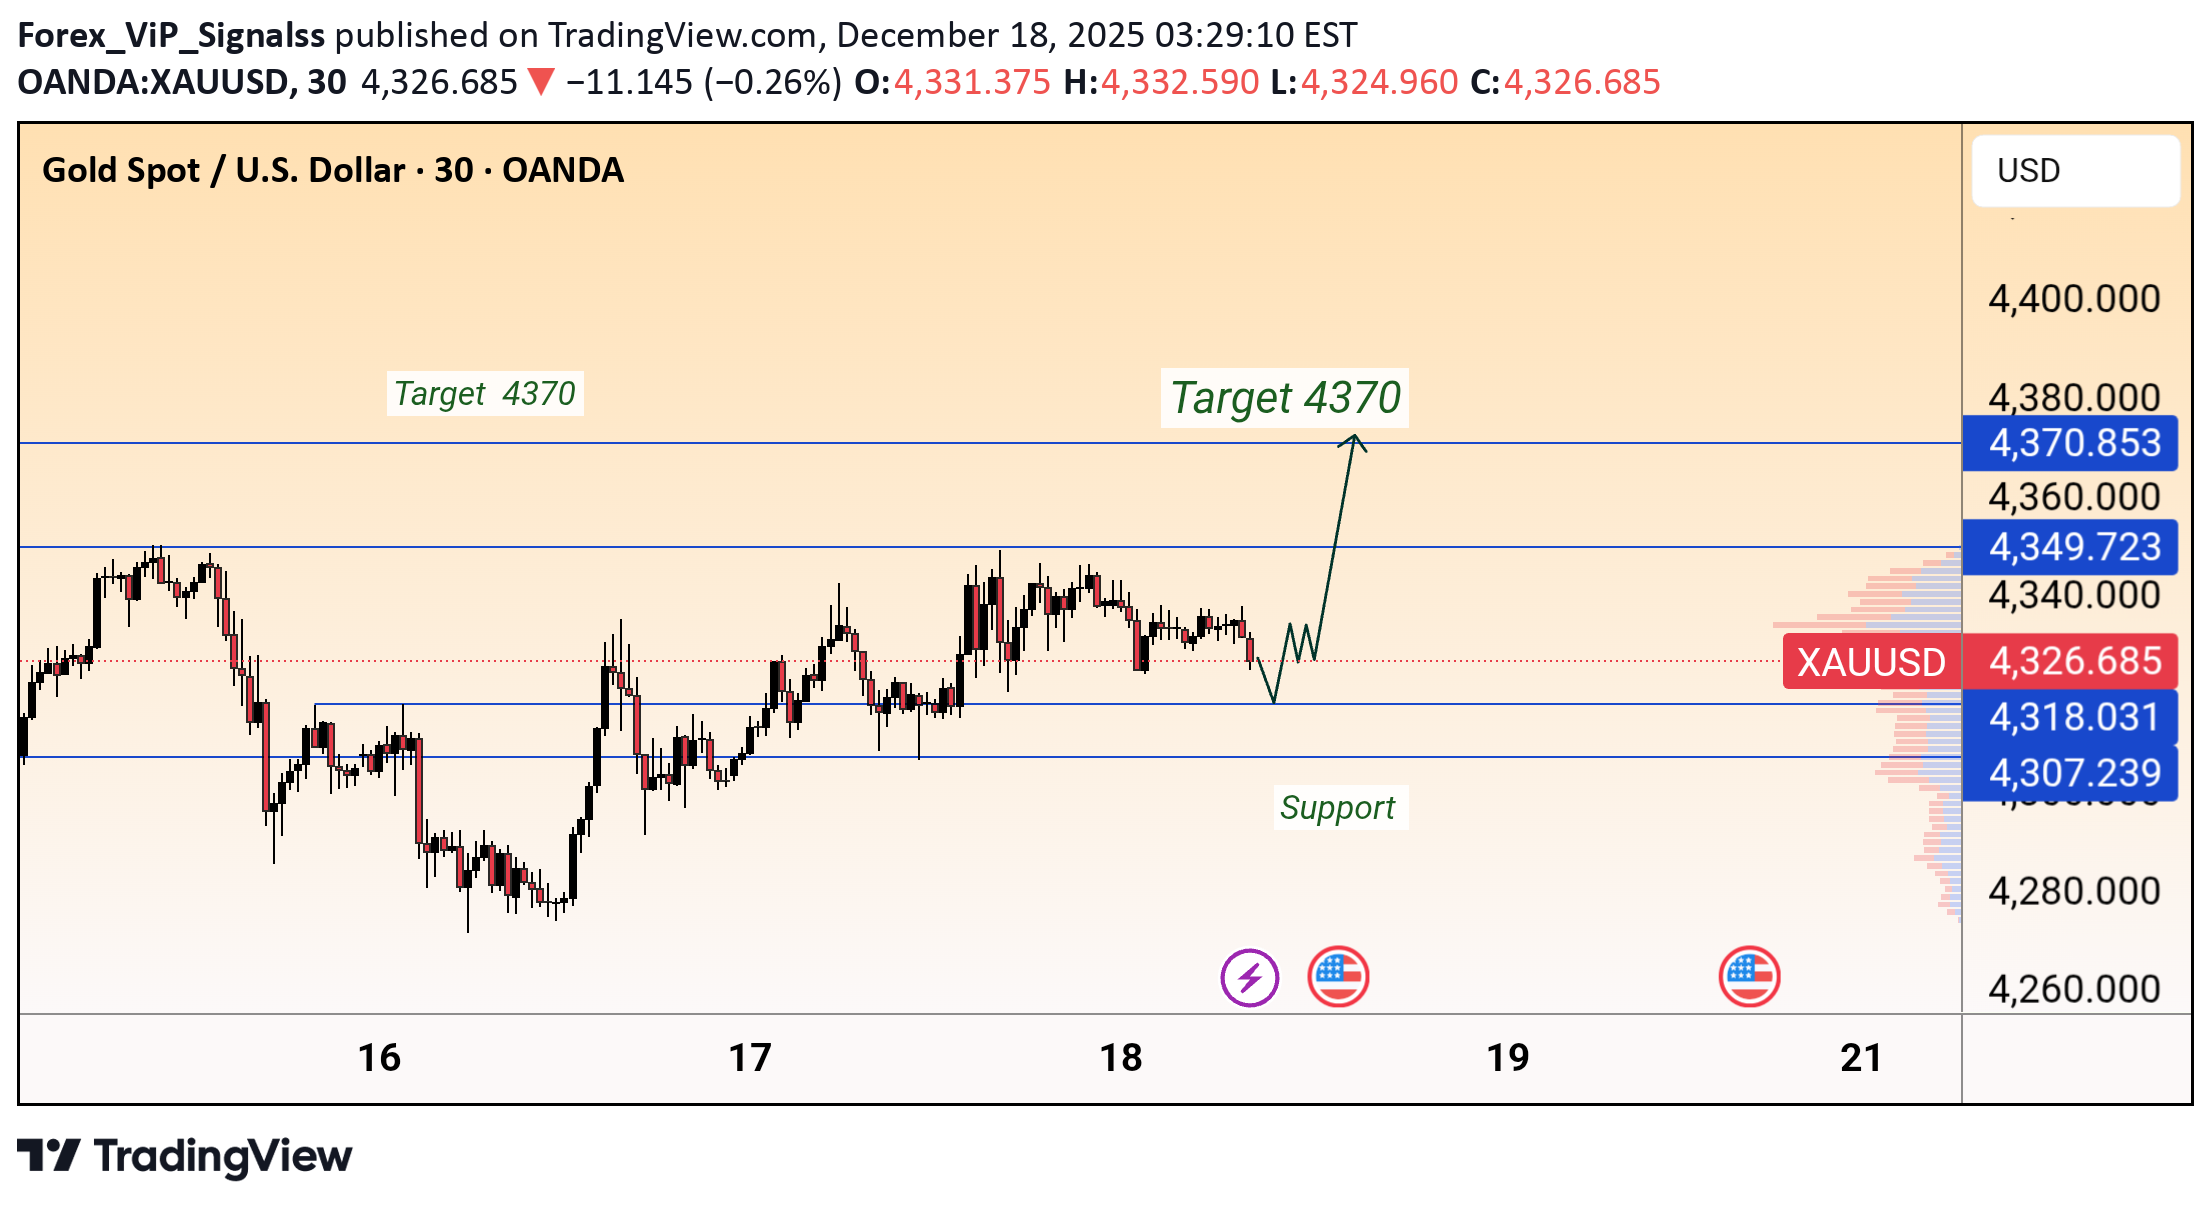
Gold is holding above key support around 4318–4307. A bounce from this zone may trigger bullish momentum, with an upside target near 4370. Break below support could weaken the setup.Keep hold gold will spike up exact same moveTarget hit
Forex_ViP_Signalss
حمایت حیاتی طلا حفظ شد: خیز احتمالی تا ۴۳۷۰!
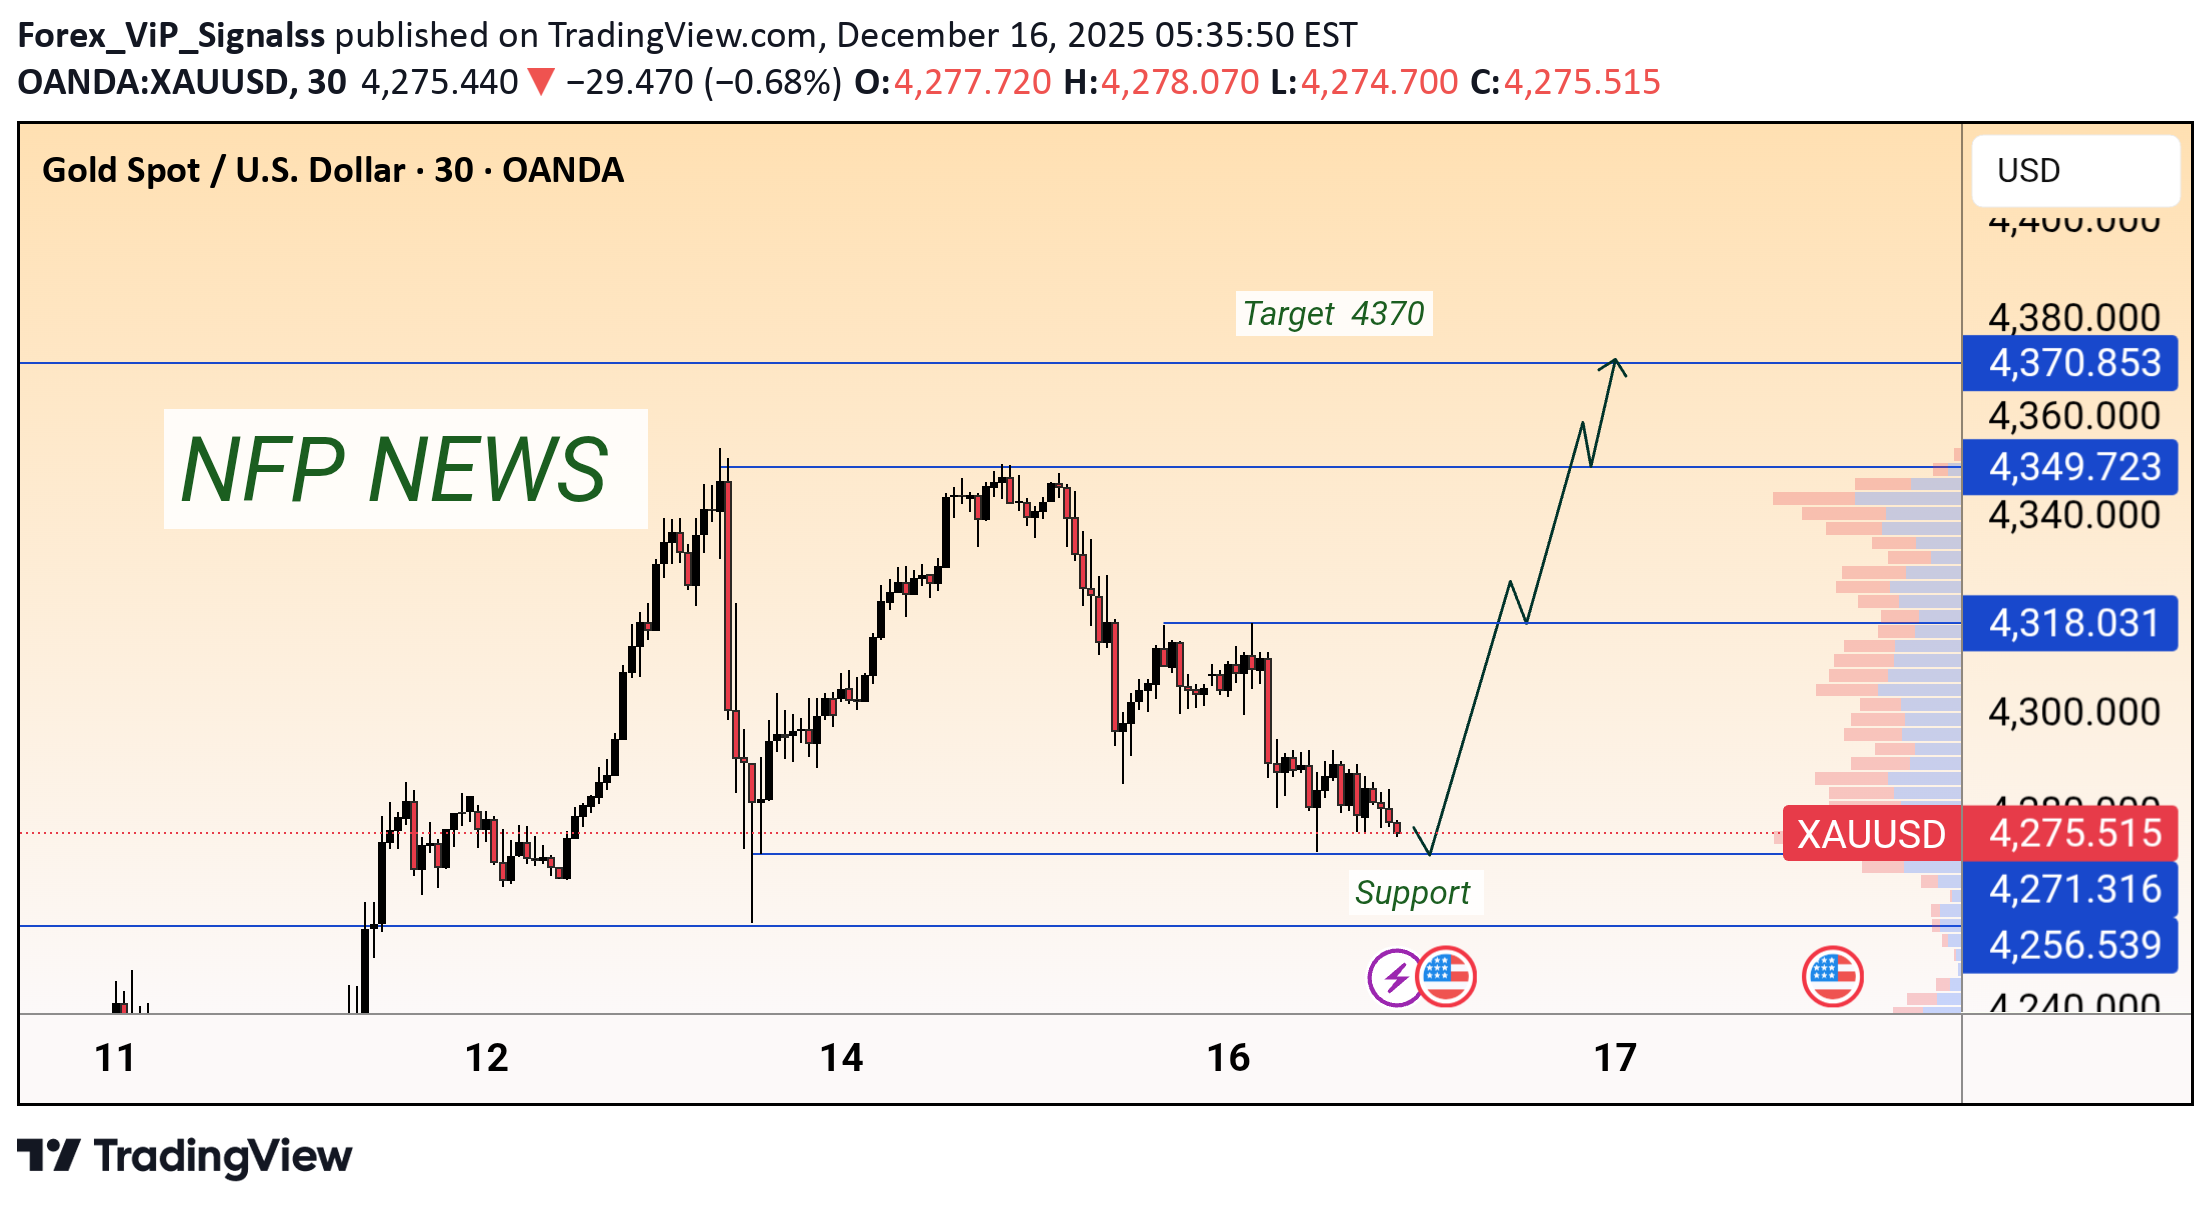
Gold is holding above a key support zone around 4270. A bounce from this area could trigger a bullish move toward 4318 → 4350, with an extended target near 4370. Bias remains bullish above support.Exactly same moveTarget hit
Forex_ViP_Signalss
XAUUSD Bullish Continuation Setup
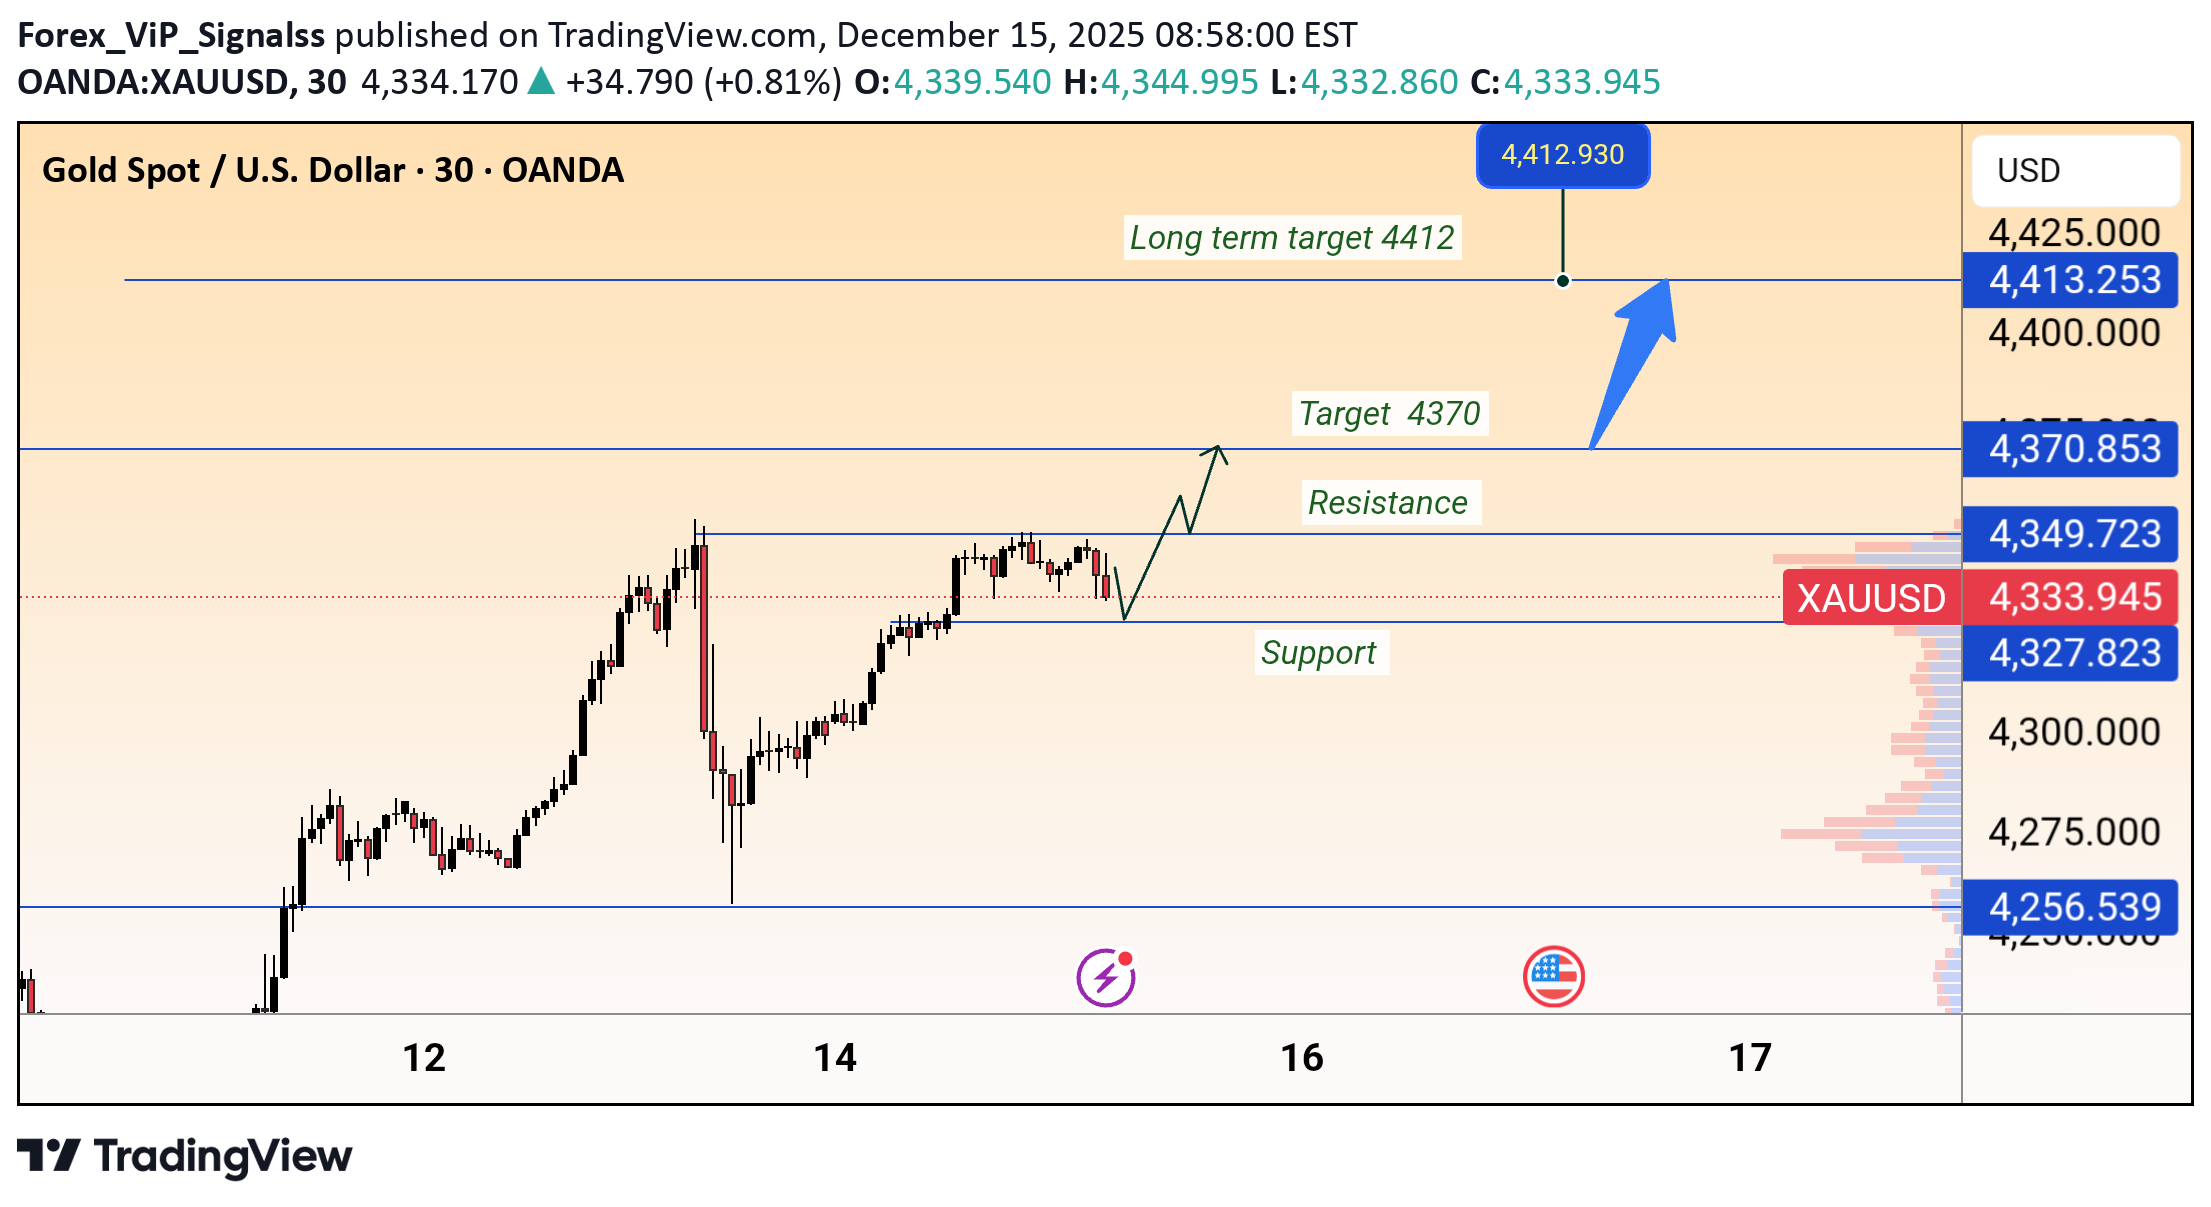
XAUUSD is holding above key support, showing bullish momentum. A break above resistance may push price toward 4370, with a long-term target near 4412.
Disclaimer
Any content and materials included in Sahmeto's website and official communication channels are a compilation of personal opinions and analyses and are not binding. They do not constitute any recommendation for buying, selling, entering or exiting the stock market and cryptocurrency market. Also, all news and analyses included in the website and channels are merely republished information from official and unofficial domestic and foreign sources, and it is obvious that users of the said content are responsible for following up and ensuring the authenticity and accuracy of the materials. Therefore, while disclaiming responsibility, it is declared that the responsibility for any decision-making, action, and potential profit and loss in the capital market and cryptocurrency market lies with the trader.