
ForexFlights
@t_ForexFlights

What symbols does the trader recommend buying?
Purchase History
پیام های تریدر
Filter
ETHISD H4

Certainly! Here's a comprehensive analysis for ETHUSD (Ethereum/US Dollar) based on the latest available data: Technical Analysis: Moving Averages : The current sentiment based on moving averages is mixed. Some short-term moving averages suggest a **buy** signal, while longer-term ones indicate a sell. Oscillators : Indicators like RSI and MACD are showing **buy** signals, suggesting bullish momentum. Pivot Points: The pivot point for ETHUSD is at 3,262.85, which acts as a crucial level for traders to watch. Support and Resistance Levels: First Resistance Level (R1): 4,045.80 Second Resistance Level (R2): 4,089.90 First Support Level (S1): 2,989.64 Second Support Level (S2): 2,469.50 Fundamental Analysis: The fundamental outlook for Ethereum is influenced by the overall sentiment in the cryptocurrency market, regulatory news, and technological advancements within the Ethereum network. Market Sentiment: The market sentiment is currently cautious due to various global economic factors affecting the cryptocurrency market. Regulatory News: Any upcoming regulations or government statements regarding cryptocurrencies can significantly impact the price. Network Updates: Ethereum's transition to Ethereum 2.0 and its impact on scalability and transaction fees is a positive fundamental factor. Conclusion : Given the mixed signals from technical indicators and the cautious market sentiment, it's essential to be mindful of the support and resistance levels when considering a sell position. The fundamental factors such as network upgrades can have a long-term positive impact, but short-term price movements are likely to be influenced by market sentiment and technical levels. Please note that this analysis does not constitute investment advice and is for informational purposes only. It's always recommended to do your own research and consider your risk tolerance before trading.

XAUUSD is bearish or bullish? Write your idea.

XAUUSD FUNDAMENTALS AND TECHNICAL ANALYSIS: Technical Analysis: Sell Signals: Technical indicators are showing a strong sell bias. RSI: The Relative Strength Index is indicating overbought conditions, suggesting a potential pullback. Fundamental Analysis: Record Highs: Gold prices have surged to record levels above $2,400 due to geopolitical tensions and rate cut expectations. USD Strength: A strong US Dollar, driven by the Federal Reserve's interest rate stance, is putting pressure on gold prices. Conclusion: The combination of overbought technical signals and fundamental pressures from a robust US Dollar could lead to a bearish scenario for XAUUSD. Traders might consider this analysis when making decisions, keeping in mind that market conditions can change rapidly. Always ensure to use proper risk management strategies.Targete near to reached
Gold will reach 2400 within couple of days

The price of the Gold fell yesterday 2319 after recent highs. Now the price technically reaching the lower support trending line to pull back in the uptrend direction. This way the market will reach 2400 with coming couple of days . For more updates and information keep following me and hit your like if you like my idea and also share your thoughts in comment below.The price of the Gold followed my chart pattern and continuously went up and reached 2395 with 600++ pips win and this is the lucky day to make this , while getting 600+ pips just I am 50 pips behind the target. It’s not worthwhile as we had completed 600+ pips.
Technically Bullish ETHUSDT

Now, look here and find below Here are some reasons why Ethereum (ETH) against the U.S. Dollar (ETHUSD) might be considered bullish: 1. Historical Significance: Ethereum is the world's second-most famous blockchain network. It birthed DeFi (decentralized finance) and started the NFT (non-fungible token) craze, attracting billions of dollars into the cryptocurrency market. 2. Technical Analysis: - Inverse Cup and Handle Pattern: On the hourly chart, ETHUSD has formed an inverse cup and handle pattern at the top of its uptrend. The breakdown of the neckline of this pattern, coupled with the breakdown of the ascending channel, suggests a potential reversal. - Bullish Trend Line: There is a key bullish trend line forming with support at $3,550 on the hourly chart of ETH/USD. This trend line indicates positive sentiment. 3. Price Movements: - Ethereum recently started an increase from the $3,500 support zone. - It is trading above $3,550 and the 100-hourly Simple Moving Average. - Immediate resistance lies near $3,630, with major resistance at $3,650. A break above this level could lead to further gains. - If ETHUSD surpasses $3,800, it might rally toward $3,880 and even test $4,000.Keep following me more updates and keep patience
XAAUSD (H1): Fundamental and Technical Analysis

The fake breakout is done last day now it will fall near again the support of 2206 or 2200 to be bullish again. Share your precious thoughts in comment below and support me if you like my ideas.
SPX500 (H4) GOIN DOWN
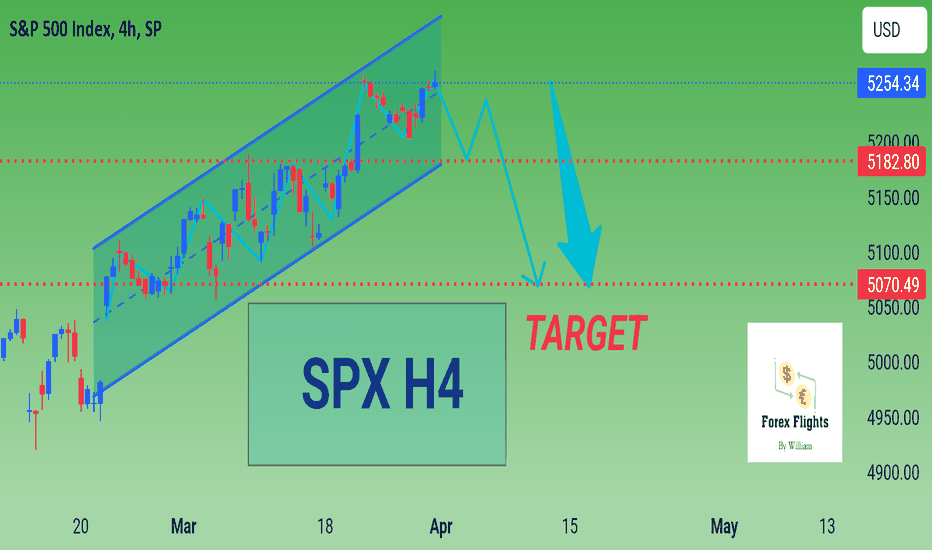
SPX500 (H4) GOIN DOWN SPX500 Prize know 5254.34 The price of SPX500 going down near 5070.49 SPX500 get ready to trade 🟰🟰🟰🟰🟰🟰🟰🟰🟰🟰🟰🟰🟰 Note: COMMENT, FOLLOW AND LIKE. 🟰🟰🟰🟰🟰🟰🟰🟰🟰🟰🟰🟰🟰Keep following me for more updates and information regarding this pair and also you can find analysis for more pairs.
XAUUSD next upcoming target is bullish.

The price of Gold is trying to reach and break the Upper resistances to make another record price of the history and it soon break the previous resistance to reach my target and will fly continuously.Congratulation target reached
ETHUSDT(4HOURS) : BULLISH TREND IS COMING

The price of the second leading Coin will increase its value in the open electronic marketplace, in the coming days the value of coins will be increased for transaction the future. KEEP following me for further updates related with this coin. 🟰🟰🟰🟰🟰🟰🟰🟰🟰🟰🟰🟰🟰 Note: COMMENT, FOLLOW AND LIKE. 💯💯💯💯💯 🟰🟰🟰🟰🟰🟰🟰🟰🟰🟰🟰🟰🟰More the 60% of the target had been achieved and wait for next update.Going to targetTARGET running 50%Keep patience for more updates
BTCUSD (H4) : The price of the BTC about to show bullish power.

BTCUSD (H4) : The price of the BTC about to show bullish power. The price recently broke some previous records near 69k and reached at 73k+ and then fall back into deep and now it's running near 62k. The upcoming target had been observed that the price of BTC will reach again at 68k. Thd buyers get yourself ready to fly again and support me and follow me as I can work for you more efficiently. 🟰🟰🟰🟰🟰🟰🟰🟰🟰🟰🟰🟰🟰 Note: COMMENT, FOLLOW AND LIKE. 🟰🟰🟰🟰🟰🟰🟰🟰🟰🟰🟰🟰🟰TARGET nearTarget reached my target and wait for more signals and analysis.
Disclaimer
Any content and materials included in Sahmeto's website and official communication channels are a compilation of personal opinions and analyses and are not binding. They do not constitute any recommendation for buying, selling, entering or exiting the stock market and cryptocurrency market. Also, all news and analyses included in the website and channels are merely republished information from official and unofficial domestic and foreign sources, and it is obvious that users of the said content are responsible for following up and ensuring the authenticity and accuracy of the materials. Therefore, while disclaiming responsibility, it is declared that the responsibility for any decision-making, action, and potential profit and loss in the capital market and cryptocurrency market lies with the trader.