
ForexCollege
@t_ForexCollege

What symbols does the trader recommend buying?
Purchase History
پیام های تریدر
Filter
ForexCollege
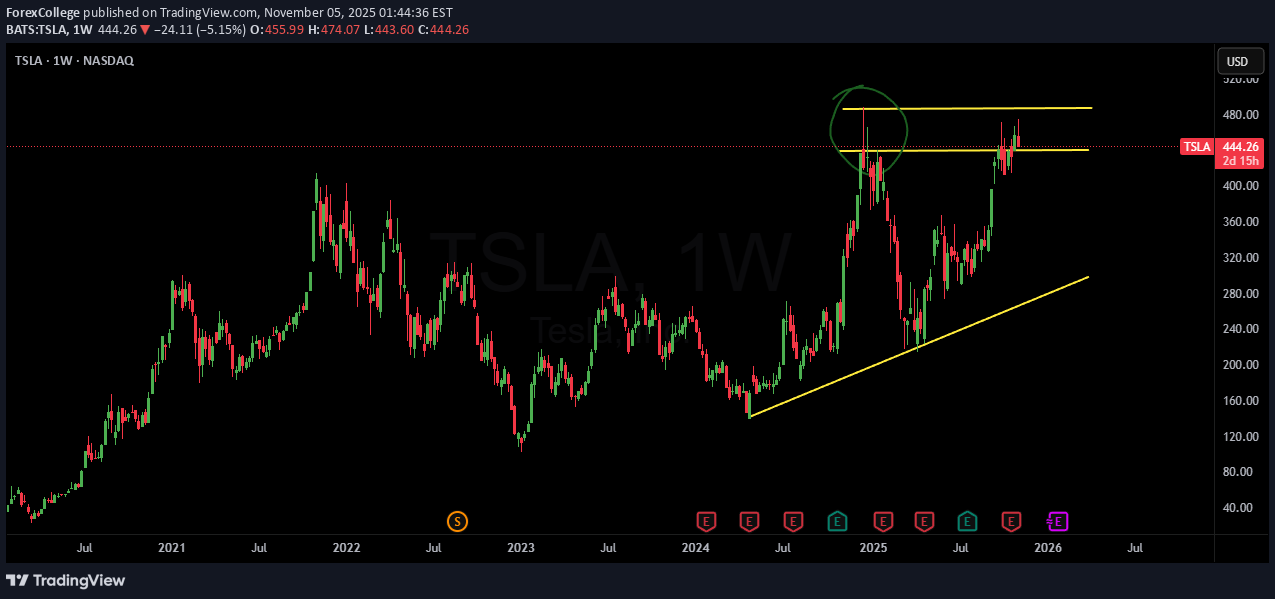
Year ahead 26'

Can we anticipate a trend continuation for 2026? Strong bullish action still in play and we have a well defined up trendline. Share your opinion, if you like.
ForexCollege
منطقه معاملات هیجانی: کشف نقاط تصمیمگیری با تحلیل رفتار کندل استیک
Behavior Analysis combined with your price-action trading skills can help tremendously in making your trading decisions. I believe that candlestick wicks (shadow) show us where traders will act emotionally before executing their trades. These wicks indicate earlier price rejection and create and area where emotions take over before execution. Decision time.
ForexCollege
سطوح حمایت عاطفی بیت کوین: آیا خرسها میتوانند این مرز روانی را بشکنند؟
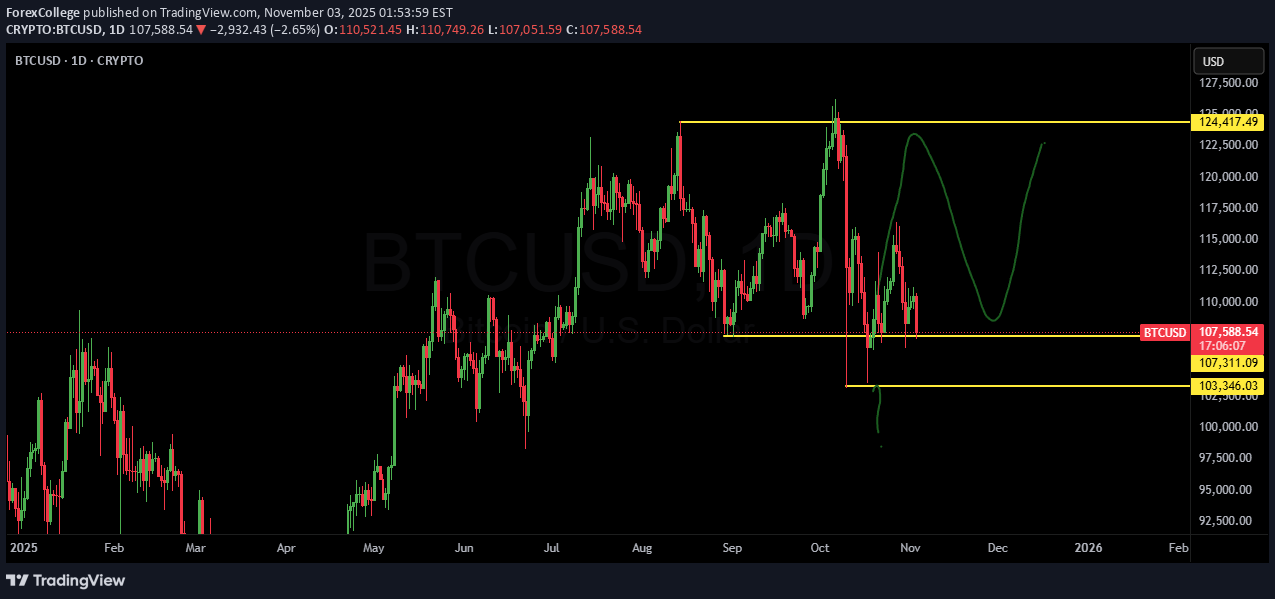
Let me hear your thoughts. Do you think the the bears (sellers) have it in them to break this emotional support area? I use candlestick wicks (shadows) to identify where traders might make emotional trading decisions, and its been working pretty well for me over the years. I call it BAM - Behavioral Analysis Model. DM if you like to know more.Will wait for end of day to see if the bears have the momentum to break this support zone.Will this bearish momentum force a trend direction change.
ForexCollege
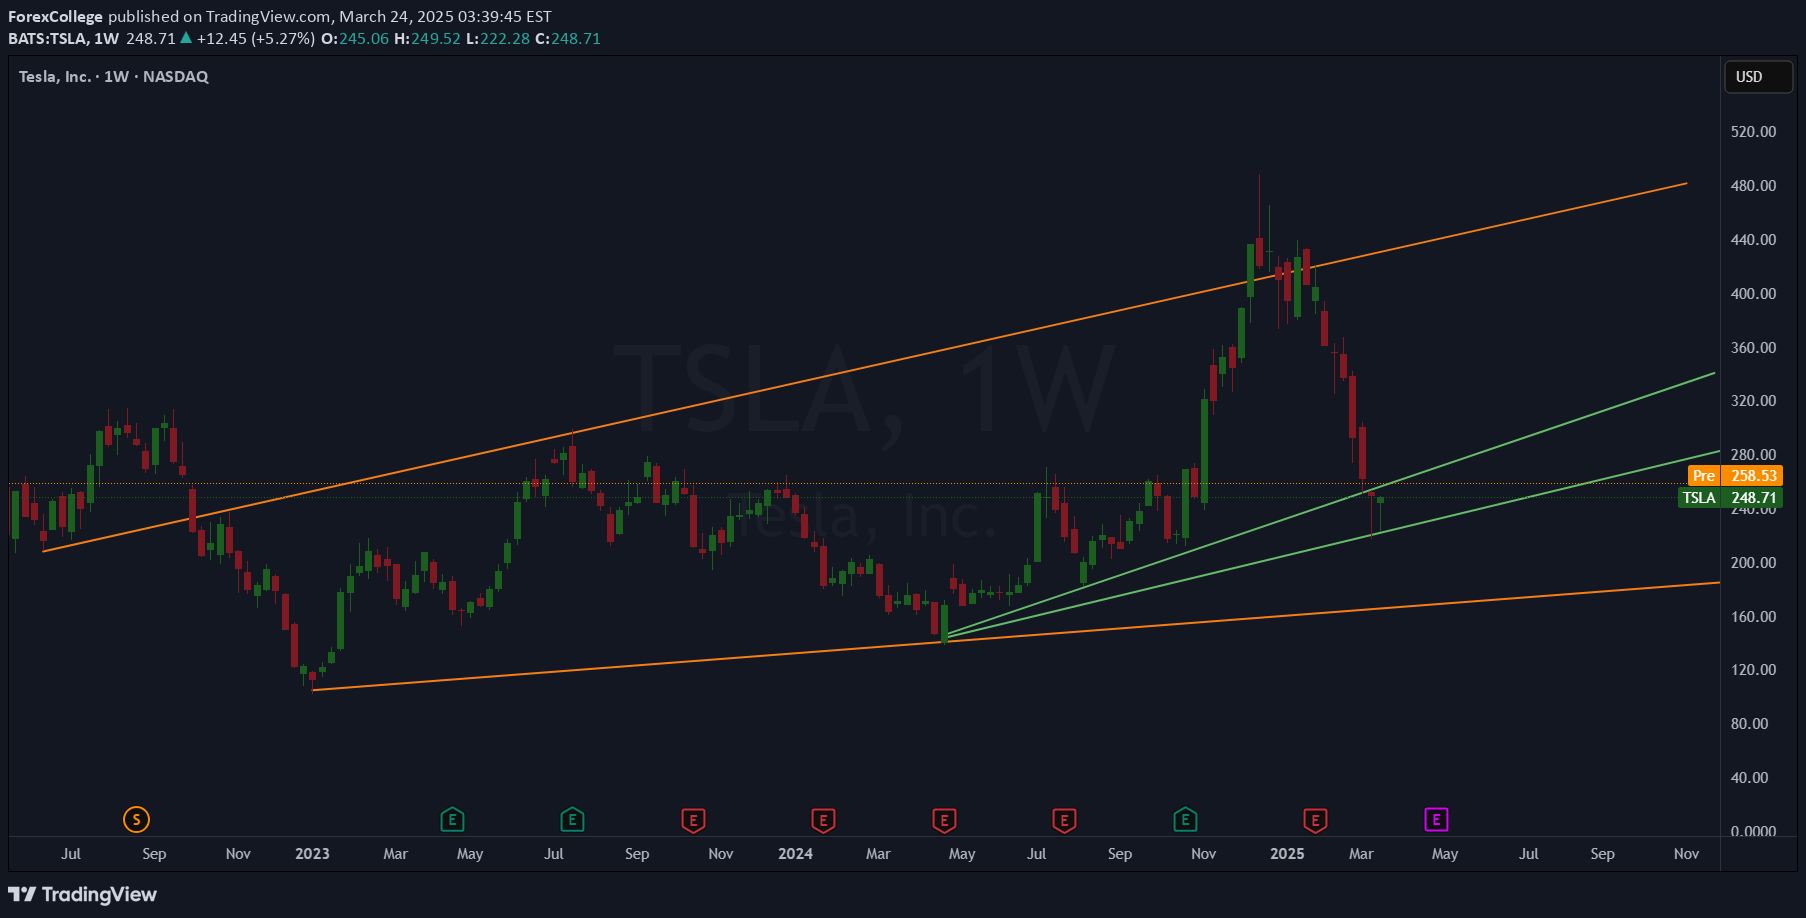
Tesla Share Price at Key Technical Level
Tesla’s share price has returned to a well-established upward trendline. The key question now is: will this trendline act as support and trigger a bounce, or will it be breached, attracting further selling pressure and pushing the price lower? We’d love to hear your thoughts — will the bulls defend this level, or are the bears gaining ground?Tesla paid us well as close positions before December. For our traders who followed our trading insight and trade according to our price-action trading strategies, well done!! See you around. It is summer in South-Africa give me a call when you in Johannesburg and we can meet up.
ForexCollege
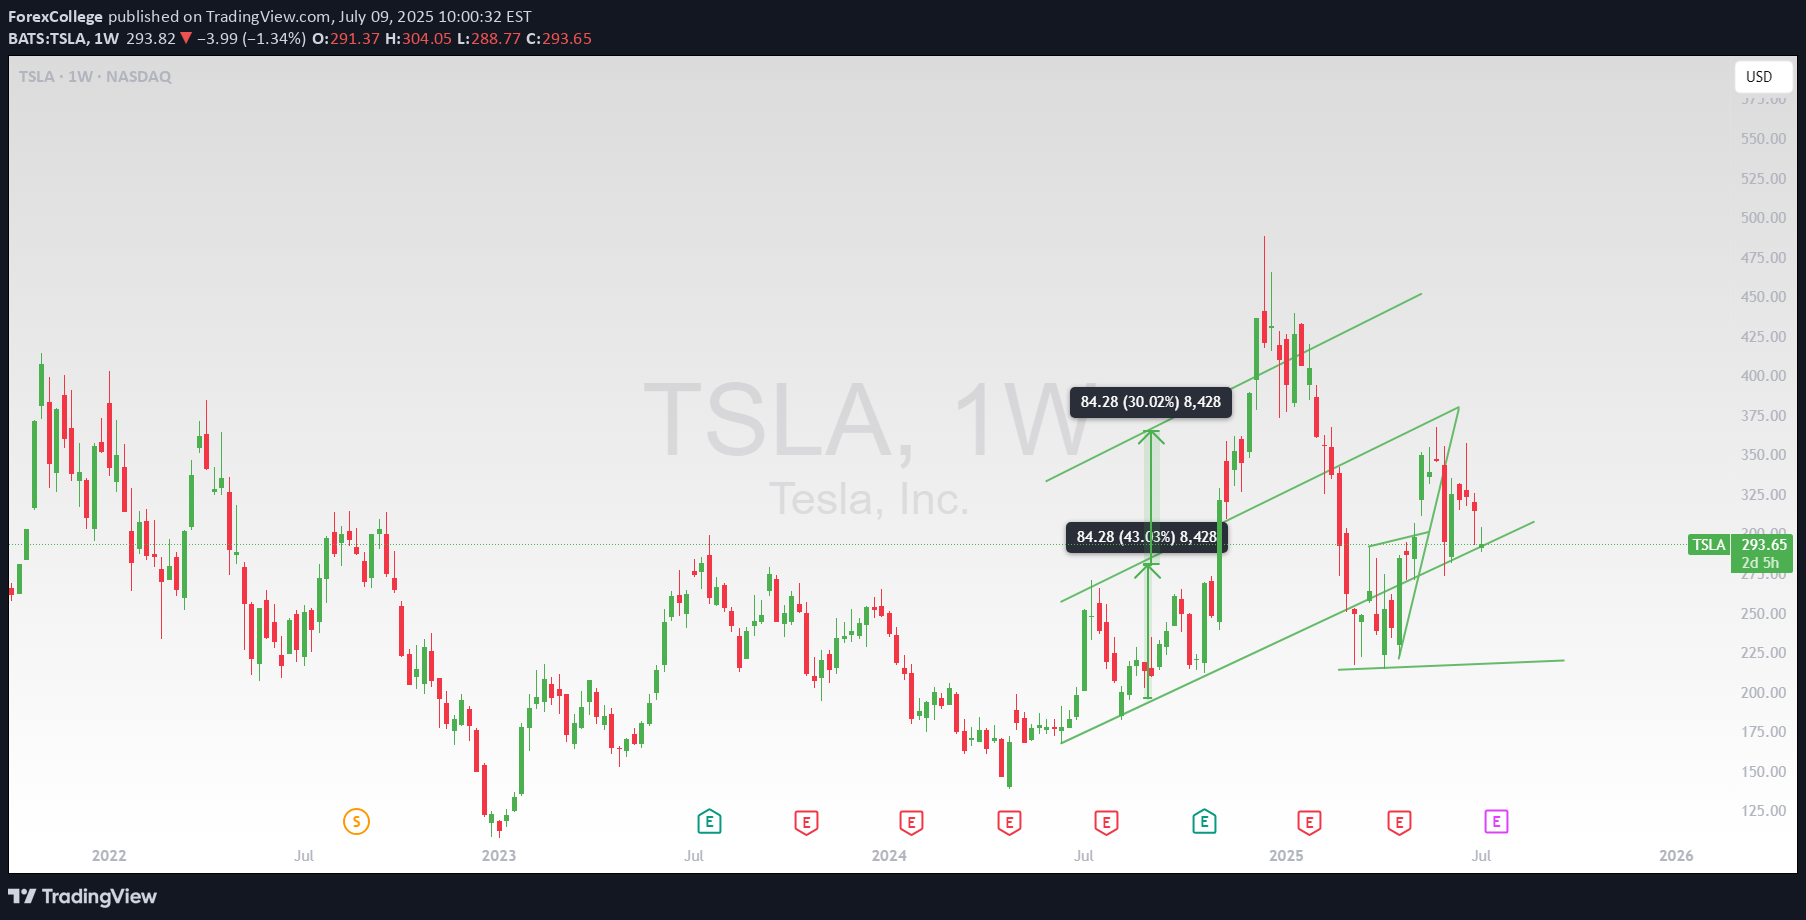
Tesla The Power of Candlesticks in Action!
On this Tesla (TSLA) chart, we’ve spotted two bullish candlestick patterns—but will they spark upside momentum? 📈 Will buyers step in on this signal, or is there more downside ahead? 🤔 From Bitcoin, we’ve seen that demand can be created even without a physical product—will TSLA follow the same psychology? Let’s watch how price reacts! 🚀📊 #Tesla #StockMarket #CandlestickPatterns #Trading #BullishOrBearishMonday 24 March was not a bad day for Tesla share price, will we see speculators pushing prices higher? Share your thoughts.Candlestick and price-action power proofed to be reliable once again.
ForexCollege
Bitcoin Bullish or Consolidating

🚀 Bitcoin Price Action Update 🧑💻I was asked for my thoughts on Bitcoin with the USA embracing crypto. Here's my technical analysis:📈 Current Outlook:Bitcoin is trading strong bullish above a rising trendline. You can see my bullish anticipation on the chart.⚖️ Balanced Perspective:As an insight provider, I avoid locking into one bias. Markets fluctuate, and probabilities matter. An alternative scenario could see Bitcoin range between horizontal Resistance and Support, or even break the rising trendline.⏰ My Trading Approach:I enter trades on lower timeframes for precision, but I rely on daily and sometimes weekly timeframes to confirm major trend directions.What's your take? Share your thoughts below! 👇#CryptoAnalysis #Bitcoin #PriceAction #TechnicalAnalysis
ForexCollege
Year ahead 25' BTC

Weekly Analysis UpdateLooking ahead for the year, the weekly timeframe shows that price remains within a long-term uptrend channel using speedlines. I’ll be shifting to lower timeframes to identify trade opportunities, applying both my trend-following and counter-trend strategies. To maximize returns, I’ll incorporate my profit-enhancing techniques.Always consider all possible moves the price can make and focus on trading the one with the highest probability of success. Patience and precision are key to staying ahead in the markets.Stay tuned for updates as opportunities unfold!
ForexCollege
Bitcoin Technical Analysis: Projected Channel Resistance

Bitcoin Technical Analysis: Projected Channel ResistanceI’ve identified a projected channel line that could serve as resistance if the current level breaks. Here’s the strategy:Resistance Breakout: A breakout above the current resistance could lead to an upward movement, guided by the channel height.Pullback Alert: If the breakout doesn’t happen, I’ll watch the support line closely for candlestick momentum signals, which will help assess if a pullback is temporary or a reversal.Watch for breakout confirmation or momentum shifts to decide your next move. Stay prepared for both outcomes!Channels continue to demonstrate their reliability, as seen in how the channel line acted as resistance. Following the price drop, the uptrend line provided support, holding firm for now. While I was optimistic about a stronger rally, this instrument remains a key focus and will definitely stay on my radar.
ForexCollege
BTC 100k Today.

Will today be the 100k level after the price bounced of a Fibonacci Retracement Level? Only time will reveal the secret.Happy trading!!
ForexCollege
100k in sight

Here we have 100k insight. What do you think, are demand and the bulls strong enough to push prices above 100k still this year?
Disclaimer
Any content and materials included in Sahmeto's website and official communication channels are a compilation of personal opinions and analyses and are not binding. They do not constitute any recommendation for buying, selling, entering or exiting the stock market and cryptocurrency market. Also, all news and analyses included in the website and channels are merely republished information from official and unofficial domestic and foreign sources, and it is obvious that users of the said content are responsible for following up and ensuring the authenticity and accuracy of the materials. Therefore, while disclaiming responsibility, it is declared that the responsibility for any decision-making, action, and potential profit and loss in the capital market and cryptocurrency market lies with the trader.