
ForexClinik
@t_ForexClinik

What symbols does the trader recommend buying?
Purchase History
پیام های تریدر
Filter
ForexClinik
بیت کوین در سراشیبی: سطوح حیاتی ۹۱ و ۸۵ هزار دلار کجاست؟
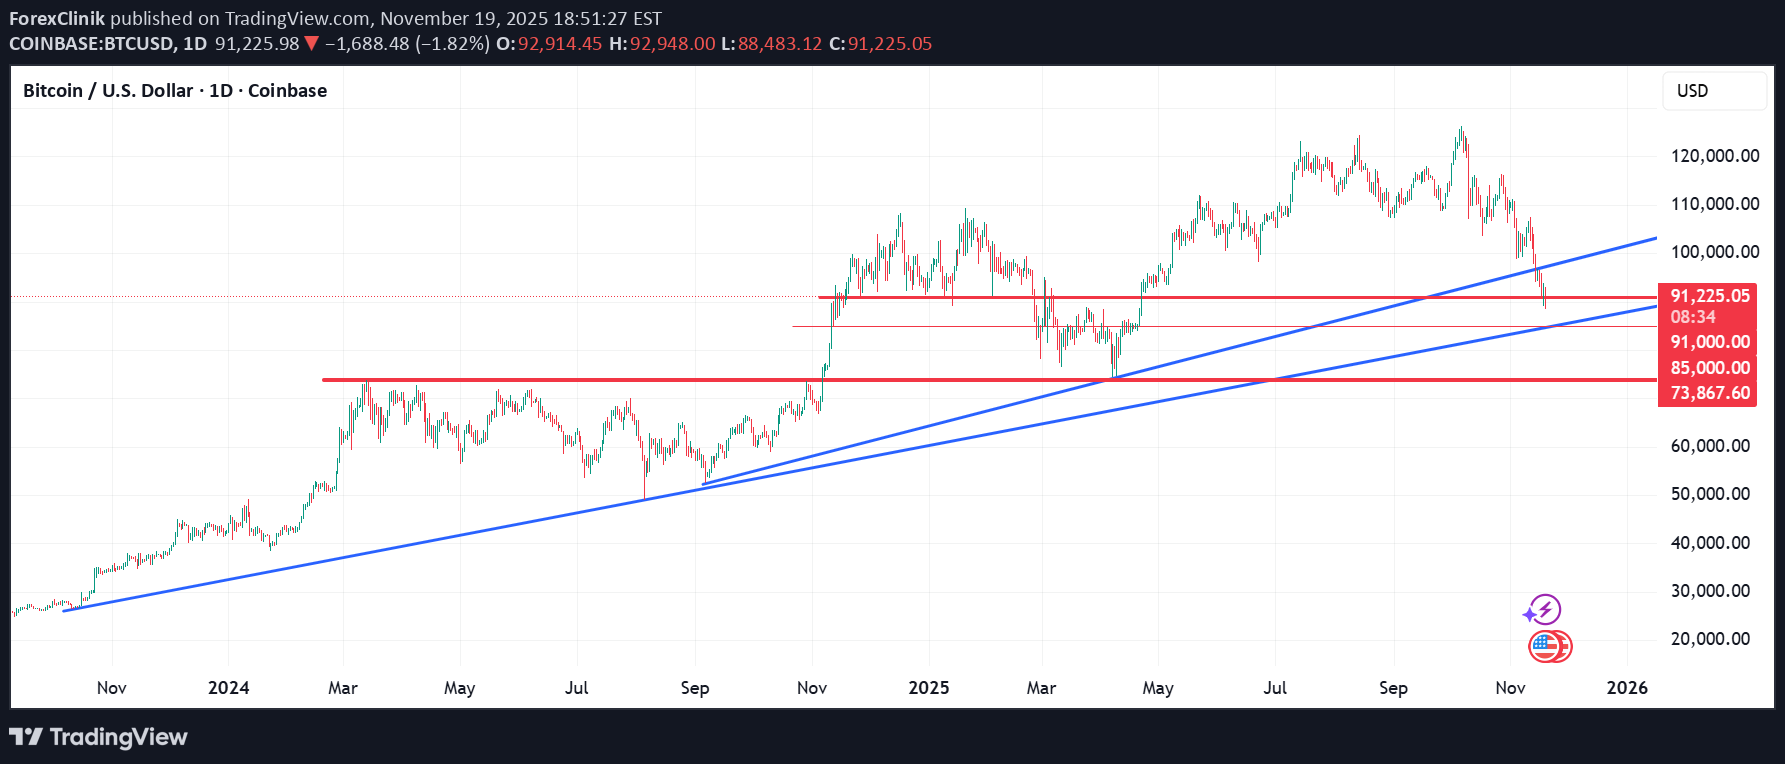
Bitcoin Market Update: Technical Outlook and Key Levels to Watch Bitcoin has pulled back sharply from its 2025 all-time high of approximately $126,500, shedding more than 28% in its current bearish retracement. This decline has led many market participants to ask the critical question: What comes next for investors and traders? In line with the previous analysis, Bitcoin has already broken its first ascending trend line and is now approaching another major trend line that has been in play since October 2023. This level is proving to be an important structural area on the chart. Key Technical Levels 1. Immediate Support — $91,000 Zone Bitcoin is currently sitting on the $91,000 support area. This level remains the most immediate zone holding the market from further decline. If buyers maintain control here, a short-term bounce is possible. A confirmed break below this zone increases the likelihood of deeper corrective movement. 2. Secondary Support — $85,000 Zone Should the $91,000 support fail to hold, the next area of interest lies around $85,000. This level aligns with a major ascending trend line, creating a notable confluence zone, which historically strengthens the probability of a reaction. 3. Downside Risk — $74,000 Zone (Worst-Case Scenario) If the confluence around $85,000 breaks decisively, Bitcoin could slide towards the $74,000 region ( 1st ATH of 2024) This represents a deeper structural correction and would signal a significant weakening of bullish momentum. Market Outlook The current market environment reflects elevated volatility and wide price swings, typical of corrective phases. While long-term fundamentals remain intact for many investors, the short-term technical structure suggests caution. This period can be described as a high-risk phase for crypto participants. Managing exposure carefully, respecting stop losses, and avoiding emotional decision-making are essential until clearer market strength appears.Analysis played out. TA helps to reduce the noise.
ForexClinik
متای متا در آستانه خط روند حیاتی: آیا صعود ادامه مییابد؟
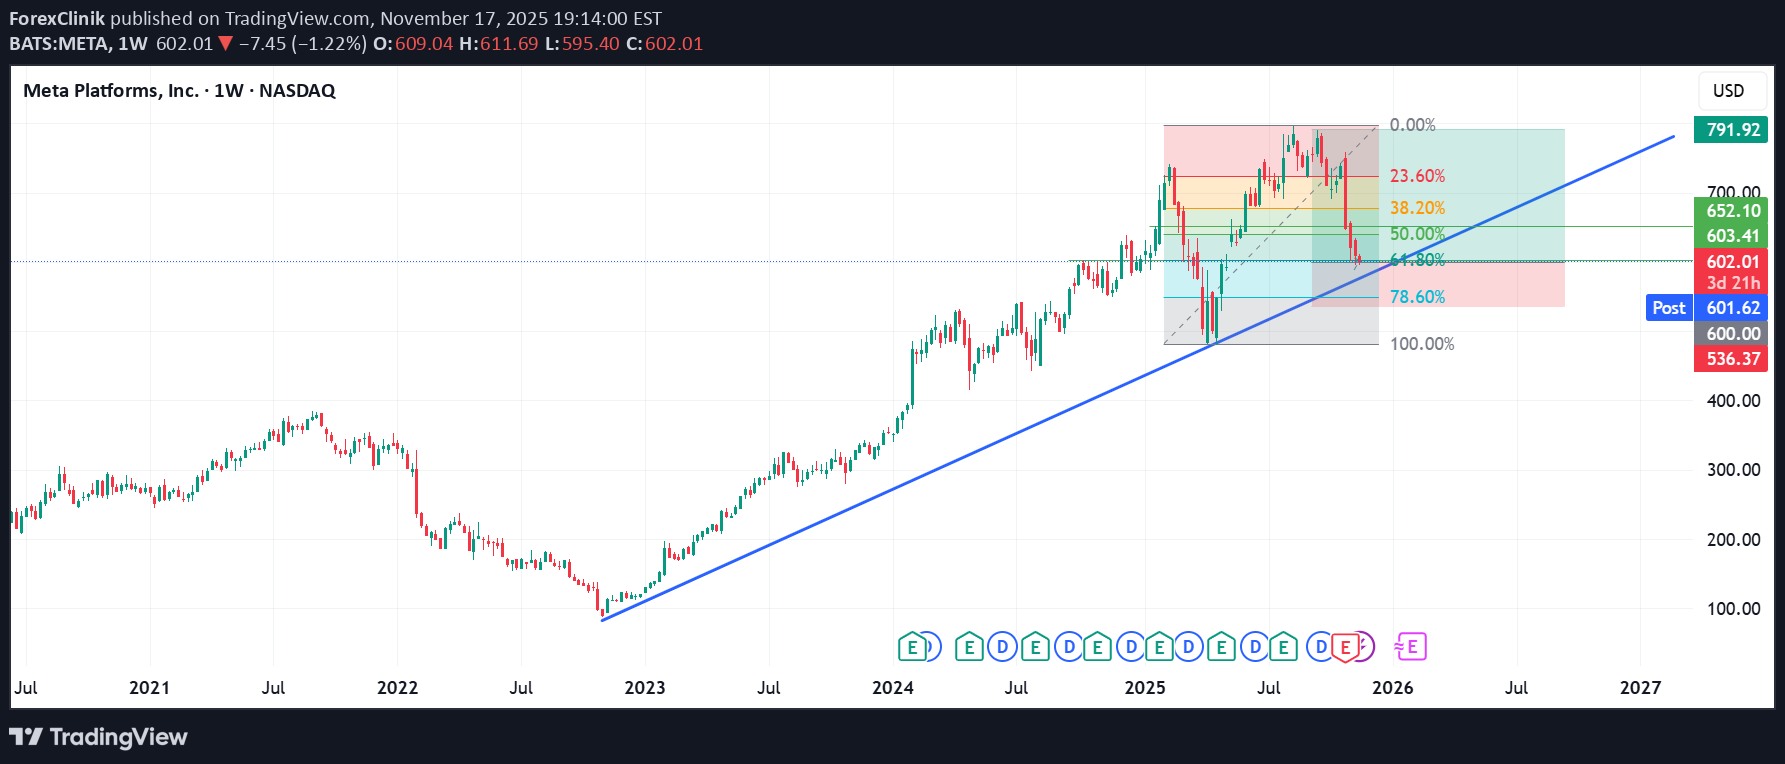
META is approaching a significant technical region. The trendline currently in focus originated on 31 October 2022, and it has remained relevant over time. This same trendline was retested twice in April of this year, and price action is once again moving toward it after achieving a new all-time high. At the moment, the asset is sitting at the Fibonacci 61.8% retracement level — a well-known zone where reversals often occur. Based on this structure, the asset may begin its upward move from the current region, or it may decline by an additional $10–$20 to retest the ascending trendline. I have taken my initial positions in META during this pullback and may increase my exposure if price reaches the trendline. Overall, my outlook remains bullish. Trade responsibly. Entry: RR is 1:3 Confidence: High
ForexClinik
What if Bitcoin drop to $100K
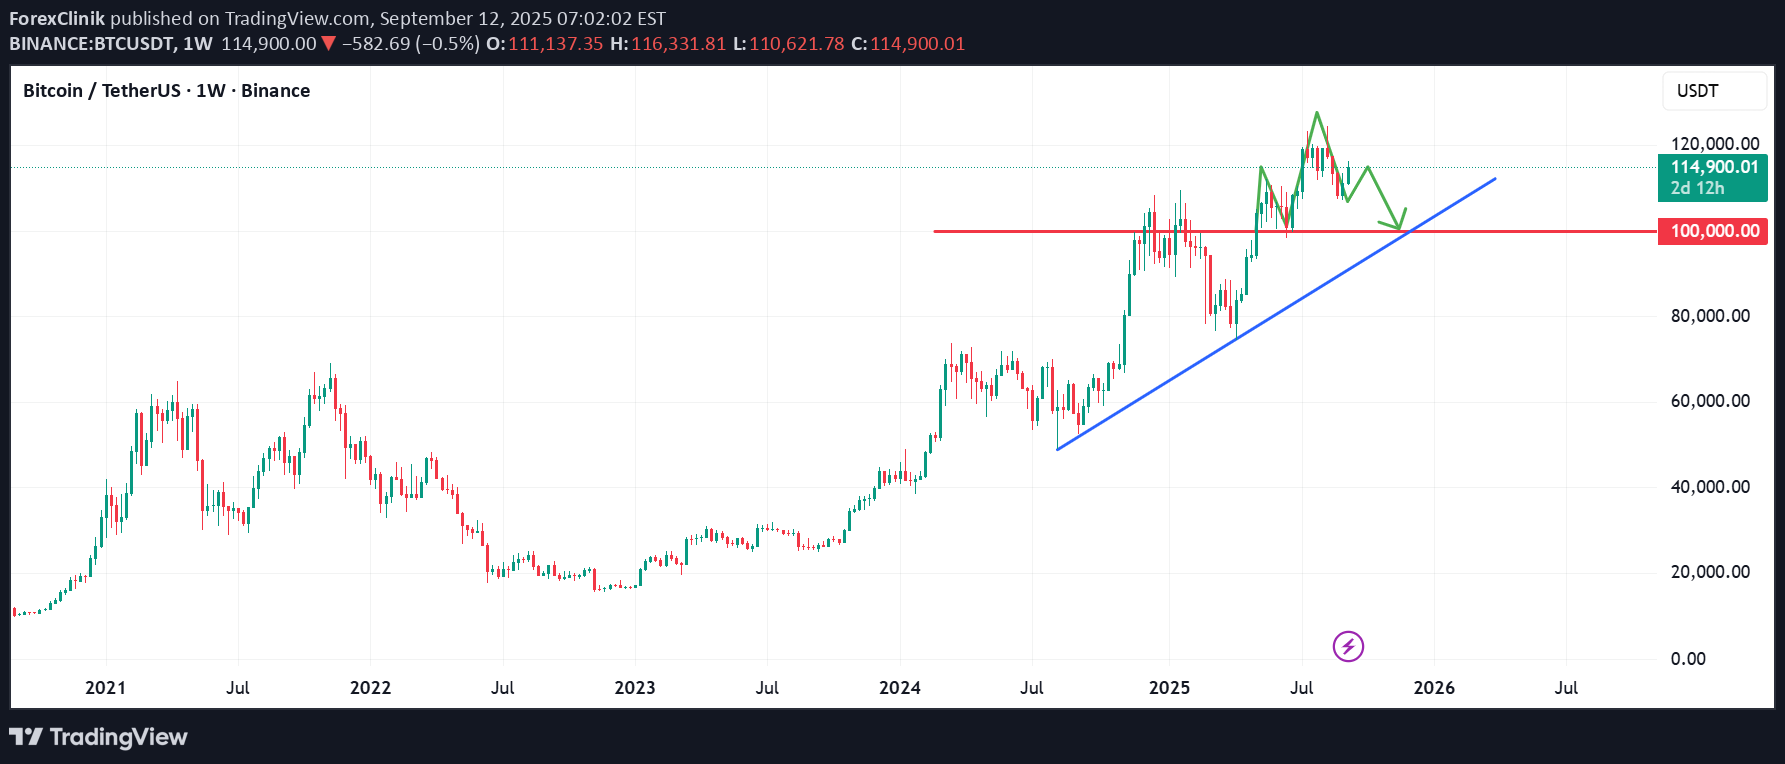
What if Bitcoin drop to $100K? Technically looking at this asset from when it broke the $100K resistance and pushed further up, a possible reversal pattern has been forming. This reversal pattern is a generally accepted pattern called the ''Head and Shoulder'' pattern If this plays out technically, we may see BTC at $100K not far from now. If you found this helpful, like, follow me, subscribe, share and comment. 📌 This analysis is for educational purposes only and not financial advice. Please trade and invest responsibly.
ForexClinik
Gold (XAU): $3700 is the next key resistance
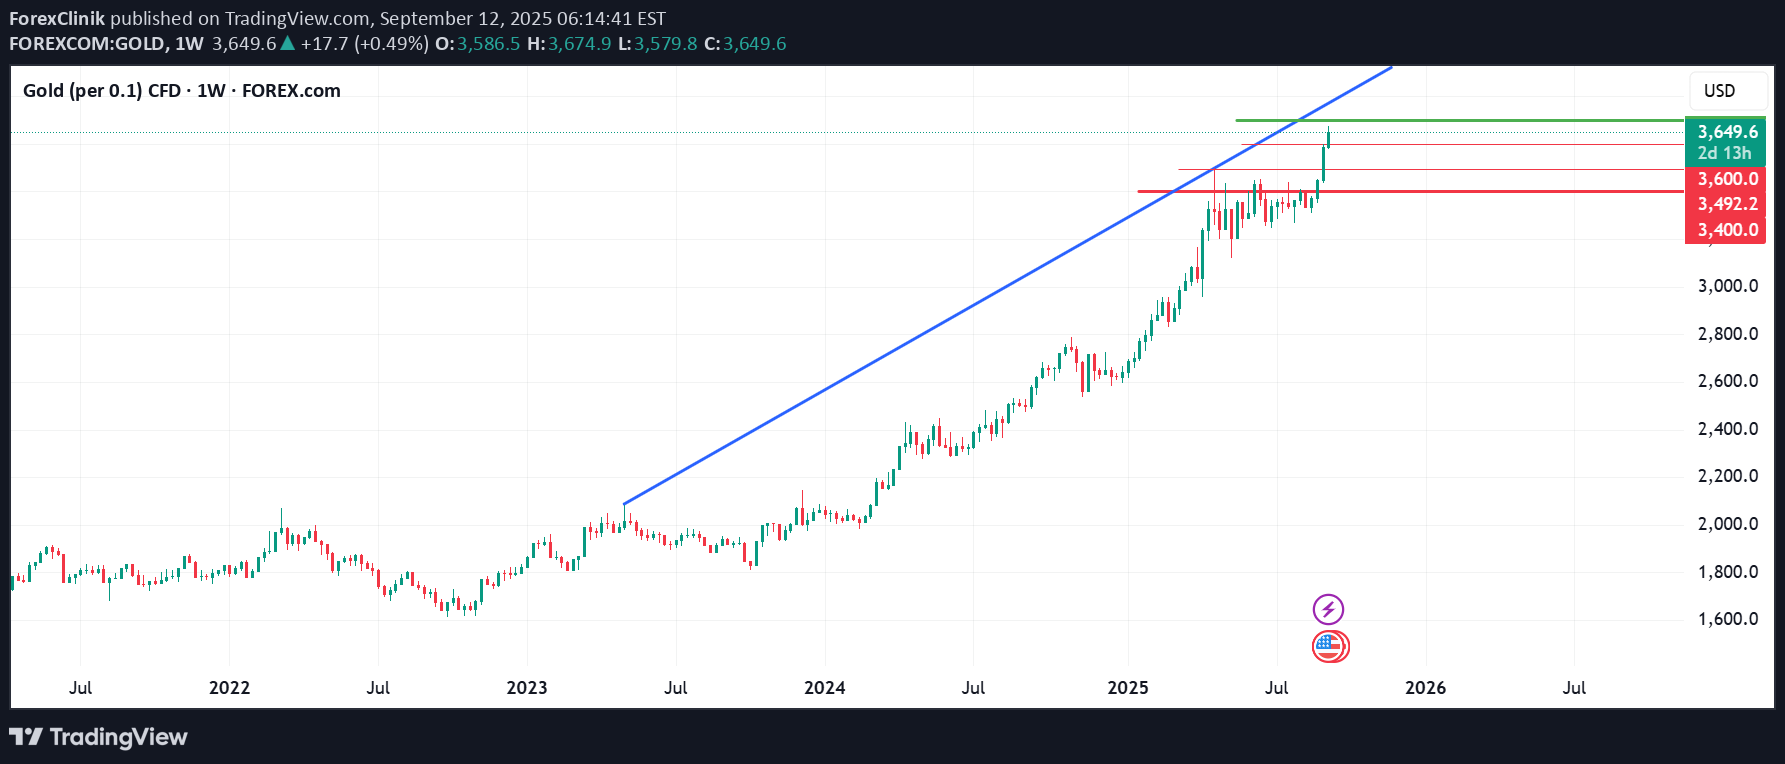
Gold (XAU): $3700 is the next key resistance Gold has continued its impressive rally, with $3,700 emerging as the next key resistance level. The first breakout above the $3,400 psychological zone occurred in late April, followed by a period of consolidation and repeated tests of that level. Last week, the asset gained strong momentum, breaking decisively above this zone and reaching a new all-time high (ATH) of around $3,500. This week, the bullish trend has extended further, with XAU/USD approaching the next critical psychological barrier near $3,700. The key question remains: How much further can ongoing global economic tensions drive gold’s upward movement? Resistance Level: $3,700 Support Levels: $3,600 / $3,500 Key Zone to Watch: $3,400 📌 This analysis is for educational purposes only. Please exercise caution and trade responsibly. If you found this helpful, like, follow me, subscribe, share and comment.
ForexClinik
I am buying AMAZON

I am buying AMAZON Amazon's stock lost over 10% last week, marking a significant decline within just one week. I will start buying using dollar cost averaging (DCA) with $240 as my long-term to mid-term target. I will hold Please like, share, comment and follow. I look forward to connecting with youWe are in good profitHIT TP before it started dropping
ForexClinik
$372 - $360 is imminent

$372 - $360 is imminent. Following a break below the highlighted key support TL, MSTR fall to as low as $370 to $360$370 TP1 hit. We are a few dollars away from TP2 at $360
ForexClinik
BTC is likely to resist falling below $112000

BTC is likely to resist falling below $112000 If the confluence between the yellow trendline and the top green horizontal support level dont hold strong, we are likely to see BTC retrace to $100K Please trade with care. My thoughts are shown on the chart technically I hope to connect with you. Please like, share, comment and follow me.Analysis still active
ForexClinik
My View for SOLANA next move

My View for SOLANA next move. Technically, SOL has been trading within a channel for a while now, with the formation of HHs and HLs. If fundamentals play out positively long to mid-term, we are likely to see SOLNA fall to $150 zone before another upward leg forms. This leg may rally to as high as $220. Trade with care. If you found this helpful, please connect with me. Like, comment and sharethe resistance zone heldAnalysis is still intact
ForexClinik
Is this possible with META

Is this possible with META? META stock is currently trading at $700. My technical view as shown on the chart, is looking at a possible retracement to around $650. The question is ''Is this possible? If it ever gets to this forecasted zone, I will accumulate massively.
ForexClinik
I am bullish on Apple (AAPL)
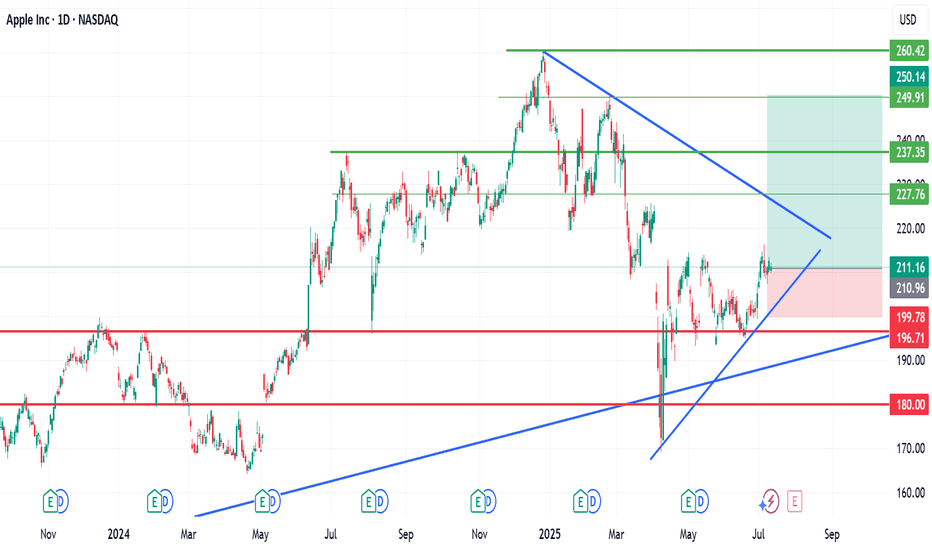
I am bullish on Apple (AAPL) Looking at my cahrt, you will seen my thoughts. $237, $237 and $260 are my medium and long-term buy targets. Trade with care as pullbacks are possible along the journey nortward. Like, follow, share and commentSlowly, but our buy is already in profitCongratulations to everyone who took and held on to this trade
Disclaimer
Any content and materials included in Sahmeto's website and official communication channels are a compilation of personal opinions and analyses and are not binding. They do not constitute any recommendation for buying, selling, entering or exiting the stock market and cryptocurrency market. Also, all news and analyses included in the website and channels are merely republished information from official and unofficial domestic and foreign sources, and it is obvious that users of the said content are responsible for following up and ensuring the authenticity and accuracy of the materials. Therefore, while disclaiming responsibility, it is declared that the responsibility for any decision-making, action, and potential profit and loss in the capital market and cryptocurrency market lies with the trader.